Market rally increases equity risk
Should the recent rally provide comfort or concern for investors? The recent equity market rally has provided relief and some hope to investors but in the face of deteriorating fundamentals, it increases the risk for equity investors. Figure 1 below highlights the extreme price movements we have seen in Australia in 2020.
Figure 1 - Recent rally a continuation of the roller coaster
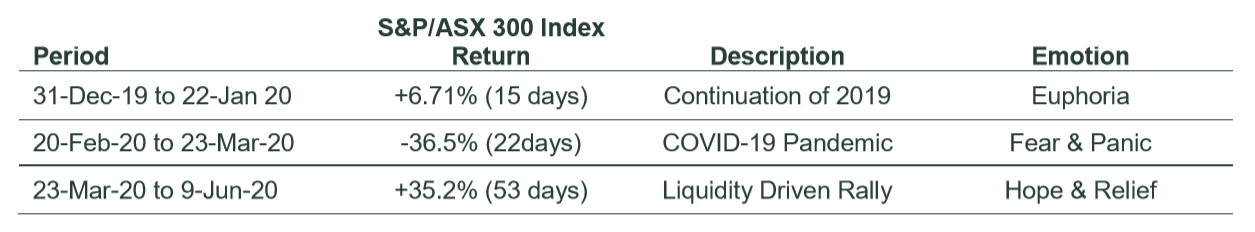
Source: Thomson Reuters, S&P as at 12 June 2020. Past performance is not a reliable indicator of future performance. Index returns are unmanaged and do not reflect the deduction of any fees or expenses.
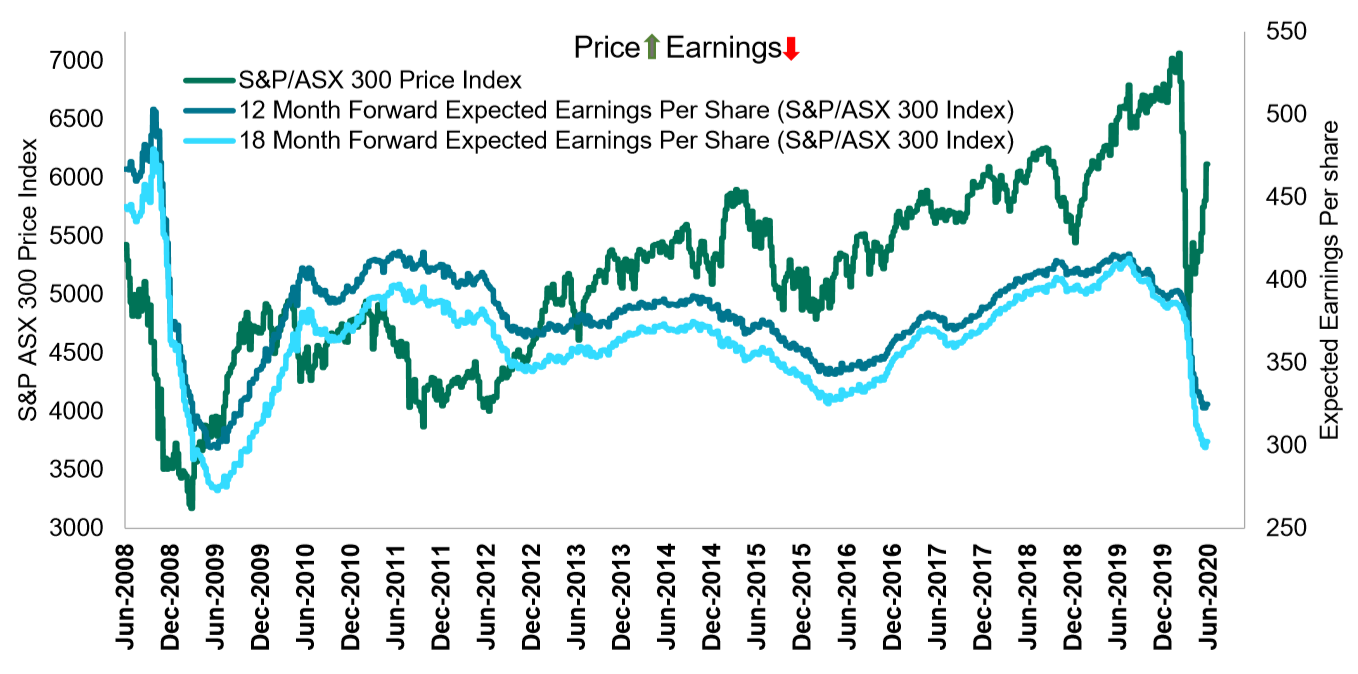
We are all aware of the lower level of economic activity in our communities. We can all see tangible evidence of the slowdown in our daily lives, from the activity in the streets and stores and from restaurants to real-estate. So far, Australia and New Zealand and other select countries have fared better than many, but our economy still faces much uncertainty from either a second wave or from a deteriorating outlook for the global economy. Company earnings have been significantly impacted as can be seen in Figure 2 below.
The earnings per share estimates (blue lines) for the S&P/ASX 300 Index are still trending down. Figure 2 also illustrates the recent rally of the S&P/ASX 300 index (green line), compared to the expected earnings for the next 12 and 18 months (blue lines). The divergence between the market rally (green line) and expectations for company earnings (blue lines) is clear. The recent rally now places the equity market on the highest multiple in the last 12 years. The recent equity market rally has priced in a V-shaped recovery exposing investors to risks if the recovery does not eventuate as priced.
Figure 2 - Growing Divergence Between Price (Green line) and Earnings (Blue lines)
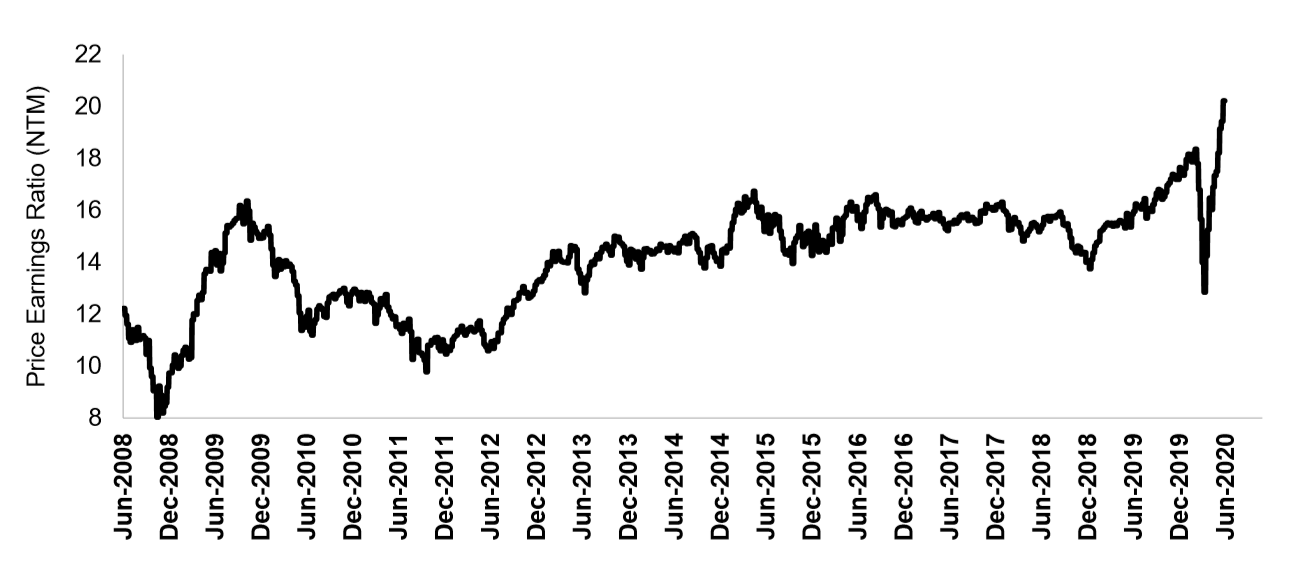
Valuation: Price Earnings Ratio based on expected Earnings Per Share (EPS) for the next twelve months (NTM)
Source: Refinitiv Datastream as at 12 June 2020. Past performance is not a reliable indicator of future performance. Index returns are unmanaged and do not reflect the deduction of any fees or expenses. The blue lines are the expected earnings per share for the S&P/ASX 300 index. It is looking at both 12 months forward and 18 months forward. The green line is the price index for the S&P/ASX 300 index.
Explosion of online brokerage accounts
A number of online brokers are reporting an increase in new accounts being opened. The prevalence of very low-cost trading, combined with volatility, financial market liquidity and the COVID-19 lockdown boredom might partially explain the increased presence of online trading. Robinhood.net is a popular online trading platform that also provides analytics on its users trading behaviour. For example, Hertz recently filed for bankruptcy and has traded to a closing low of $0.56 on the 26th of May. The shares subsequently rallied from $0.56 to above $6.00 (+971%) on the 8th of June. Over the same period, we observed a significant increase in the number of Robinhood.net users holding Hertz. The company found itself in an unprecedented situation of doing an equity raising at the same time as filing for Chapter 11 bankruptcy.
Finding opportunities in a volatile environment
We are seeing extreme price moves in 2020, both at the index and individual stock level. We are observing some curious price action that is a reminder of the emotional elements of trading and an inefficient market. Since the start of the year the S&P/ASX 300 Index is now trading at a price earning multiple of 20.2 times next year’s earnings which is 12% more expensive than it was in January 2020 when it traded on 18 times next year’s earnings.
The sectors that have increased the most in valuations include Energy, Industrials, Information Technology and Consumer Discretionary. These sectors are most at risk should growth expectations slow. Looking within each sector we see a wide range of valuations for different companies and look to avoid the more expensive parts of the S&P/ASX 300 Index. We continue to hold no exposure to the Information Technology space, only a small exposure in select Industrials and a small exposure in energy.
Figure 3 - Volatility in returns, valuations and earnings creates opportunities
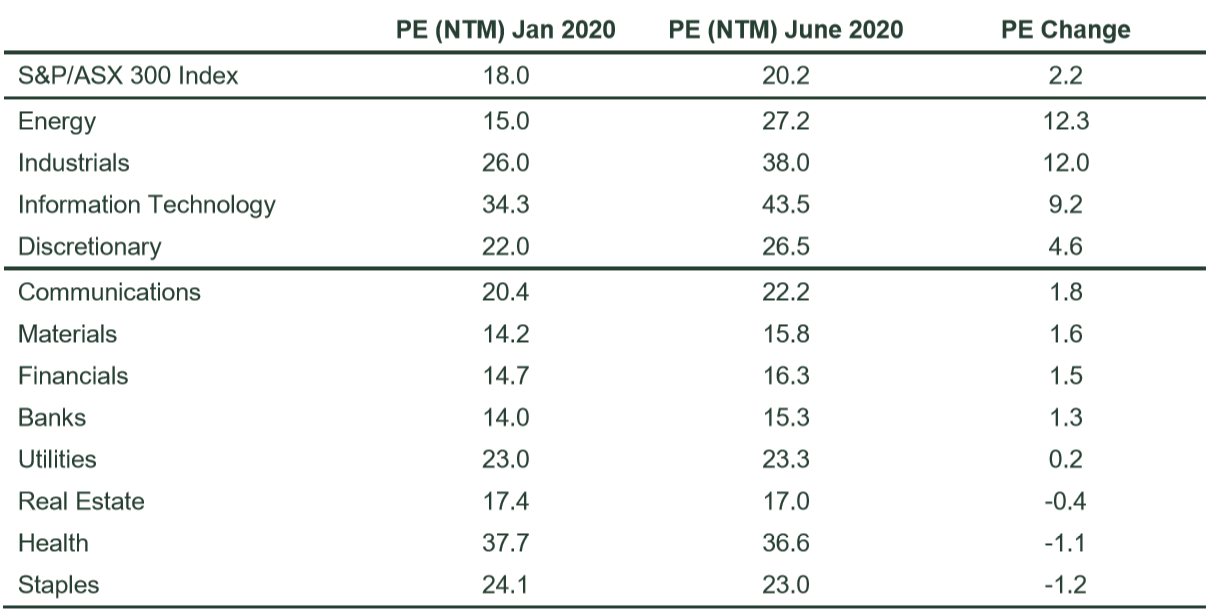
Source: Thomson Reuters, State Street Global Advisors. Valuations are as at 15 June 2020. Past performance is not a reliable indicator of future performance. This information should not be a recommendation to buy or sell any security or sector shown. It is not known whether the sectors shown will be profitable in the future. PE (NTM) = The price earnings ratio based on earnings for the next 12 months.
The Bottom Line
Should we be concerned about the recent rally? We believe the significant rally in the equity market has factored in considerable good news and places many stocks at a greater risk should the V-shaped recovery not occur as expected. We are wary of over-exuberance and herd behaviour driving short term prices. Now more than ever it is time to focus on real businesses that are reasonably priced and can generate earnings and surplus free cash to provide optionality for uncertainty that may lie ahead.
Learn more
Stay up to date with our latest thoughts by clicking follow below and you'll be notified every time we post content on Livewire.
Never miss an update
Enjoy this wire? Hit the ‘like’ button to let us know.
Stay up to date with my current content by
following me below and you’ll be notified every time I post a wire
Bruce is Head of Active Quantitative Equity - Australia, for State Street Global Advisors. He has over 20 years' experience, covering Australian and global equites, long and short equities as well as global macro strategies.
........
Issued by State Street Global Advisors, Australia Services Limited (AFSL Number 274900, ABN 16 108 671 441) (“SSGA, ASL”). Registered office: Level 14, 420 George Street, Sydney, NSW 2000, Australia · Telephone: +612 9240-7600 · Web: www.ssga.com. State Street Global Advisors, Australia, Limited (AFSL Number 238276, ABN 42 003 914 225) (“SSGA Australia”) is the Investment Manager. Investors should read and consider the relevant Product Disclosure Statement (PDS) for a Fund carefully before making an investment decision. A copy of SSGA’s Managed Fund PDSs are available at www.ssga.com.au This general information has been prepared without taking into account your individual objectives, financial situation or needs and you should consider whether it is appropriate for you. You should seek professional advice and consider the product disclosure document, available at ssga.com, before deciding whether to acquire or continue to hold units in the Funds. The views expressed in this material are the views of the SSGA Australian Active Quantitative Equity Team through the period ended 8 April 2020 and are subject to change based on market and other conditions. The information provided does not constitute investment advice and it should not be relied on as such. All material has been obtained from sources believed to be reliable, but its accuracy is not guaranteed. This document contains certain statements that may be deemed forward-looking statements. Please note that any such statements are not guarantees of any future performance and actual results or developments may differ materially from those projected. Volatility management techniques may result in periods of loss and underperformance, may limit the Fund's ability to participate in rising markets and may increase transaction costs. Actively managed funds do not seek to replicate the performance of a specified index The fund is actively managed and may underperform its benchmarks. An investment in the Fund is not appropriate for all investors and is not intended to be a complete investment program. Investing in the Fund involves risks, including the risk that investors may receive little or no return on the investment or that investors may lose part or even all of the investment. Standard & Poor’s and S&P are registered trademarks of Standard & Poor’s Financial Services LLC (“S&P”) and Dow Jones is a registered trademark of Dow Jones Trademark Holdings LLC (“Dow Jones”) and have been licensed for use by S&P Dow Jones Indices LLC and sublicensed by SSGA. The S&P/ASX 300 Index is a product of S&P Dow Jones Indices LLC, and has been licensed by SSGA. SSGA’s Funds are not sponsored, endorsed, sold or promoted by S&P Dow Jones Indices LLC, Dow Jones, S&P, their respective affiliates, and none of S&P Dow Jones Indices LLC, Dow Jones, S&P, nor their respective affiliates make any representation regarding the advisability of investing in such product(s). Investing involves risk including the risk of loss of principal. Risk associated with equity investing includes stock values which may fluctuate in response to the activities of individual companies and general market and economic conditions. This material should not be considered a solicitation to apply for interests in the Funds and investors should obtain independent financial and other professional advice before making investment decisions. There is no representation or warranty as to the currency or accuracy of, nor liability for, decisions based on such information. The whole or any part of this work may not be reproduced, copied or transmitted or any of its contents disclosed to third parties without SSGA Australia’s express written consent.


Head of Portfolio Management – Australia, Active Quantitative Equity
State Street Global Advisors
Bruce is Head of Active Quantitative Equity - Australia, for State Street Global Advisors. He has over 20 years' experience, covering Australian and global equites, long and short equities as well as global macro strategies.
Comments
Comments
Sign In or Join Free to comment