Will the Australian economy have a hard, soft or no landing?
This reporting season we are seeing revisions, guidance and price reaction being highly correlated to consumer and business confidence expectations, and far less correlated to the usual factors and information available during reporting season.
Given the linkages between consumer sentiment and economic sensitivities like rates and inflation, we have used our fundamental analysis of company, and engagement with management teams to better understand the future pathway for Australia’s GDP growth.
We went into the season looking to understand which economic scenario is most likely for 2024. Are we:
- Facing a hard landing with prospects of weaker real growth, inflation at/below RBA targets, and significant rate cuts?
- Looking at no landing, with real growth stronger for longer, rebounding inflation, and stubbornly high short-term rates?
- Or, as it has felt more like since Christmas, a ‘Goldilocks’ soft-landing situation, with resilient real growth, future inflation at target, and modest cash rate cuts from middle of year?

Past performance is not a guide to future returns. Source: Martin Currie Australia, Australian Bureau of Statistics, Australian National Accounts: National Income, Expenditure and Product Table 1. Key National Accounts Aggregates; Gross domestic product: Chain volume measures; Seasonally Adjusted. Latest available as of 6 March 2024. Dotted lines shown for illustrative purposes only and not actual forecasts.
Leading in, the market consensus looked to be betting on the soft-landing scenario, but after getting through the season, and holding 100+ meetings, the investment team at Martin Currie Australia are not so sure.
We feel that the relief that things were ‘not as bad as feared’ in the results has masked the deteriorating state of consumer health and the poor growth outlook, and now the cards in favour of a hard landing are starting to mount up.
What does this mean for investors? We believe that now is the time for investors to evaluate the balance in their portfolios. This environment can be navigated, however, it is as important for investors to be discerning in their stock picking, focussing on the companies which have pricing power, resilient volumes, and capacity to manage margins, while avoiding stocks with valuation risk.
Analytical review of results
Beats win, just.
This reporting season we had more beats than misses overall. It was a positive season in that regard, but we have seen that the skew of beats versus misses has been slowing since the strong results in the post-Covid years. The mostly in-line surprise at the sales line reflects that expectations for sales have already been baked into consensus numbers.

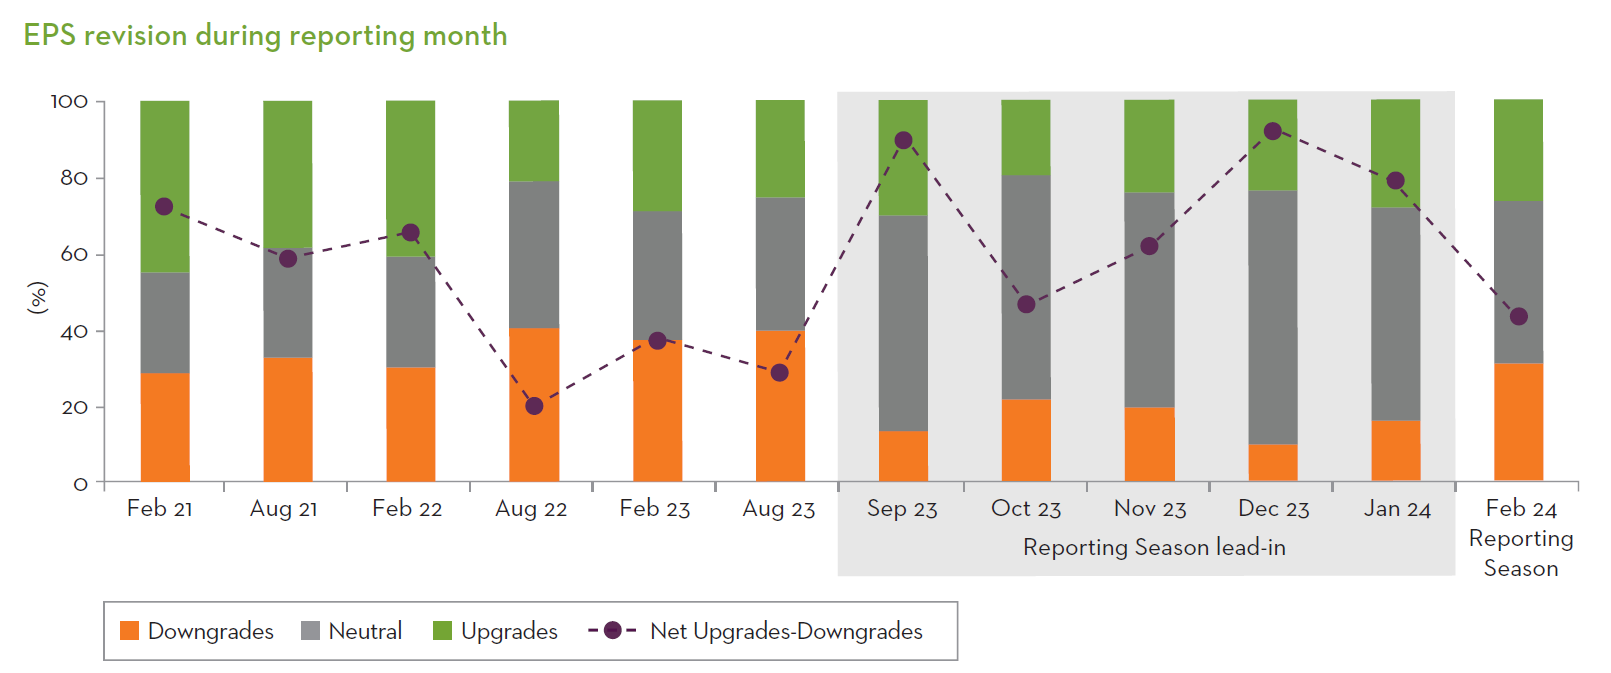
Despite the beats, guidance and revisions skew to the downside.
Not all companies provide guidance with their results, but if we also look at the narratives from company management, we saw more downgrades than upgrades at the Earnings Per Share (EPS) guidance level.
This was also the case with revisions to broker forecasts, which were skewed to the downside. Resources drove much of the negative EPS revisions due to changes in commodity price outlooks, while other super sectors saw a mild upgrade to sales across the board.

Less negative skew than recent results.
While negative overall for earnings revisions, it was a mild reporting season in terms of the skew, it did not feel that bad in the context of the tough last three periods. We had quite a strong lead in (shown in grey in the chart below) since August 2023 as the economic backdrop was more resilient than initially expected. February 2024 was nowhere near as bad as August 2022, which was well below the Covid recovery years and the longer-term averages.
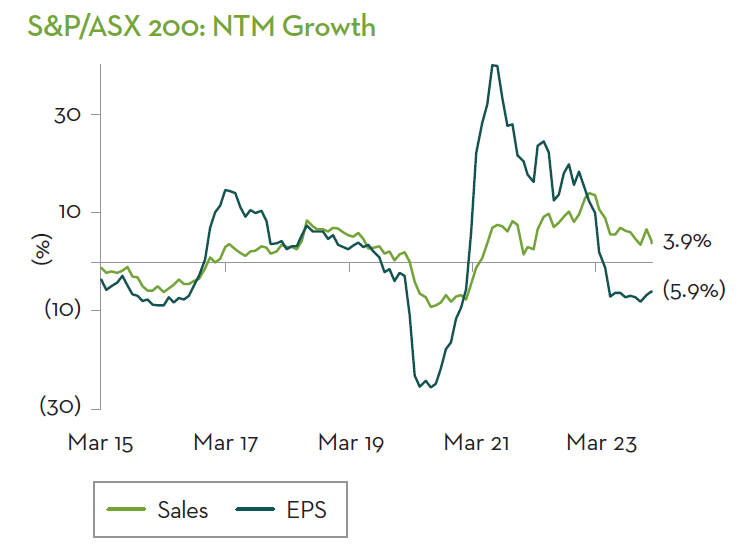
Aggregate forecasts suggest stabilisation.
Aggregating up the broker consensus forecasts post revision, expected sales per share growth is stable versus the last six months. EPS growth has already been running in the negatives for the last 6-12 months but is also now in a more stabilised state.
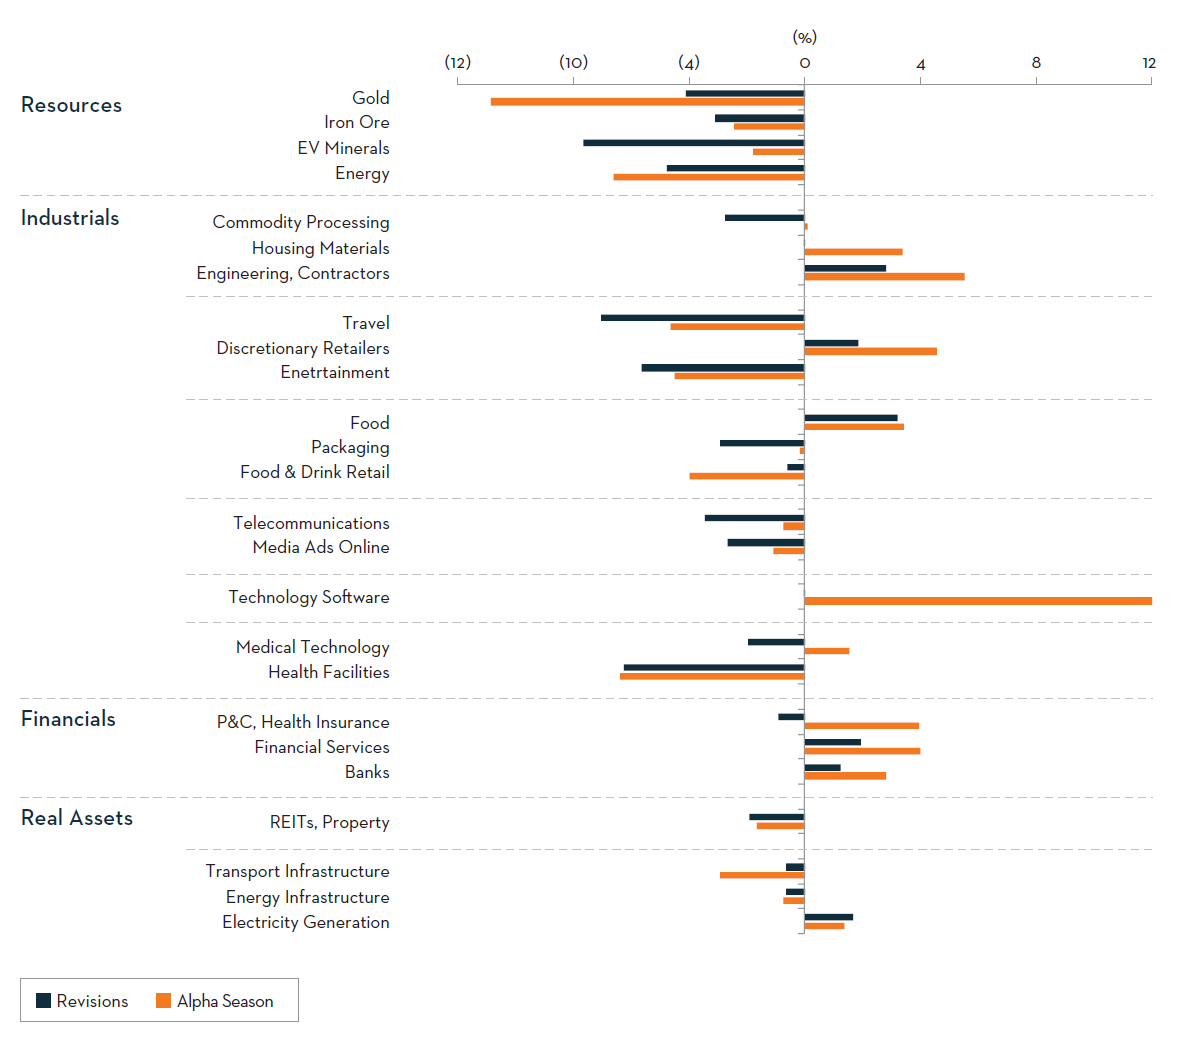
Results scorecard by industry.
The industry scorecard below summarises revisions and stock price reaction by the key twenty-four sub-industries that we believe are important to the Australian market.
- Revisions in this chart show the average of per share revision for Sales, EBITDA, Free cash flow, Debt, weighted with Earnings, Dividend revisions.
- Alpha Season shows the average relative performance (vs S&P/ASX 200 Accumulation index) over the full reporting season period.
On these measures, we could see dispersion between the industries. Resources were all bad, industrials and real assets were mixed, while financials were mostly rewarded. We discuss the main themes driving these results – the consumer health, rising costs of doing business and falling commodity prices – in further detail in the following section.
Sources and disclaimers for this section. Past performance is not a guide to future returns. The information provided should not be considered a recommendation to purchase or sell any particular security. It should not be assumed that any of the security transactions discussed here were, or will prove to be, profitable. Source for all charts (unless otherwise noted): Martin Currie Australia, FactSet; as of 29 February 2024. Chart data is for the S&P/ASX 200 Index unless noted otherwise. See further definitions on page 2.
Disaggregating the key issues and themes
Consumer health resilient but concerns are forming.
Given the state of inflation and rate rises, the big theme that we were seeing from the results, company guidance and engagement this reporting season was discussions about the health of the consumer.
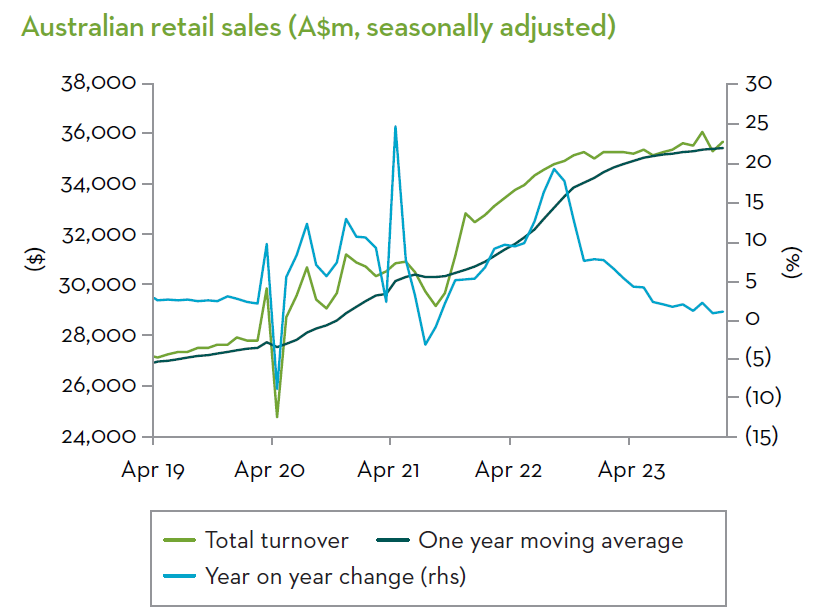
While the revisions from brokers do suggest mild upgrades to sales forecasts, the ailing consumer is showing through in the aggregate retail sales data from the ABS. Year on year growth has now sat at around 1% p.a. since mid-last year, and below pre-Covid averages. However, with 4-5% inflation, this is now actually a negative real number.
Divergent spending intentions.
To us, the important thematic to understand on the consumer, despite the ABS retail sales data above, is that company management are still talking about it being not as bad as they had feared, and that lower inflation, tax cuts for middle-income earners and rate cuts should help.
Despite cost-of-living pressures, one place that we continue to see a strong consumer (but not necessarily positive revisions or price performance) is in the travel sector. The rate of Australian’s travelling overseas has rebounded swiftly, but it is still around 40% below that of the pre-Covid trend. Qantas (ASX: QAN) has surveyed their Frequent Flyers in terms of intention to spend and travel is still remarkably high on the list. Consumers are moving away from spending on homeware, renovations, and going out.
Travel does seem to be a non-discretionary item for Australians. This theme is also important for a stock like Flight Centre Travel Group (ASX: FLT). What is interesting here is that they are running at around 40% less staff than pre-Covid but achieving the pre-Covid levels of turnover. The market did not reward these results.
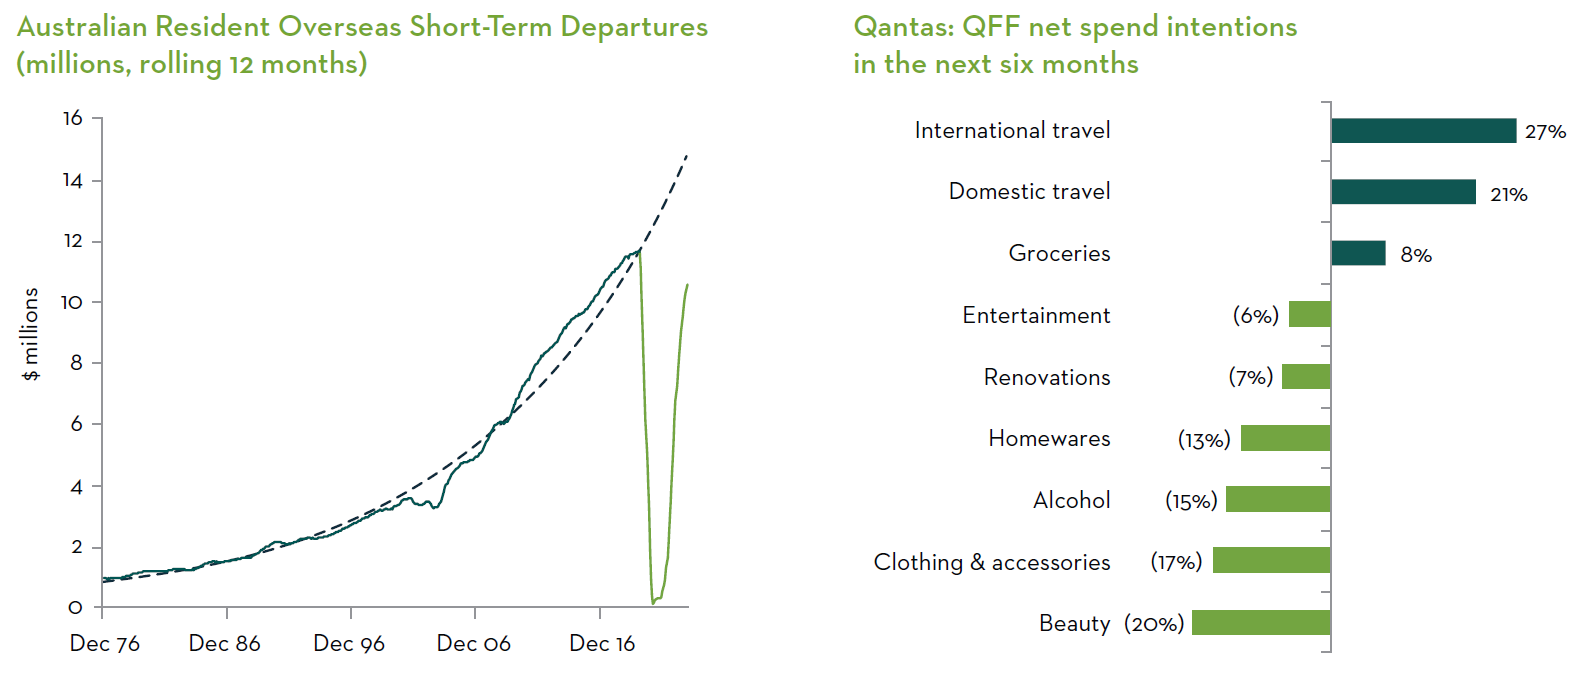
Past performance is not a guide to future returns. The information provided should not be considered a recommendation to purchase or sell any particular security. It should not be assumed that any of the security transactions discussed here were, or will prove to be, profitable. Source: Martin Currie Australia, FactSet, Australian Bureau of Statistics, Retail Trade, Australia, January 2024; Overseas Arrivals and Departures, Australia December 2023; Qantas company First Half Result presentations; latest available as of 29 February 2024.
Savings buffer vs. dis-saving between generations.
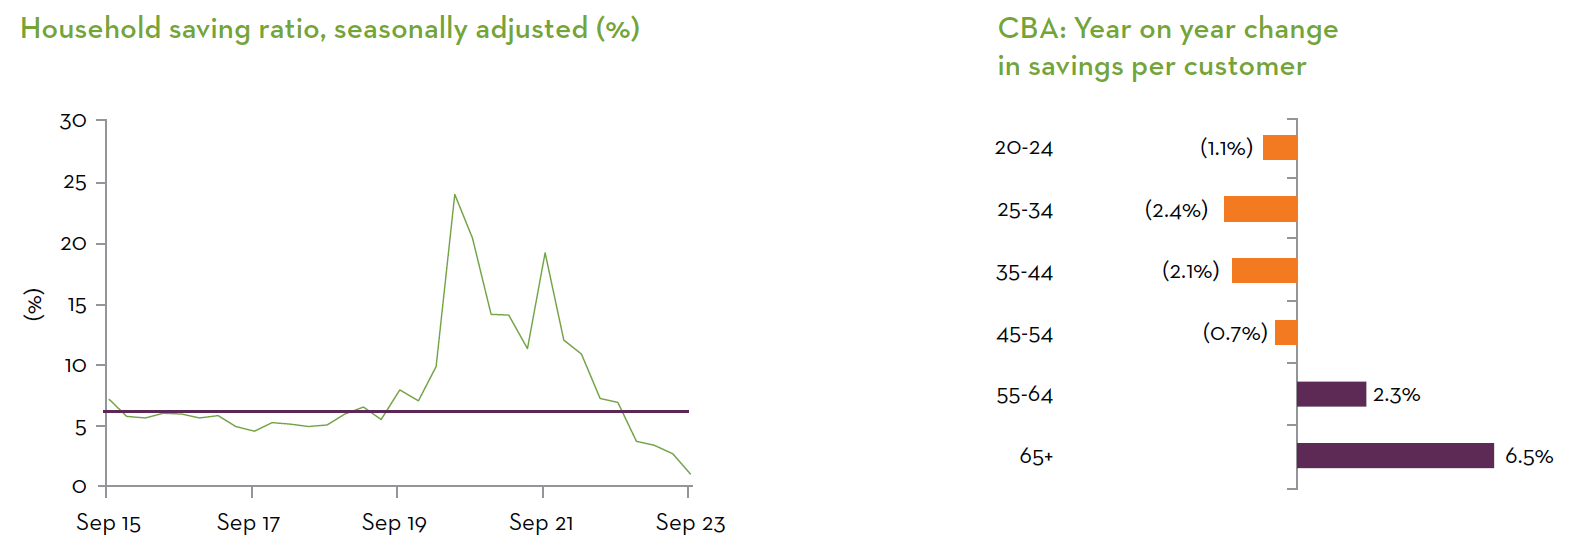
However, the biggest clue for us on the direction of consumer health is the savings rate.
Australian consumers had excess savings through Covid, and they had built up quite a big buffer which supported the ‘stronger for longer’ / no landing argument. However, the savings rate is now almost negative as people are eating into their buffers due to higher rates and prices. With the buffers almost gone, the real stress is now likely to show.
We would note that there is a big generational divide between the savings rates of younger people and older people. Commonwealth Bank of Australia (ASX: CBA) data shows that younger people with mortgages are the ones that are really suffering and cutting back, whereas older people who have paid off their mortgage are doing better.
Banks more resilient that expected.
The consumer health theme is also driving positive earnings revisions for banks, with results showing lower loan loss charges than expected.
The consensus is that loan loss charges will increase as the economy slows, but the banks are just not seeing that pressure flow through to their books. This is not to say that customers are not defaulting, but bank credit risk has been moved off balance sheets into unlisted or subprime type lenders. This means their books are looking very solid and brokers have been upgrading on that basis.
Mortgage competition had been the main topic for the banks in recent times, but if anything, that pressure is relaxing. The key new theme for the banks is now increasing deposit competition for a smaller savings pie, and increasing funding costs.
Business demand bad for stock prices, while consumer demand is good.
Interestingly, we did see a more negative reaction for companies that reported exposure to business demand than to consumer demand.
There have been strong results and price reactions for consumer exposed stocks and evidence of consumers not stopping spending but trading down to the lowest price product. This has been good for volumes at companies like Wesfarmers (ASX: WES) where Kmart and Target appeal with everyday low prices. Sales for companies like JB Hi-Fi (ASX: JBH), while slowing on a like for like basis, have also been more resilient than expected.
However, on the business demand side, we saw particularly poor signals from the telcos, where small business customers have been cutting back on spending. We heard about falling building construction demand with fewer renovations. We heard that companies plan to spend less money on advertising. There are less job advertisements listed, and stories from management around destocking of supply chains.
A tightrope: volume, selling price, costs.
To understand the impact on stocks, it is important to look at the key parts of a business’ profit margin: Volume x selling price – costs. Inflation is impacting all of these at different rates.
- We expect volumes to fall as consumer savings continue to decline.
- On the other hand, the cost of doing business (CODB) is being impacted by non-tradables inflation – rent, wages, payroll, superannuation, insurance – which is persistently high and not slowing.
- Tradable or goods inflation, is coming down with falling prices on lower supply chain pressure and falling demand.
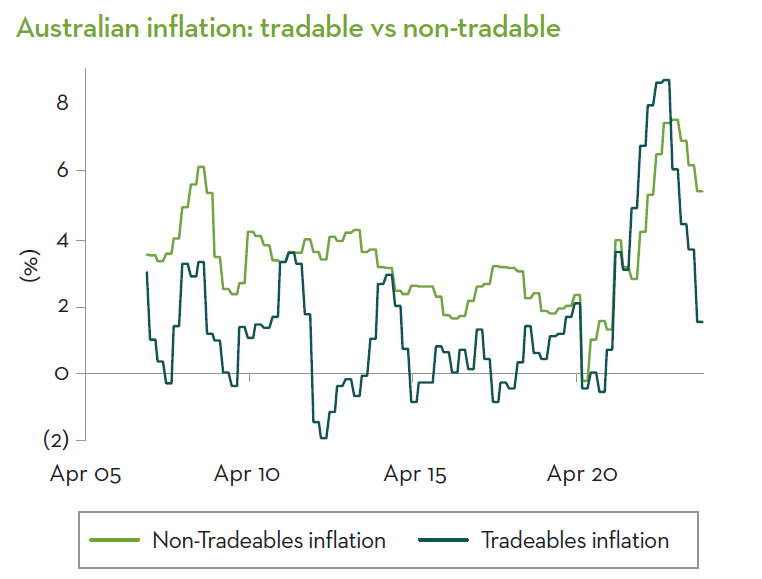
For retail stocks, this is quite a poor mix – negative volumes, less selling price inflation, high CODB.
We would note that in an accelerating sales growth environment, you would normally see expanding profit margins, and expect the opposite in a decelerating one. Profit margins have already come down significantly in prior reporting seasons, and while there is divergence across the super sectors, each is facing the ongoing margin pressure.
This reporting season, many companies that we spoke to talked about managing their gross margin and that they still have some levers to pull. This is why there still seems to be a level of confidence, despite the poor mix.
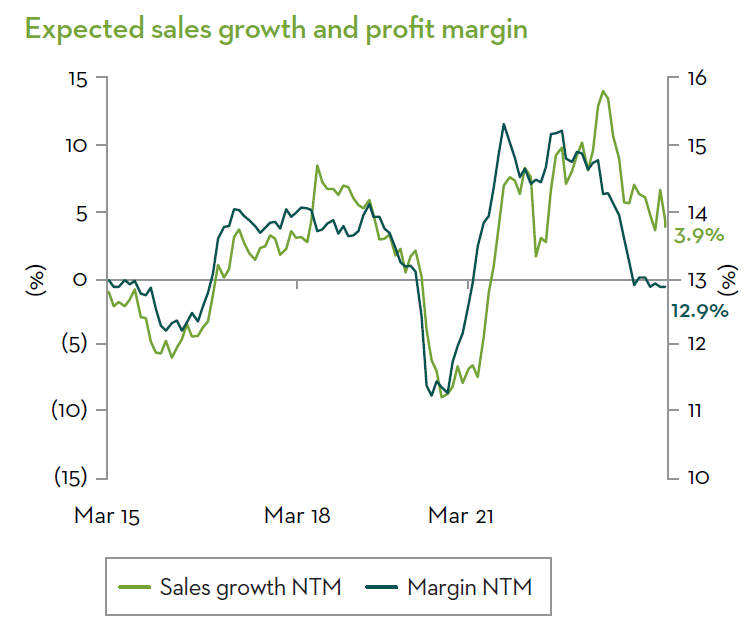
Levers include changing the mix of their products and improving their promotional activity to try and squeeze out a higher gross profit margin. They are also starting to talk about improving productivity. This does not appear to be job shedding at this point, but it could turn into that later which will impact the unemployment rate. It is certainly one of the next steps as growth continues to slow but will also impact consumer spending.
Cash flows do not lie.
While companies can manage their profit margins to feel better, it is hard to hide the truth in cash flows. The reality is that it is getting harder.
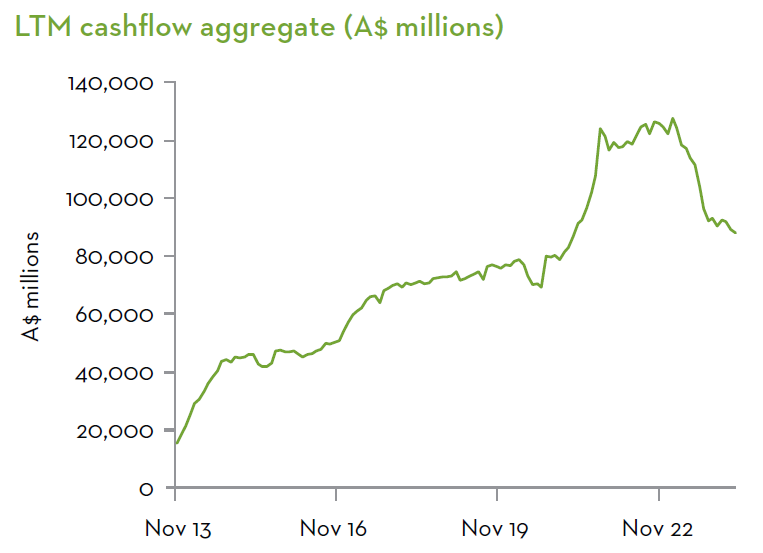
Aggregate cash flow trends for S&P/ASX 200 stocks look remarkably like the Australian consumer savings chart. There was a boom in cash during Covid, with significant fiscal support, less working capital pressures, higher pricing, and excess cash flow. Cash flow has now come down, just like consumer savings rates.
We really think that this falling savings rate dynamic has not yet fully played out and we will see more risks to consumer strength and appetite over the next 12 months.
The need to be selective for income and growth.
Our Income Scorecard looks at the income outcomes and forecasts for the S&P/ASX 200 super sectors. The scorecard considers the winners and losers from a pure income perspective, rather than stock performance, as this reflects how we think about portfolio construction for our retirement income-focused portfolios.
We track how companies in our income universe* have delivered on the market’s forecast dividend expectations over the last 12 months. We have also looked at how well they have been able to protect their dividends against inflation through dividend growth over the period, stripping out the impact of any share price change on the yield.
For some time now, dividends from Australian stocks have been under pressure from falling cashflows. The earnings environment and capex requirements in resources (in particular) has led to a substantial reduction in payout ratios across the board. In the current environment we believe that investors need to be very selective in the types of stocks that they rely on for producing income.
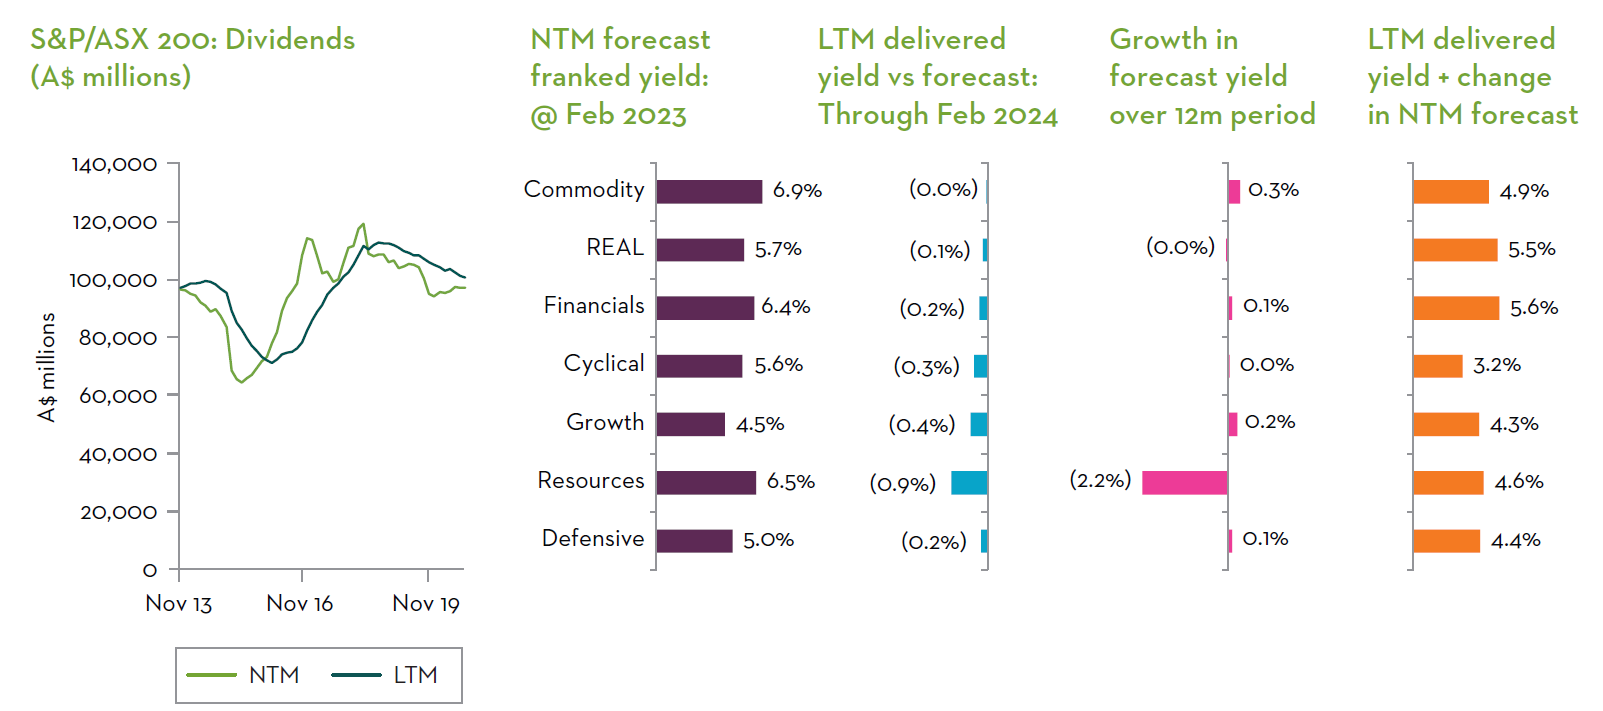
1Source: Martin Currie Australia, Macquarie Research; as of 30 June 2023. *Yield data is for our income universe: based on stocks with at least a 3% franked yield, and pass our proprietary assessment of sufficient quality and liquidity for an income investor.
Non consumer health themes.
Paying up for local scarcity.
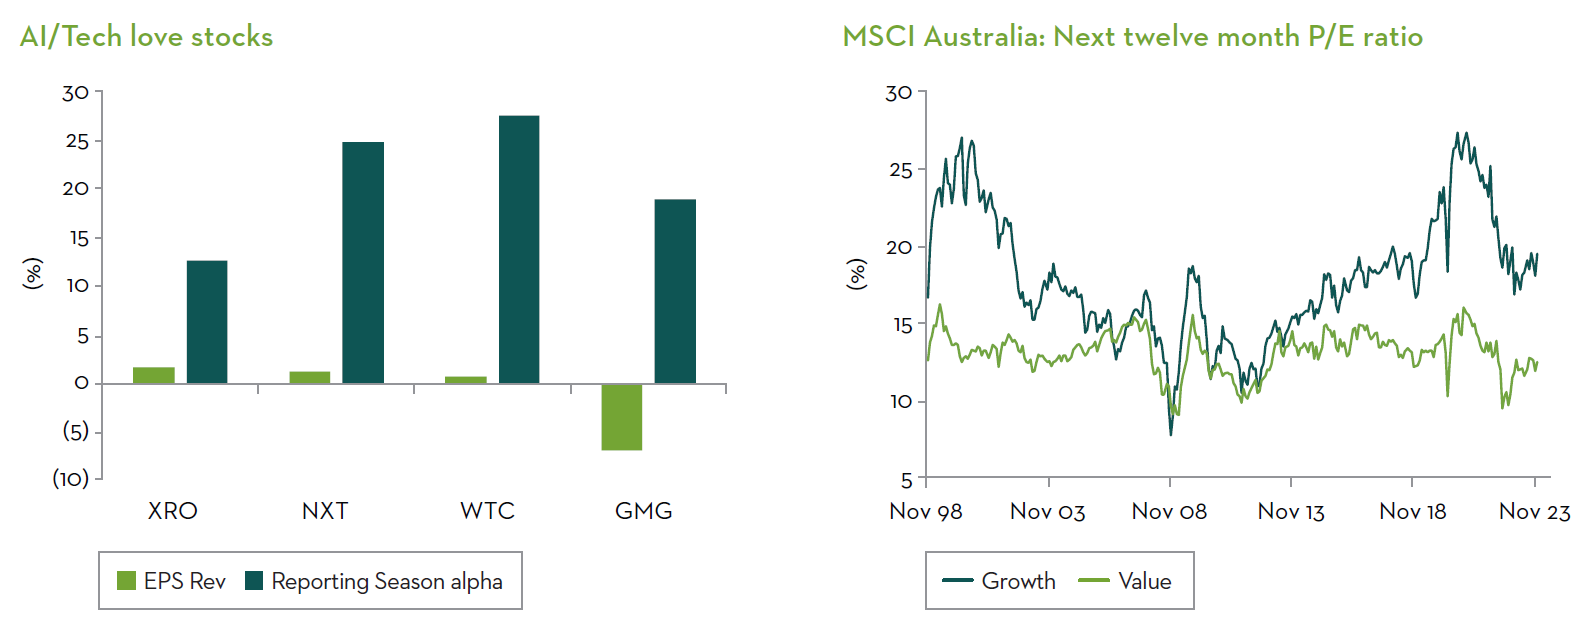
The other ongoing theme this reporting season was technology sector stock price re-rating. Despite only modest earnings revisions, tech stock prices continue to rise.
Artificial Intelligence (AI) is obviously a big topic globally, and Australia’s ‘fabulous four’ are riding on the coattails.
Next DC (ASX: NXT) and Goodman Group (ASX: GMG) have genuine exposure to the AI theme with their data centre businesses. Xero (ASX: XRO) and WiseTech Global (ASX: WTC) are also doing quite well in terms of integrating AI into their businesses, creating bots that can automate processes.
Outside of so-called tech companies, AI is a driver that can improve operations. For example, usage scenarios include network optimisations for telecom companies, improved efficiencies in travel companies and healthcare. Sonic Healthcare (ASX: SHL) talked about using AI for reducing human interaction for radiology and pathology. Brambles (ASX: BXB) talked about using AI in terms of tracking their pallets and knowing where things are.
Outside of the tech area, another stock that we could add to make a ‘famous five’ would be Commonwealth Bank of Australia. The bank is trading well above its long-term average and given its large retail shareholder base and large index position, seems to be benefiting from the index effect rather than genuine evidence of delivering sustainably differentiated operating metrics versus its peers. We are also seeing a big index effect from Goodman Group lifting the S&P/ASX 200 A-REIT index.
As a manager that offers Value-style and Income-style strategies, the scarcity for technology names in Australia has really driven valuation spreads wider than we think is warranted based on the fundamentals. To us, poor valuations, and the concentration of the index in poor/no income paying stocks, is a real risk that clients need to be aware of.
Commodities acting like recession.
Turning now to the resources space, where we saw a significant negative skew in revisions and prices. Much of this can be attributed to the notable changes to commodity price forecasts for coal, iron ore and Electric Vehicle (EV) materials during the period.
The slowing demand for EVs, pivot to hybrids in Europe, and excess build out of battery and solar capacity in China, has put pressure on the lithium price. Iron ore / steel is also under pressure from China demand and infrastructure spend question marks.
Labour shortage over, but cost pressures remain.
On the CODB side, compared to prior periods, we are no longer talking about labour shortages causing significant disruption to business. Instead, we are hearing stories from management about the persistently excessive cost of labour. Enterprise bargaining agreement negotiations of 5%+ are creating headwinds for some companies. The miners and contractors are also talking about the cost pressures from East coast government projects crowding out the private sector and making it harder to financially attract FIFO workers to the West coast. The health care sector is particularly exposed to high labour costs.
Net zero demand continues.
On the topic of infrastructure, the winners here are those companies exposed to net zero transition spend. Companies like Downer EDI (ASX: DOW), Ventia Services Group (ASX: VNT), Orica (ASX: ORI), and Worley (ASX: WOR) are seeing ongoing strong demand which is unrelated to these broader economic themes.
M&A buzz.
We are seeing more M&A activity than normal. Inflation has made it cheaper to buy than to build via capex. Replacement cost economics for things like new buildings, better shopping centres or offices, are just so expensive at today's price. The Australian dollar is quite low, so Australian companies are looking quite attractive to offshore buyers.
Examples of the recent M&A activity includes Alcoa bidding for Alumina (at a price that is well below replacement value), French company St Gobain bidding for CSR (ASX: CSR), and Seven Group (ASX: SVW) taking out the minorities in Boral (ASX: BLD). There is also a bid for Altium (ASX: ALU) from Japan’s Renesas Electronics, and Reliance Worldwide’s (ASX: RWC) acquisition of Holman Industries in a bid to expand their market.
The big picture for equities and our portfolios
Where to next?
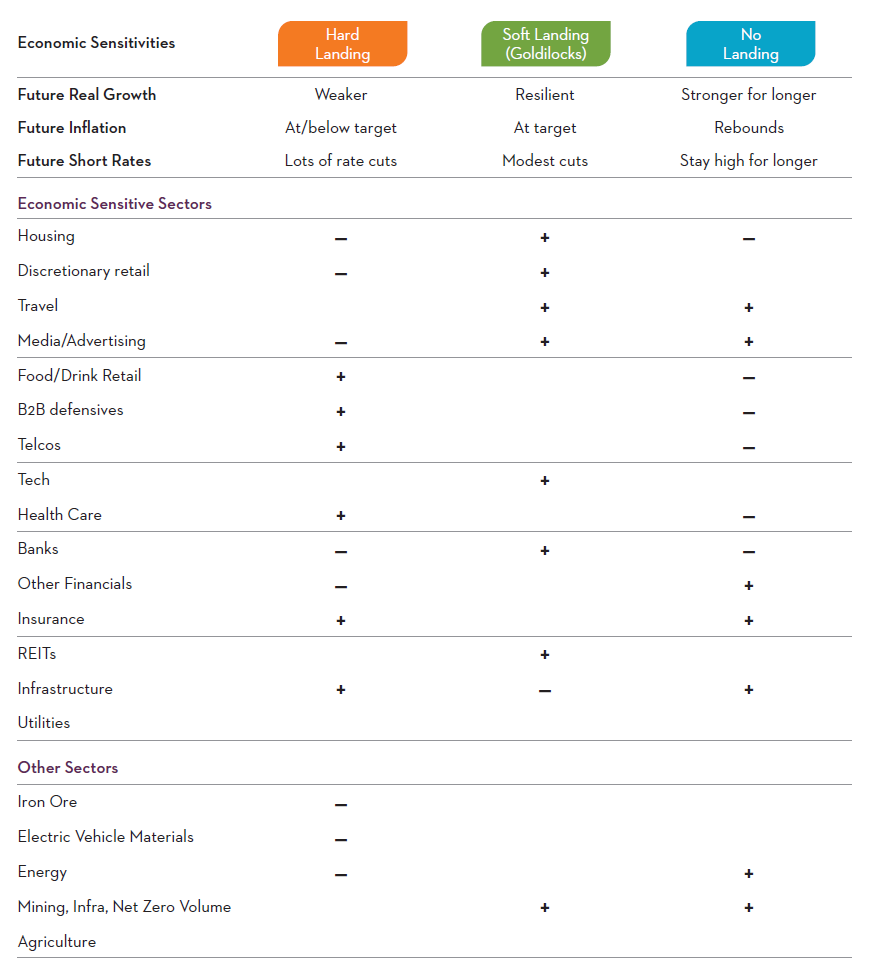
After digesting the latest information from reporting season results and company meetings, we have looked again at the likelihood of the three possible economic paths– hard landing, soft landing, or no landing.
The consensus view is still that of a ‘Goldilocks’ soft landing. However, our analysis of the data and management commentary is that there is more pain ahead, and the path is edging closer to a hard landing. The deteriorating state of the consumer, flatlining retail sales and falling company cashflows are the biggest risks to the downside.
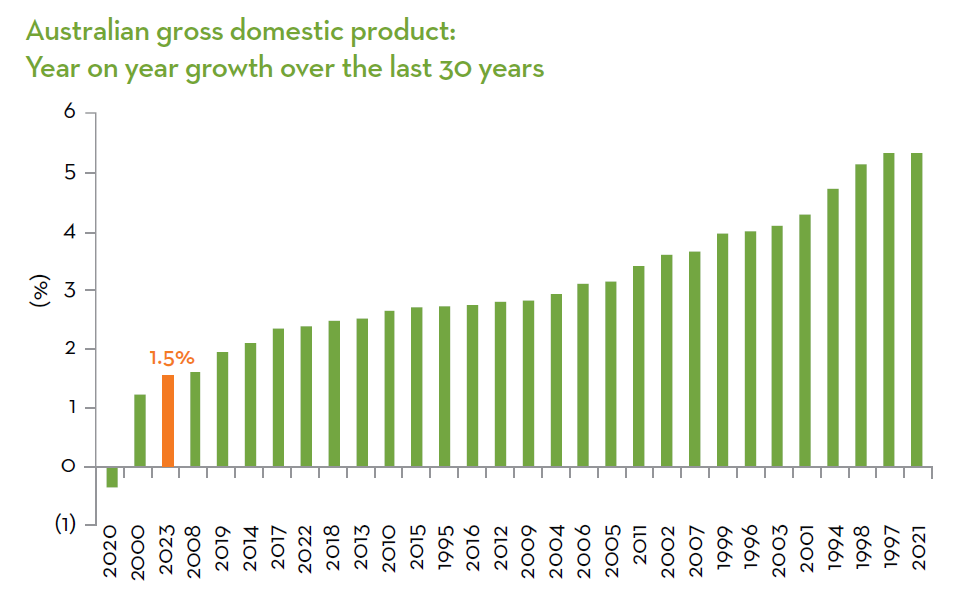
We must not discount that Australia’s real GDP for 2023 came in at just 1.5% p.a. growth, which was the third worst annual reading in 30 years, worse even than during the GFC, but ahead of the 2020's Covid and 2000 post-tech bubble.
Probable winners and losers.
The table below highlights the key Australian industry grouping that we believe are the winners (+) and losers (-) in each scenario.
Positioning for the path.
Portfolios across our range of Australian active equity strategies are based on MCA’s valuation and risk discipline. We continually adjust our portfolios based on the information we are getting from sources, which include reporting season results, company meetings and engagements. These are all a valuable opportunity to gain deeper insight and hone our investment thesis for each company.
For some time, we had positioned our portfolios for the hard landing scenario. We have lowered the beta of our portfolios and are focused on companies that can grow earnings and dividends and have lower valuation risk. Medibank Private (ASX: MPL) is a good example of this, with earnings stability and resilience from a superior industry position, light capital intensity and high cash flow resulting in consistently strong profit margins.
We think that defensive inflation protection or stagflation protection is going to be quite important in a hard or soft-landing scenario. Stocks like Telstra Group (ASX: TLS), an essential service, and Aurizon Holdings (ASX: AZJ) excel in that protection with very resilient volumes and good pricing power, and in the case of Aurizon, inflation-linked returns.
Under a no-landing, stronger for longer growth theme with higher rates, exposures to insurance stocks such as QBE Insurance Group (ASX: QBE) and Suncorp Group (ASX: SUN) do offer positive leverage.
In all scenarios, we also want to own names such as Worley (ASX: WOR), which we think has a compelling exposure to the energy transition, with 80% of their new business now in sustainability-type work in resources.
Summary
The environment plays towards Australian stocks with defensive earnings, robust cash flows, strong balance sheets and cost control amid the ongoing contraction in household budgets.
We believe that now is the time for investors to evaluate the balance in their portfolios. This environment can be navigated, however, it is as important as ever for investors to be discerning in their stock picking, focussing on the companies which have pricing power, resilient volumes, and capacity to manage margins, while avoiding stocks with valuation risk.
We believe that Growth-style stocks remain expensive, while Value stocks are still cheap relative to history. As the large spread between Value and Growth unwinds, and the market refocusses on valuations based on true earnings fundamentals, the conditions for MCA’s style strategies to outperform their total return and/or income objectives remain convincing.


25 stocks mentioned
3 funds mentioned

