A sliver of US stocks offer an excellent opportunity
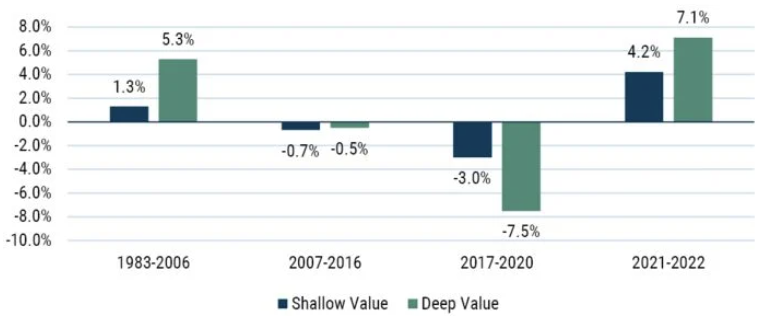
Across most of history, if you were going to own value stocks, you would have really wanted to own the very cheapest of them. Exhibit 8 shows the performance of the cheapest 20% of the top 1000 U.S. stocks (“deep value”) against the next 30% (“shallow value”) for various time periods in the last 40 years. In the good old days for value – here the period 1983-2006 – the cheapest 20% of the market outperformed the rest of the value universe by 4% per year. In the decade after those good times ended, value underperformed modestly with both deep and shallow value underperforming the market by less than 1%. But in the value nightmare of 2017-2020, it was deep value that was the true disaster, underperforming the market by 7.5% per year, much more than twice as bad as the underperformance of shallow value.
Exhibit 8: Performance of deep and shallow value

Data from January 1983 to September 2022 | Source: GMO. Deep value and shallow value are best 20% and next 30% of top 1000 U.S. stocks on GMO’s price/scale model. Performance is relative to top 1000 U.S. stocks.
By 2020, it had been well over a decade since owning deep value was of any help, and over the prior four years, it had been an utter disaster. While a decade of disappointing performance followed by a few years of disastrous performance is enough to make most clients fire you, the extremely patient ones who do not at least tend to ask some pointed questions about what you have learned and how your process has changed given that performance. Whether you are a quantitative manager trying to discover a backtest that would have avoided the worst of the recent pain or a fundamental value manager trying to learn from recent mistakes the old-fashioned way, the obvious response would be to figure out some method to avoid deep value.
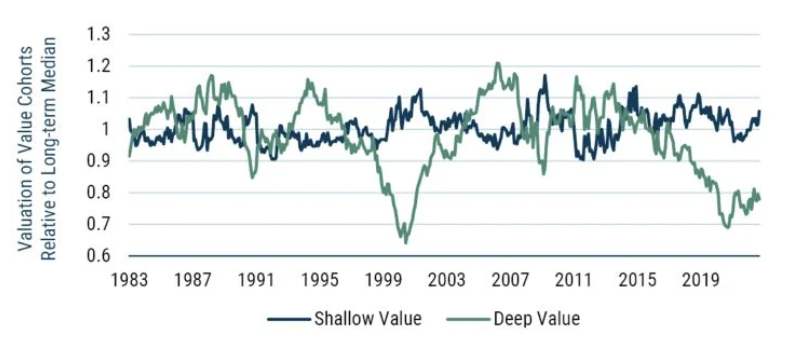
But I suspect that is the wrong response. While it may seem obvious that deep-value stocks must have finally turned into the value traps that investors fear, a little deeper digging shows that wasn’t actually the case. Exhibit 9 shows the valuation of deep value and shallow value normalized by their median discount over the 1983-2022 period.
Exhibit 9: Valuation of deep and shallow value

Data from January 1983 to September 2022 | Source: GMO. Deep value is cheapest 20% on GMO’s price/scale, shallow value is next 30%, both within top 1000 U.S. stocks by market capitalization. Valuation is normalized for whole period median relative valuation of each group.
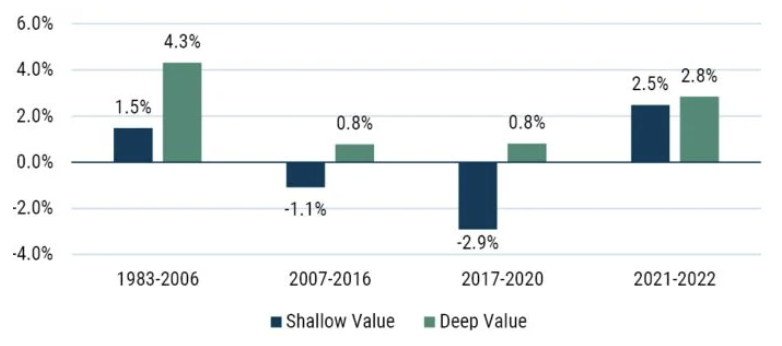
Neither group was cheap versus history in the 2007-2016 period. Deep value was actually at its highest relative valuation in history at the end of 2006, whereas shallow value was just about at its median valuation. Over the next decade, deep value saw its valuation fall by 1.3%/year on average while shallow value saw its valuation rise by 0.4%/year. So, we redid Exhibit 8, looking at valuation-adjusted returns, and got results that look quite different, as can be seen in Exhibit 10.
Exhibit 10: Valuation-adjusted performance of deep and shallow value

Data from January 1983 to September 2022 | Source: GMO. Deep value and shallow value are best 20% and next 30% of top 1000 U.S. stocks on GMO’s price/scale model. Performance is relative to top 1000 U.S. stocks. Performance is adjusted for changes between the starting and ending valuations of the groups relative to top 1000 U.S. stocks.
This chart adjusts the returns of the groups (seen in Exhibit 8) by the change in the starting and ending valuations of those groups. Through this lens, we can see it wasn’t deep value that had a problem from 2007-2020. While performance was slightly worse for shallow value after adjusting for starting and ending valuations, deep value actually managed to hold its own during the long value nightmare. As such, it is shallow value that has more explaining to do, as its valuation-adjusted performance was fairly negative in both legs of the growth era.
It’s possible that shallow value’s troubles were temporary, as both deep and shallow value have done just fine in the last couple of years.
But while the valuation-adjusted performance of deep value has certainly deteriorated from the glory days of 1983-2006 (at +1.1% per year since 2007, down from +4.3%), it returned a positive number in every period. If you combine that pretty decent fundamental performance with valuations today at the cheapest end of their history, you’re looking at a very compelling group of U.S. stocks to own.
For those concerned that the deep value group is a junky and undiversified group of stocks you would be terrified to hold, it isn’t, and this is true for a couple of different reasons. First, the basic pattern of deep value looking a lot cheaper than shallow value is robust to a surprisingly wide variety of different valuation measures, group construction methodologies, and weighting schemes. The version of value I’ve shown here is GMO’s price/scale model. You can think of that as a version of “standard value,” where we have tried to correct for accounting distortions that can take measures such as price/earnings and price/book misleading but where we are not otherwise trying to adjust for quality or future growth prospects. Table 3 shows the percentile rank versus the history of the various ways of defining and weighting deep value in the U.S., where the 100th percentile would be the most expensive level in history and the 0th the cheapest. The three valuation models used span GMO’s techniques from simplest to most complex and forward-looking.
Table 3: Valuation percentiles for the cheapest 20% of the Top 1,000 U.S. stocks on different measures and weightings of value

Data as of 9/30/2002 | Source: GMO. GMO Standard Value is GMO’s price/scale model, Quality Adjusted Value is price/scale adjusted for company quality, and Price/Fair Value is GMO’s dividend discount model.
The point of the table is that on a continuum of models and weighting schemes, we see a pretty uniform level of attractiveness for deep value. While the cheapest 20% of “standard value” portfolios do tend to be lower quality than the overall market, that is much less true for the other versions of value I’m showing; if you don’t want the sector biases that the raw deep value groups give you, you could build your group sector-neutral, thereby excluding them. For my part, while the sector-neutral version of the deepest value stocks is indeed trading at some of the largest-ever discounts to the overall market, allowing sector biases does not meaningfully increase the absolute risk of the group and makes the resulting group cheaper in absolute terms. As a result, I’m happy to allow a deep value portfolio a fair bit of leeway to take the sector biases a less processed value group naturally wants, and that is indeed what we are doing in the deep value portfolio we are running today.
Learn more
Missed Part I of our Deep Dive into Value? You can read that here. If you would like to learn more about GMO and our strategies, please visit our website.
2 topics

