10 charts that show things aren't so bad

Clime Investment Management
Clime Investment Management
The completion of the financial year is as good a time as any to take stock, stand back and assess “the big picture”. With the daily news cycle filled with Trump’s tweets, North Korean ICBMs, refugees pouring out of North Africa and the Middle East into Europe, and terrorist attacks seemingly a weekly occurrence, it is easy to become disconsolate. Noted global strategist George Friedman made the following point recently: “Many believe there have never been more contentious times than those in which we now live. It’s a belief shared by most everyone of every era. I admit that times are strange, and in some ways they are unlike any other. But are they as bad as the late 1960s and early 1970s, the decade of assassinations and riots, of slain war protesters and Richard Nixon? Are they as bad as McCarthyism or the Great Depression or the Civil War?”
While many of us do feel a distinct dislocation in the global polity, the authors of this article think the answer to Friedman’s question is “No, the present time is not as bad as many earlier periods of global uncertainty – periods with which we have coped and overcome”. In this piece we will consider some of the key investment markets overseas and in Australia, and attempt to place the opportunities – and the risks – in an appropriate context. Today’s View is part 1 of a two-part series where the second part will be published this Friday 7 July. Today we cover global matters; the Friday report will focus on Australia.
Global share markets have had a good run over the past 12 months
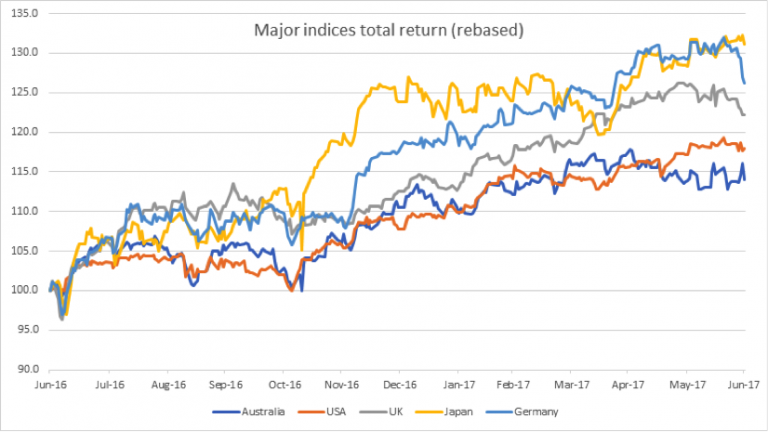
Figure 1. Major indices total return (rebased)
Source: Clime Research
The global economy is recovering from the GFC
The broad-based pick-up in the global economy since the dark days of the GFC is continuing. While above-trend growth is still absent from most advanced economies, there are positive signs emerging. Generally, forecasts for global growth have been revised up from last year. Labour markets have tightened in many countries especially in the US and the Eurozone; consumer and business confidence in both those zones have also increased significantly. In China, growth is being supported by increased spending on infrastructure and property construction, and the consequent rise in commodity prices over the past year has boosted Australia’s national income.
Headline inflation rates, while having moved higher over the past year, do not pose too much of a problem, and have been assisted by lower oil prices. Wage growth remains subdued in most countries, as does core inflation. As we have written about many times over past months, further increases in US interest rates are expected by markets and there is no longer an expectation of additional monetary easing in other major economies: the emergency measures designed to counter the GFC are slowly being unwound. Financial markets have been functioning effectively and volatility has been low.
Reduction in perceived global risk
The Global Economic Policy Uncertainty Index (GEPU) measures 18 of the largest economies and has as the base measure of the Index a score of 100. The chart below shows the Index peaking at 300 last year, and the subsequent reduction in global economic uncertainty to below 200 today. Clearly, the trend shows uncertainty diminishing. This is probably also reflected in the unusually low levels of equity market volatility represented by the VIX index (or “fear index”) covered in previous editions of The View. As the chief economist of the OECD has stated, things are “better, but not good enough”. The OECD expects a modest pick-up in global growth this year and next. The hope is that this will be the beginning of a sustained upswing, in which strengthening investment and faster productivity growth keep inflation in check.
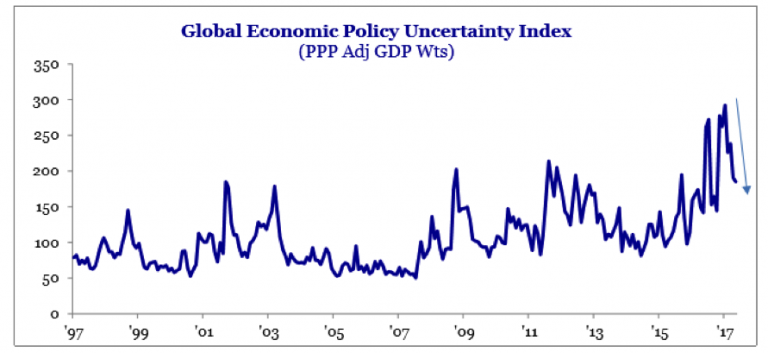
Figure 2. Global Economic Policy Uncertainty Index (PPP Adj GDP Wts)
Source: Strategas, (VIEW LINK)
Global earnings growth
Equity markets usually require a conducive macro-economic environment in which to thrive, but ultimately fundamental value must be supported by company earnings. Earnings growth is clearly evident in the US, as shown below…
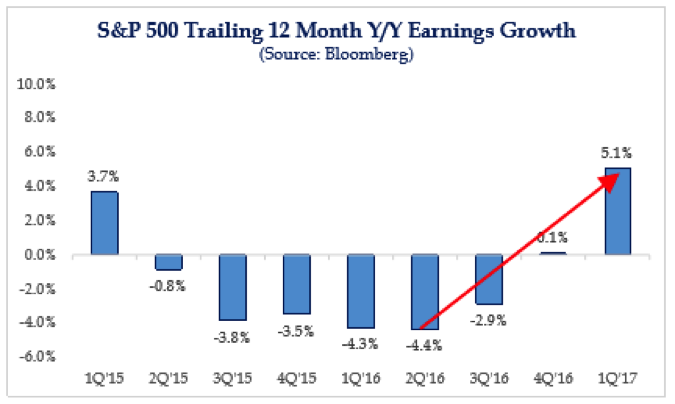
Figure 3. S&P 500 Trailing 12 Month Y/Y Earnings Growth
Source: Strategas, Bloomberg
It is also evidently recovering in Europe. The Stoxx 600 is an index of 600 large cap listed European companies covering 18 European countries and approximately 90% of total European stock market capitalisation.
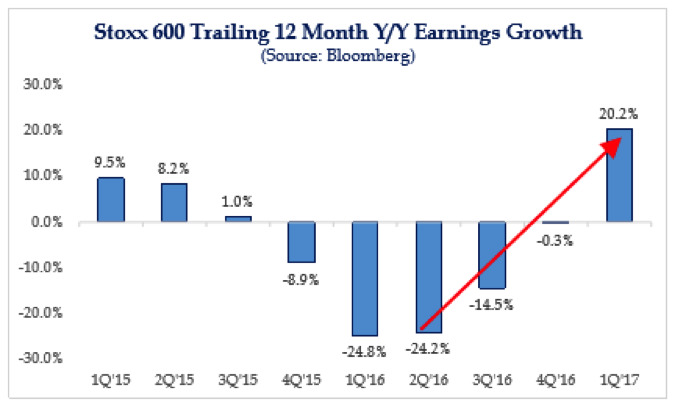
Figure 4. Stoxx 600 Trailing 12 Month Y/Y Earnings Growth
Source: Strategas, Bloomberg
And even in Japan. Of course, the question remains whether or not these patterns of earnings recovery can be maintained.
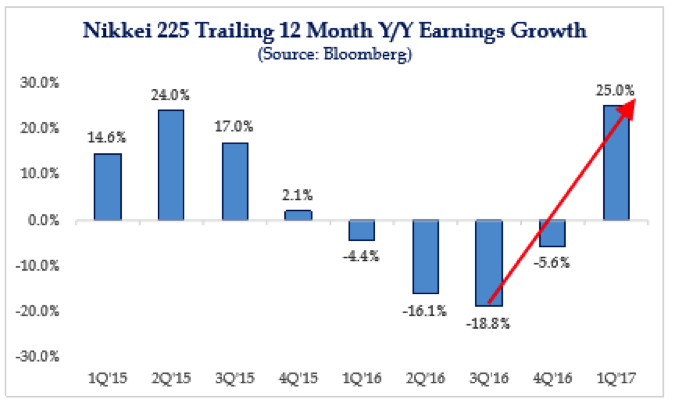
Figure 5. Nikkei 225 Trailing 12 Month Y/Y Earnings Growth
Source: Strategas, Bloomberg
The Macron factor
A mere three months ago, market pundits were calculating the chances of a Marine Le Pen victory in the French presidential election, and the risk of “Frexit”. Today, Emmanuel Macron has secured an unprecedented victory, with his newly-minted centrist political party En Marche! (founded just 18 months ago, and bearing Macron’s initials). He now dominates the National Assembly with 54% of members, and has a progressive reformist and market-friendly agenda. The mood in Europe has shifted and a new sense of optimism is in the air.

The officially released portrait of President Emmanuel Macron of France, which will hang in every town hall, post office and police station in France, and in every French embassy.
Eurozone “animal spirits” are stirring – see rising business confidence…
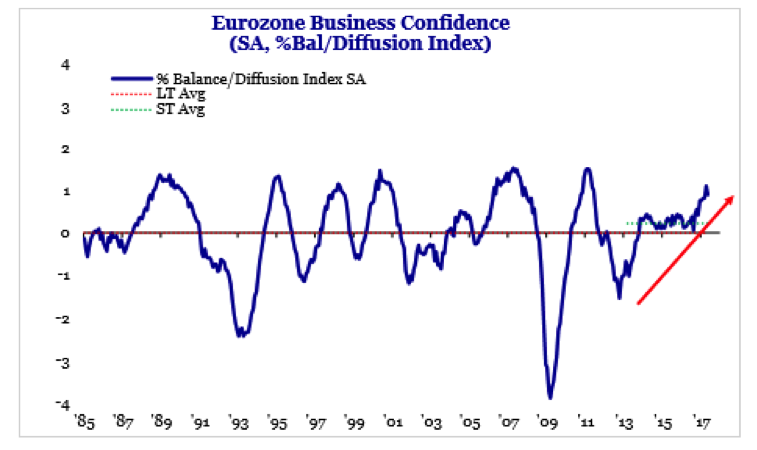
Figure 6. Eurozone Business Confidence (SA, %Bal/Diffusion Index)
Source: Strategas
And so is consumer confidence on the ascent.
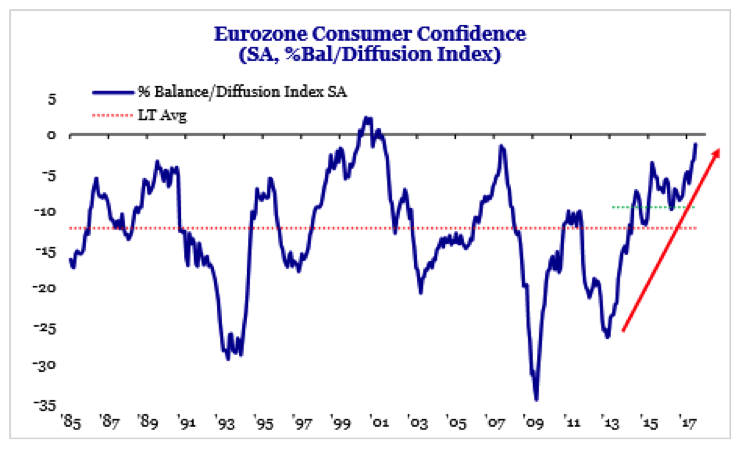
Figure 7. Eurozone Consumer Confidence (SA, %Bal/Diffusion Index)
Source: Strategas
USA recovery continues
US real GDP growth is far from “robust” – but on the other hand, there are significant positive signs that suggest the recovery remains on track, particularly in employment, housing, manufacturing and energy markets. Growth is still far off the rate promised by President Trump, but could be boosted if just some of his tax and business-aligned policies gain traction.
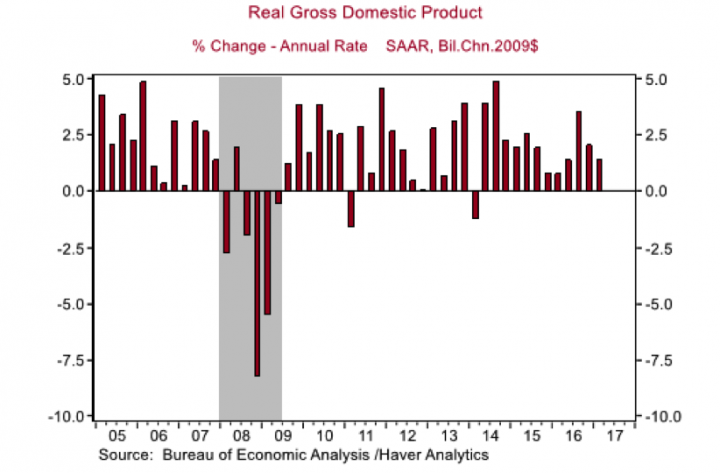
Figure 8. Real GDP (% Change – Annual Rate; SAAR, Bil.Chn.2009$)
Source. Bureau of Economic Analysis /Haver Analytics
China
China’s Purchasing Managers Index (PMI) suggests a soft landing is the most probable scenario. This is true for both the manufacturing sector, and the services sector.
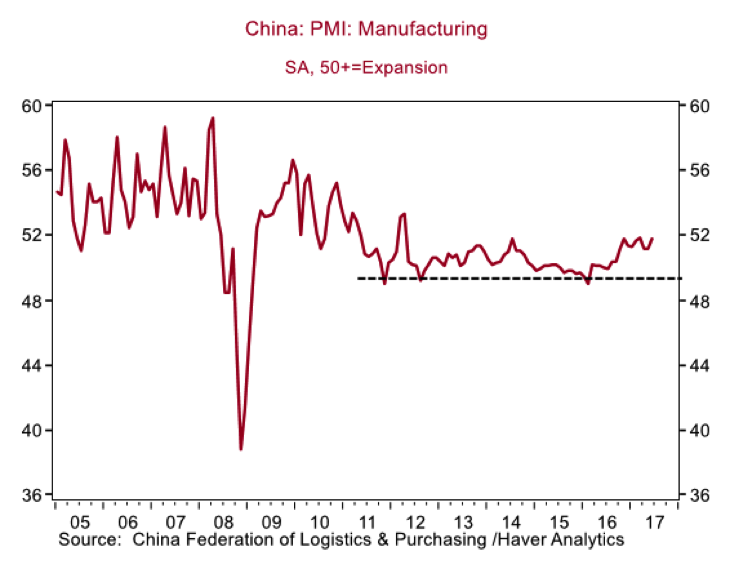
Figure 9. China: PMI: Manufacturing (SA, 50+=Expansion)
Source. China Federation of Logistics & purchasing /Haver Analytics
China’s non-manufacturing sector continues to expand from the lows of 18 months ago, in line with Xi Jinping’s policy of strengthening domestic consumption.
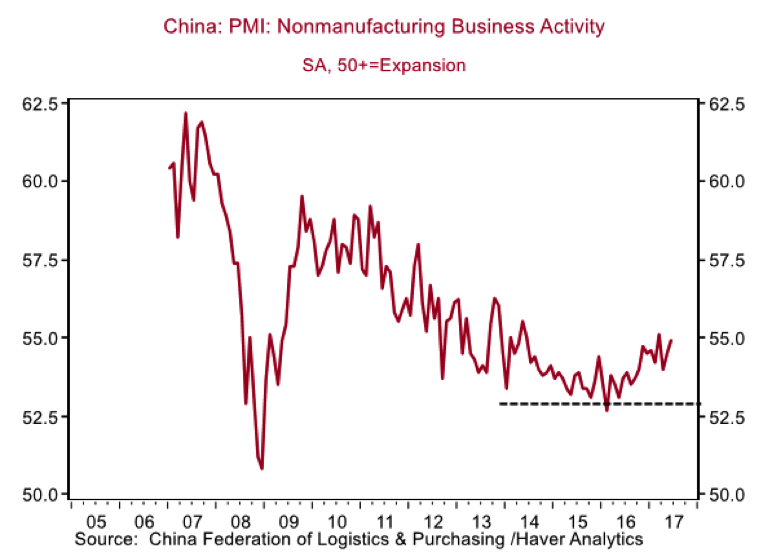
Figure 10. China: PMI: Nonmanufacturing Business Activity (SA, 50+=Expansion)
Source. China Federation of Logistics & purchasing /Haver Analytics
So much for the good news – but what about the risks?
In the second half of this report, we also discuss the key risks: (VIEW LINK)
Never miss an update
Enjoy this wire? Hit the ‘like’ button to let us know.
Stay up to date with my current content by
following me below and you’ll be notified every time I post a wire
The Clime Group is a respected and independent Australian Financial Services Company, which seeks to deliver excellent service and strong risk-adjusted total returns, closely aligned with the objectives of our clients.

Clime Investment Management
Funds Management & Stock Research
Clime Investment Management
The Clime Group is a respected and independent Australian Financial Services Company, which seeks to deliver excellent service and strong risk-adjusted total returns, closely aligned with the objectives of our clients.
Expertise
Clime Investment Management
Funds Management & Stock Research
Clime Investment Management
The Clime Group is a respected and independent Australian Financial Services Company, which seeks to deliver excellent service and strong risk-adjusted total returns, closely aligned with the objectives of our clients.
Expertise
Comments
Comments
Sign In or Join Free to comment