7 Lessons In Liquidity
Secular declines in interest rates have led to high valuations and lower expected yields across most asset classes. This has pushed investors toward higher-yielding, often less liquid investments. Unsurprisingly, this shift has prompted an increase in liquidity concerns among market participants, while recent events, including the public collapse of several well-known investment funds, have further focused attention on the importance of liquidity management. Measuring, modeling and monitoring liquidity risk is challenging and rife with potential misconceptions. This piece outlines seven lessons in liquidity and dispels some misleading conventional wisdom.
“Revenue is vanity, profit is sanity, but cash is king.”
- Anonymous
LESSON 1: Regulation giveth, regulation taketh away
After the financial crisis, new global standards increased the level of capital in the banking system and applied more restrictive criteria to calculate the risk on bank balance sheets. The results have been substantial. In the decade since the crisis, high quality loss-absorbing capital at banks has more than doubled. Tier 1 capital ratios have increased from below 6% in 2007–2008 to 12% today.
“Regulation in many cases is the wolf in sheep's clothing."
– Henry Paulson
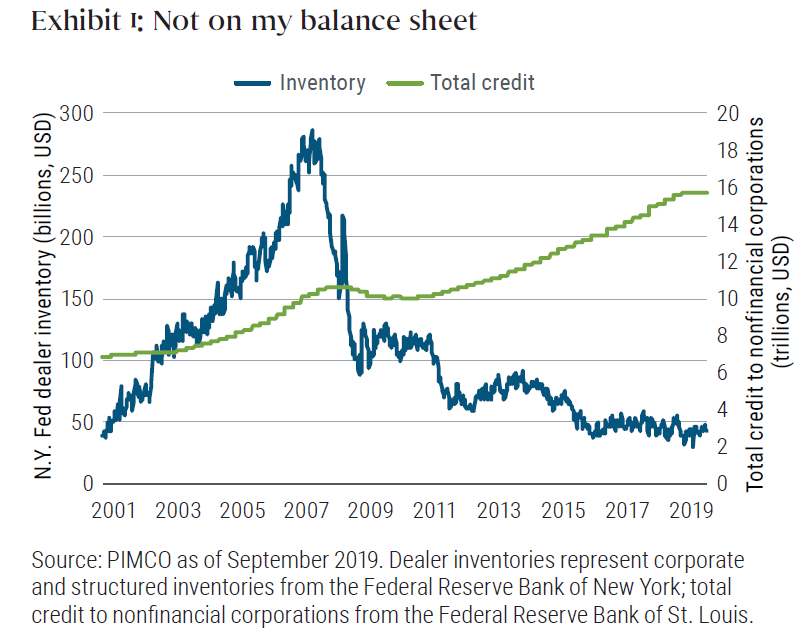
These changes have not come without costs. Increased capital charges have reduced banks’ willingness to hold certain assets. Dealer inventories – securities that institutions hold to facilitate market making – have fallen substantially. Exhibit 1 shows inventories of structured and corporate credit were slowly increasing until the financial crisis, when they sharply fell, from nearly $300 billion to only $50 billion at the end of 2018. Should the market need immediate liquidity, this limited market-making capacity is concerning – and even more concerning given the large increase in credit over the same period: Total credit to nonfinancial corporates has risen nearly $6 trillion from its postcrisis low (60%). With dealers holding fewer of these assets for trading, it becomes harder to find active trading partners.
The market has tried to accommodate the new standards by changing how it trades, but to little effect. Intermediaries and investors have been increasing the number of cash corporate bonds transacted as portfolio or basket trades, in which the underlying cash bonds have similar characteristics to credit index products. In principle, these transactions allow dealers to more efficiently hedge market risk with index derivatives or exchange-traded funds (ETFs) and should thus increase their ability to hold corporate debt. Despite this development, overall inventories of these products have continued to shrink.
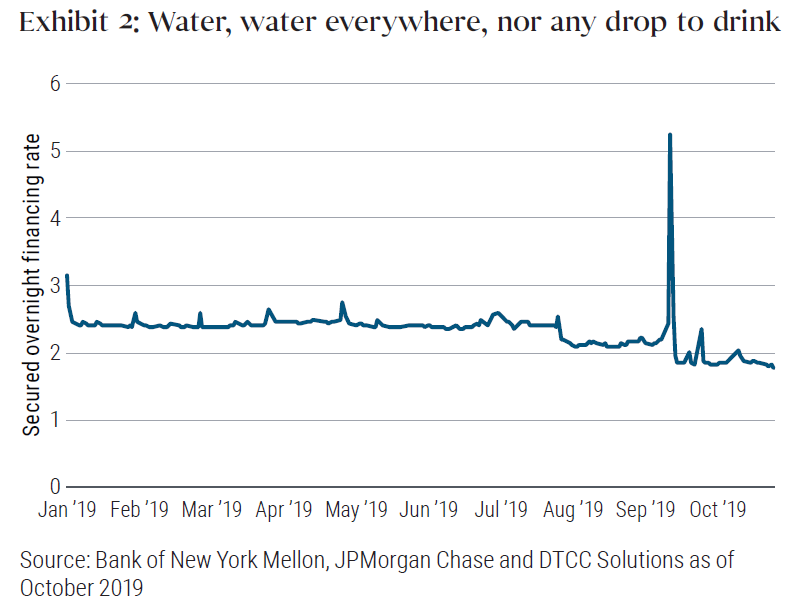
The consequences of restricted balance sheets are not merely theoretical, as we show in Exhibit 2. On 16 September 2019 and 17 September 2019, the rate on overnight repurchase agreements (repos) secured by U.S. Treasuries soared from just over 2% to more than 5.25%. Intraday, the rates on loans secured by agency mortgages briefly exceeded 10%!
The intraday-high rates were found only on companies essentially in default: the ICE BofAML US High Yield CCC and below index on 17 September 2019 yielded 11.65%. Yet numerous banks were unwilling to provide collateralized lending at these rates. At a minimum, this shows that excess reserves were significantly less abundant than previously thought.
There are plenty of competing explanations for this distortion, such as end-of-quarter corporate tax payments, settlement of a Treasury auction and other aberrant liquidity needs. However, it is also reasonable to believe that bank capital requirements and related excess cash reserves at the Federal Reserve exacerbate recurrent liquidity shortages.
In short, bank balance sheets are safer in part because some of their risk has been transferred to investors. Banks are more robust and less likely to propagate credit shocks to other sectors, but they appear less likely to act as intermediaries, thus reducing market liquidity. Regulations can hurt by helping.
LESSON 2: Don't buy with buy and hold
Ideally, you want to know who else holds the securities in your portfolio. If buy-and-hold investors are a large fraction of the market for assets that you own, your ability to find active trading partners in those securities will be limited. For example, pensions and insurance companies use investment grade (IG) bonds to hedge their long-term liabilities. This makes them large passive holders of these securities: Since 2011, insurance companies have held an average 32% of all outstanding IG corporate debt.
“I don’t care to belong to any club that will have me as a member.”
– Groucho Marx
When no one is trading securities, it is harmful to the securities’ liquidity. This effect is most stark during periods of increased market volatility, which tend to coincide with higher liquidity costs. Indeed, Dick-Nielsen and Rossi (2018) find that spreads widen more after rating downgrades when there are more insurers holding the underlying security. Instead of exacerbating liquidity issues with passive positioning, successful active managers can exploit security-level mismatches in liquidity to the benefit of their clients.
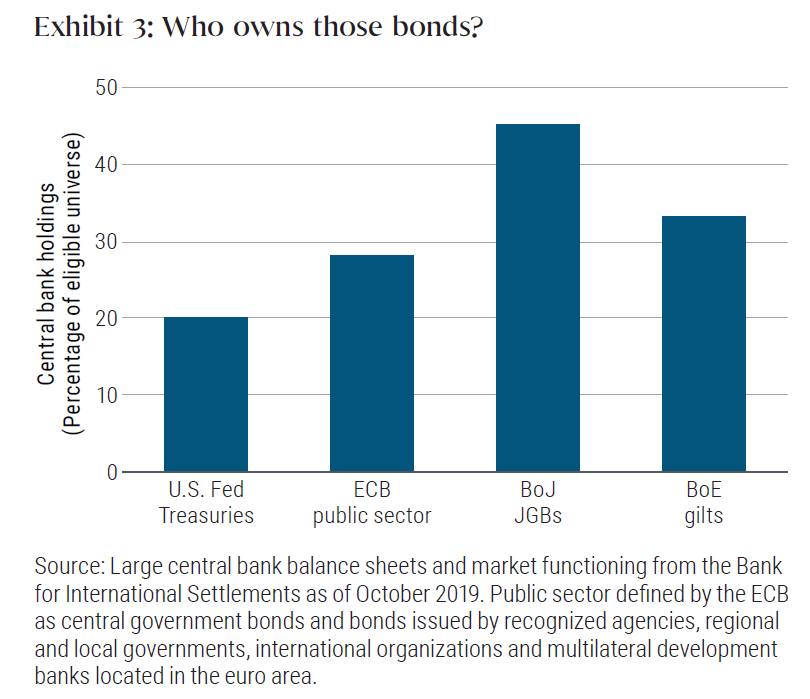
Increasing concentration is not limited to insurers. The past decade has seen a shift in central banks’ approach to monetary policy. As yields have approached zero, bank balance sheets have become swollen with assets and have driven up prices. Almost $15 trillion of outstanding debt worldwide now features negative yields. As a consequence, there is increasingly concentrated ownership of securities that typically have been considered safe and liquid, such as sovereign debt (see Exhibit 3). The effect is particularly stark in Japan, where the central bank now owns more than 40% of government bonds and 77.5% of ETFs.
Increasing buy-and-hold ownership in corporate credit over the past decade has demonstrably reduced the amount of available liquidity. At the same time, central banks have taken large, persistent positions in many markets. The liquidity effect of their purchases on markets for the underlying assets has not been tested.
LESSON 3: You need more liquidity than you need
Liquidity is more than a defensive concern. Ideally, asset managers want to go on the offensive to take advantage of bouts of volatility to extract returns for their clients.
“Precision beats power; timing beats speed.” – Anonymous
Liquidity events can lead to fire sales, in which organizations have to sell at depressed prices to raise needed cash. Fire sales can simultaneously exacerbate liquidity squeezes and provide an array of high-Sharpe-ratio opportunities. Above, we highlighted a recent period when junk bond-like levels of return could briefly be achieved with U.S. government-level risk. There are plenty of similar examples of liquidity-related anomalies.
In line with his famous adage that investors should “be fearful when others are greedy and greedy when others are fearful,” Warren Buffett was one of the few liquidity providers during the financial crisis. For example, at the absolute height of the crisis, after the failure of Lehman Brothers, Buffett invested $5 billion in a combination of preferred shares and warrants of Goldman Sachs. The preferred shares yielded 10% and, as a result, were bought back by Goldman as soon as possible. Within two years, the preferred shares had earned Buffett $3.7 billion, and in 2013 the warrants were converted into an additional $2 billion in cash plus a stake in the bank that is currently worth $3.1 billion. All in all, Buffett saw a 176% return on his investment.
The crisis presented so many opportunities for profit that even the U.S. government played the part of an opportunistic investor, albeit a less than willing one. The Treasury Department purchased “distressed” assets as part of the Troubled Asset Relief Program (TARP). Under this authority, the government made substantial investments in the economy, particularly in the banking and credit sectors, and although it was not a goal of the program, the financial sector’s share of TARP sent billions in profits back to Uncle Sam. TARP’s efforts for banks generated a $24.3 billion return on a $245 billion investment (9.9%); those for credit programs produced a $3.3 billion return on a $19 billion investment (17.3%). Even the investment in American International Group (AIG) – which was clearly not intended to be profitable given that the company was losing over half a billion dollars per day at that time — ended with $22.7 billion more in cash collected than disbursed.
Typically, there are two polar forms of financial market structure: high liquidity/low returns or low liquidity/high returns. In an illiquid market, a successful manager should actively provide liquidity and reap high – sometimes very high – returns.
LESSON 4: Don't fight the last war
The nonagency mortgage is the poster child of the 2008–2009 crisis and, as such, is seared in the financial industry’s collective memory as high risk and fragile. However, assets that were brittle in the past may be among the most robust today. “Past performance is not an indicator of future results,” it turns out, is more than a cliché.
“If humans fight the last war, nature fights the next one.”
– Nassim Nicholas Taleb
Indeed, since the crisis the nonagency market has benefited from a combination of increasing asset values, seasoning and generally stronger fundamentals. New regulations on nonagency mortgages have made them significantly less appealing to many financial institutions, though the underlying mortgages are much less likely to default. As we show in Exhibit 4, loan-to-value (LTV) ratios on mortgages in precrisis structured products have steadily fallen since 2012. With current collateral values (LTVs of around 60%), home prices would need to fall by 50% or more for LTVs on these mortgages to reach their precrisis highs. Not all assets have seen this improvement, however. Nonfinancial corporate leverage (debt-to-equity) has increased over the same time period, weakening the resilience of this sector
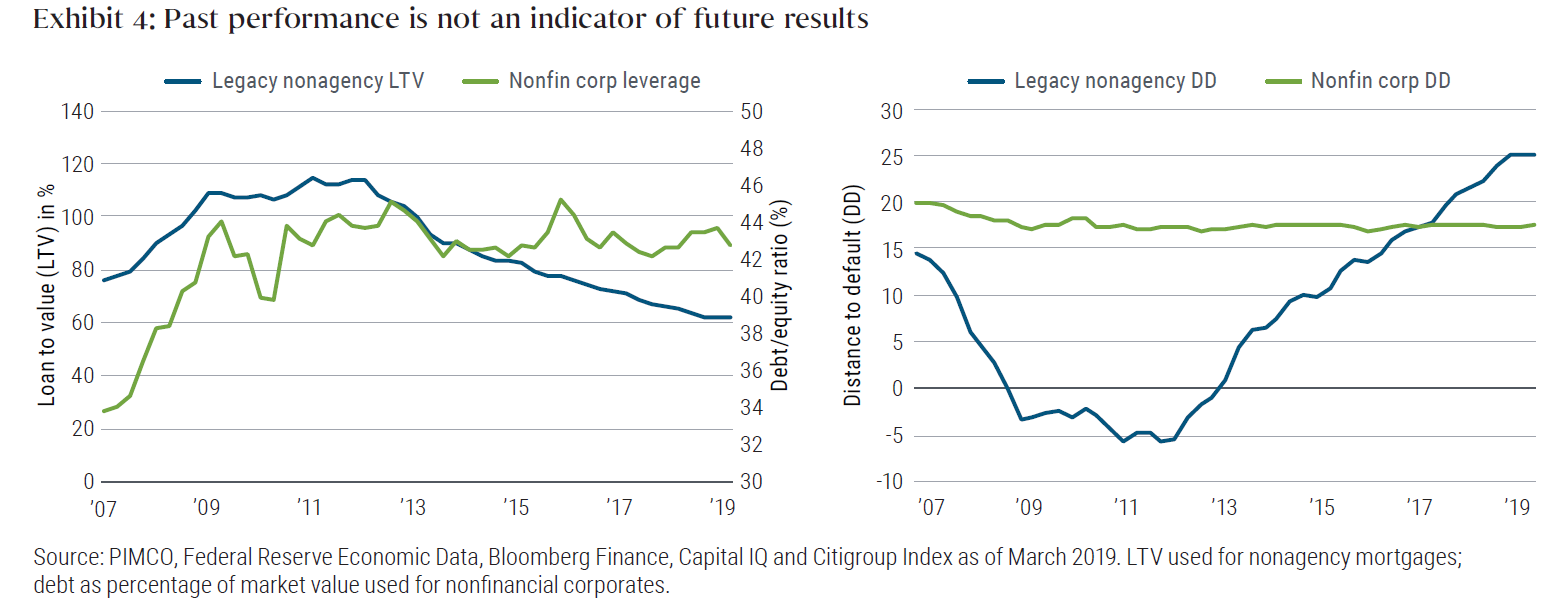
Using a simple Merton distance-to-default (DD) model, a mortgage was 30% closer to default than a corporate bond in 2007. In contrast, using 2019 balance sheets, the same mortgage is now 40% further from default (see Appendix for details).
There is every reason to think that evolving credit quality will affect liquidity. Sharif et al. (2018) estimate that the liquidity cost of corporate bonds, 42 basis points (bps) in normal times, increases over eight times during crisis periods (to 339 bps). Unsurprisingly, these costs are correlated with default risk: Bonds with lower credit ratings have even higher trading costs.
The past decade has seen substantial changes in credit quality and risk across sectors. Do not fight the last war.
LESSON 5: Sometime bigger is bigger
Asset managers’ resilience in illiquid markets is related to their size: Larger firms enjoy access to more diverse investors, counterparties and assets, all of which benefit them when the market is stressed.
“You’re gonna need a bigger boat.” – Roy Scheider, Jaws
Managing liquidity is easier in a larger fund with many investors. To take a simple example, consider a fund whose investors each have a 20% chance of withdrawing their money on any given day. While the fund will average 20% outflows, the range around this number will be heavily influenced by the number of investors in the fund. If investors behave independently of one another (unlikely in a liquidity crisis), a fund with 10 investors will have a 12% probability of experiencing outflows of more than 30%.
With 1,000 investors, this probability falls to essentially zero (see Appendix for details). Although this model is highly stylized and should not be taken literally, more investors usually mean more predictable funding needs.
Just as more investors benefit from one another, so do more diverse counterparties. A fund must be robust to liquidity issues at its trading partners. More counterparties mean that any run is more likely to affect a smaller portion of them. Indeed, the Federal Reserve’s definition of a “liquid and readily marketable” security spends as many points discussing the diversity of the market makers as it does the features of the security.9 Today, 24 primary dealers trade directly with the New York Federal Reserve. This is down 50% from the late 1980s, and even this statistic overstates the actual diversity: The top five firms handle 58% of all trading, and the top 10 more than 85%. It is no wonder that the U.S. Treasury has been relaxing primary dealer requirements to attract more counterparties to this market.11
Finally, a larger manager is more likely to have access to more diverse assets. Liquidity issues in specific asset classes will be less problematic for a manager with many options. Although the repo market is perceived as safe 99.99% of the time, you would have had a rough time in September 2008 or September 2019 if it were your only source of funding. Access to more markets provides access to more options. A larger manager is better positioned to intelligently (and, one hopes, profitably,) trade in more varied instruments and access more diverse funding.
The liquidity advantage of a large asset manager is not theoretical. According to the International Monetary Fund’s analysis of fixed income funds, “larger funds are less susceptible to liquidity shortfalls and tend to face smaller shortfalls than smaller funds,” in part because they “typically face lower redemption stress” and hold “diversified portfolios provide them with more ample liquidity,” for all of the reasons discussed above. Size has implications beyond survival: Access and expertise in many markets provide more frequent opportunities for excess returns. If one market is thirsting for liquidity and other markets are relatively unaffected, a large active manager is in a better position to intermediate the different liquidity needs. This will help that manager survive liquidity crises and try to provide handsomely to its investors while doing so.
LESSON 6: Out of complexity, find simplicity
Derivative markets are sometimes thought of as complex or even esoteric, and some investors are wary of them. This stigma can spill over into their views on the liquidity of derivatives. However, standardized derivative contracts can be a reliable source of funding.
“Simplicity is complexity resolved.” – Constantin Brancusi
When investors gain exposure to commodities, they rarely have truckloads of oil barrels or pork bellies delivered to their front doors. Instead, they trade in futures, where their gains or losses are based on movements in the prices of those goods, and not in the physical commodities themselves. Just as the futures market facilitates liquid trading of these assets, there are standardized derivative contracts, which improve liquidity in many other markets. The most widely used of these derivatives are government bond futures and interest rate swaps, liquid means of adjusting duration and targeting specific areas of yield curve exposure. There are two additional examples in the mortgage and corporate debt markets.
Within agency mortgage-backed securities (MBS), the “to be announced” (TBA) market allows for the trading of agency mortgage exposure without requiring the purchase of specific mortgages. Instead, the investor commits to purchasing pools of mortgages with certain characteristics at a future date. Similar to commodity futures, TBA contracts require less capital than if the investor was purchasing the underlying mortgages in cash. They are far more liquid as well: Daily volumes in the secondary market for TBAs are almost 10 times higher than those for specified pools of loans (Gao et al. 2017).
In the corporate debt market, a credit default swap (CDS) contract allows investors to take exposure to the credit risk of an issuer without purchasing the underlying bond. The Credit Default Swap Index (CDX) consists of a portfolio of CDS contracts, which traders use to adjust their exposure to the broader corporate IG credit market. Similar to TBA contracts, CDS and CDX contracts require less capital than buying cash bonds, and the liquidity of the CDX contracts allows portfolio managers to gain or reduce credit exposure for a fraction of the transaction costs of individual cash bonds or even a broad basket of names. Recent indications show a 2 bps–3 bps bid- offer spread for liquid investment grade cash bonds, compared with ¼ bps–½ bps for even larger-size blocks of the IG CDX contact. The CDX index has historically traded with tighter spreads during crisis periods as well: Cash-bond spreads widened almost twice as much as CDX during the 2008 crisis (Boyarchenko et al. 2018). If investors had to sell at the height of the crisis, they likely would have been better off holding the simpler bond and adjusting their exposure with CDS.
Derivatives can provide capital-efficient and liquid exposure in a variety of markets. TBA and CDX can give investors liquidity. Despite their reputation for complexity, certain derivatives are simpler and more liquid than cash purchases
LESSON 7: Focus on the solutions, not the problems
Liquidity events can have potentially systemic impacts. The market is constantly searching for solutions, and several developments may help keep investors out of harm’s way.
“Victory comes from finding opportunities in problems.”
– Sun Tzu
Central banks support liquidity mainly through banks and primary dealers. As we have seen, this is usually effective – except, of course, when those same intermediaries have their own liquidity issues and elect not to lend. If banks want to avoid intermediating liquidity on their balance sheets, one potential solution is the simple provision of collateralized lending from their balance sheets. A particularly salient example: sponsored repo transactions, in which banks intermediate repo needs for nondealers without the costly capital charges explained in Lesson 1. In exchange, they guarantee the pledges of the sponsored members. Unsurprisingly, these transactions have rapidly increased in popularity. From June 2017 through December 2018, they grew from essentially zero to more than $100 billion.
One potential way to deliver more liquidity is to allow for more flexible collateral. The European Central Bank allows certain credit-risky bonds and asset-backed securities to be used in repos. The increased flexibility permits an additional €7 trillion of nongovernment assets to serve as a potential lifeline when liquidity needs arise.
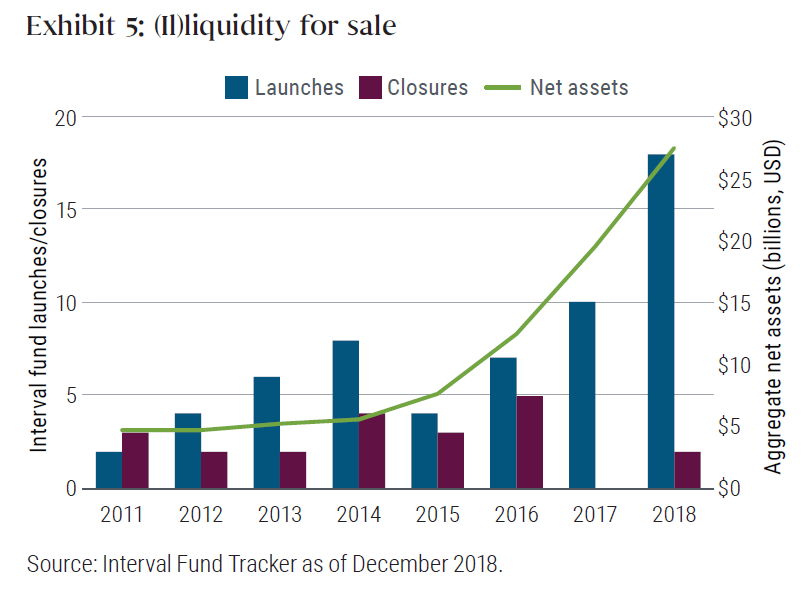
Finally, managers can match the liquidity profile of their assets to specific funds. Unlisted vehicles can provide liquidity to investors at specific intervals. Interval funds typically allow partial redemptions quarterly, semiannually or annually. In the same spirit, tender offer funds allow redemptions only at the discretion of the board. These funds mitigate the asset manager’s risk of redemptions and potential forced selling of illiquid assets. It is no wonder that these products have proliferated as liquidity concerns have mounted. In Exhibit 5, we show interval fund assets have grown at a 40% annualized rate since 2015
Investors are burdened with reduced liquidity in these funds, but willingly. In exchange, they receive attractive tax reporting, exposure to alternative assets and potential for higher returns. Baz, Stracke and Sapra (2019) estimate that investors could earn an additional 2% annually for holding illiquid assets.
Every problem presents an opportunity. The market has responded to growing liquidity concerns in several ways, including increased repo arrangements outside of primary dealers, public provision of liquidity using more flexible collateral and a proliferation of unlisted vehicles to help control a manager’s liquidity profile
Conclusion
Liquidity concerns are top of mind for many market participants. We all know there will be another crisis, but its features and timing are impossible to predict. Market disruptions are both inevitable and unpredictable. However, there are several lessons we can learn from the markets today that may challenge conventional wisdom whenever and wherever the next downturn should appear.
- Transferring risk is easy, but removing it is hard. Recent improvements in liquidity and solvency in the financial sector have had a chilling effect on market-making activity in many assets
- You should know who else owns your assets. Concentrated buy-and-hold ownership can exacerbate liquidity events, and expanding central bank balance sheets may affect liquidity in unexpected ways
- Credit conditions have materially changed since the last crisis. The riskiest assets of the past may be among the most resilient today.
- Bigger can be better. More diverse investors, counterparties and investment opportunities combine to offer larger asset managers more ways to isolate or entirely avoid liquidity crises.
- Simple assets are not necessarily the easiest to trade. Derivative markets can provide potentially more reliable and more liquid exposure than individual assets.
- Financial markets are relentlessly creative. Nascent efforts to manage liquidity risks include relaxed collateral requirements, rapid expansion of repo market access and the growing appeal of funds that reduce liquidity for end investors.
Finally, even the best strategies will fail if they are exploited simultaneously by all market participants. The most pernicious risk may be a comfortable consensus. When everyone is agreeing with you, you need to be ready to disagree with yourself.
Get the latest insights from the worlds premier fixed income manager
Be the first to read our latest Livewire content by clicking the 'follow' button below.. Want to find out how fixed income can play a role in your portfolio? Hit 'contact' to get more information.
Never miss an update
Enjoy this wire? Hit the ‘like’ button to let us know.
Stay up to date with my current content by
following me below and you’ll be notified every time I post a wire
With our launch in 1971 in Newport Beach, California, PIMCO introduced investors to a total return approach to fixed income investing. In the 50 years since, we have continued to bring innovation and expertise to our partnership with clients seeking


PIMCO
With our launch in 1971 in Newport Beach, California, PIMCO introduced investors to a total return approach to fixed income investing. In the 50 years since, we have continued to bring innovation and expertise to our partnership with clients seeking
Expertise
PIMCO
With our launch in 1971 in Newport Beach, California, PIMCO introduced investors to a total return approach to fixed income investing. In the 50 years since, we have continued to bring innovation and expertise to our partnership with clients seeking
Expertise
Comments
Comments
Sign In or Join Free to comment
most popular
Equities
High conviction: What we’re backing for the long term
Livewire Markets