Are rate cuts good or bad for investors?
Most homeowners with a mortgage would know that the RBA, along with other central banks around the world, appear to be partway through a rate-cutting cycle. While the timing and extent of future moves are uncertain, the direction is clear enough.
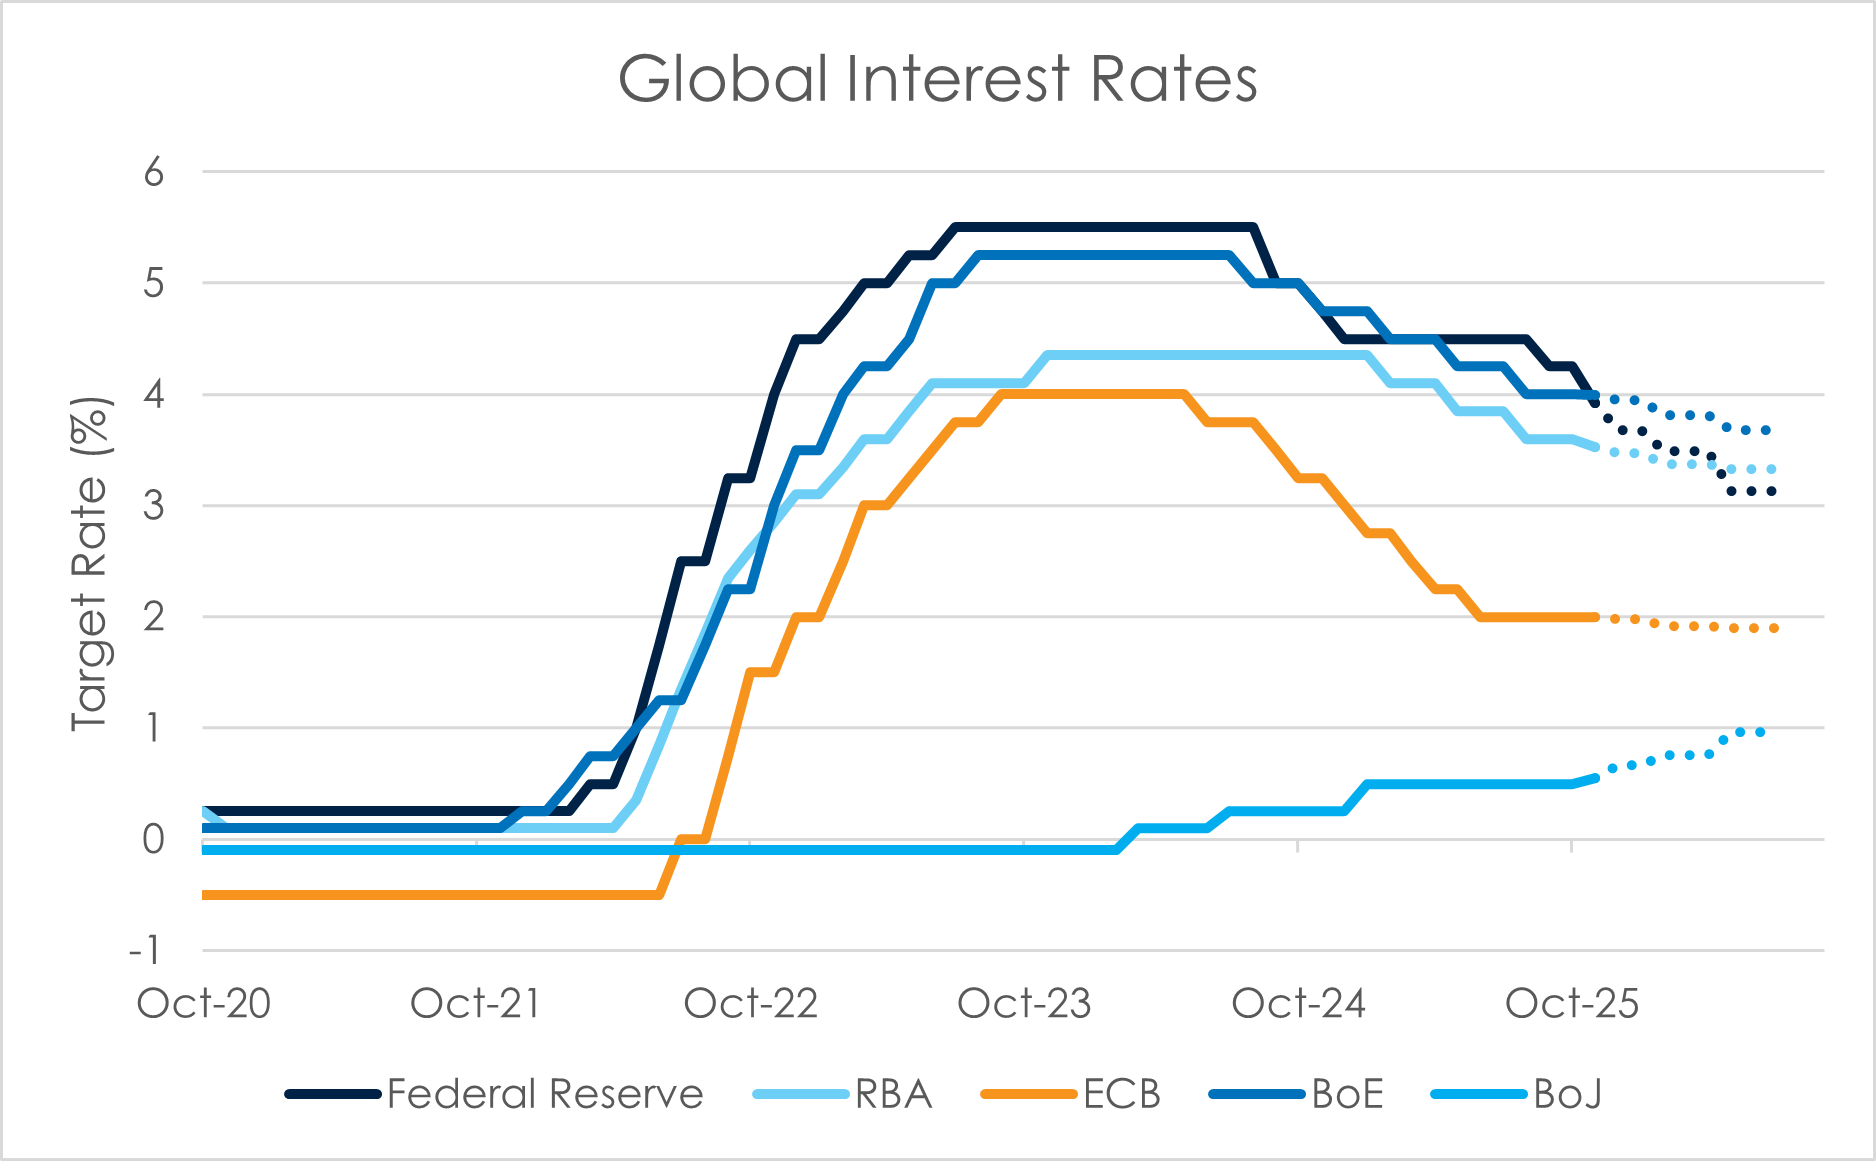
Rate cuts can be read two ways:
- Glass half full: With inflationary pressures easing, interest rates can move back towards more neutral policy settings. Lower rates reduce financing costs, encourage investment, plus can help support higher asset prices – a positive backdrop for investors.
- Glass half empty: Rates are being cut because growth is faltering. In this scenario, central banks are trying to get ahead of a downturn, hoping lower rates will soften the blow of recession and rising unemployment.
It’s the economy, stupid
Whether rate cuts ultimately prove to be a good or a bad thing for investors depends largely on one thing – does a recession follow?
In the chart below, we have plotted S&P 500 Index returns and 10-year US Treasury yields following the first rate cut, split between periods when a recession did and did not eventuate. We have also included the most recent cutting cycle, which commenced just over 12 months ago (Sep ’24), but appears to have many more cuts to come based on current estimates. The impact of the Liberation Day market is clearly visible in this return.
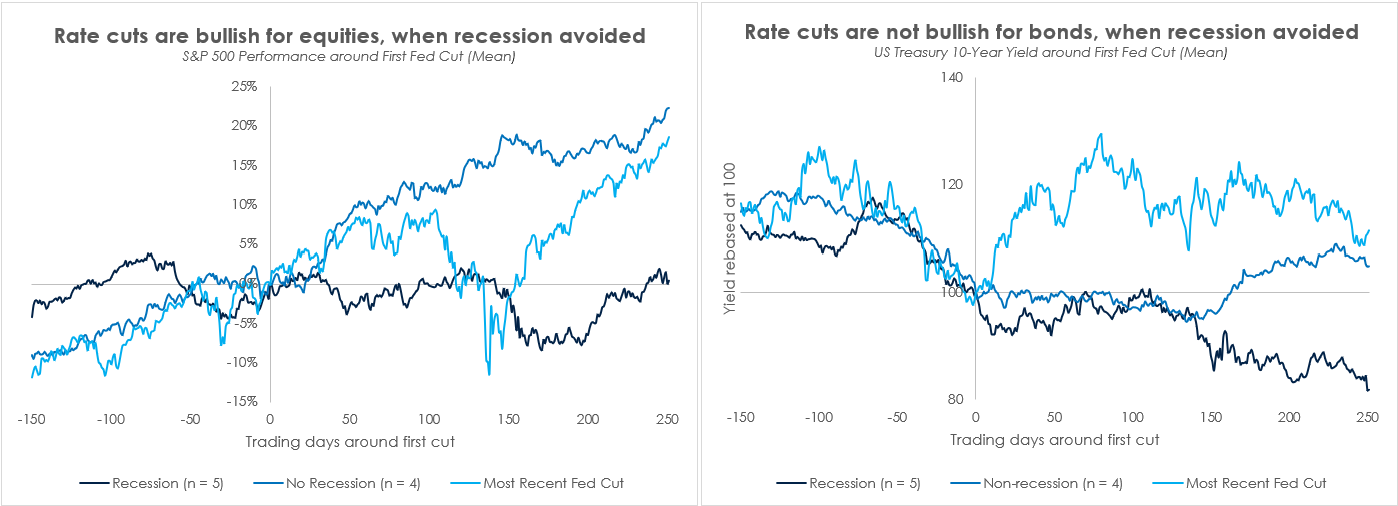
History rarely repeats, but it often rhymes. While the signals remain mixed (as they usually are), we lean towards the more optimistic view. Inflation has moderated, growth is holding up and unemployment, while rising, remains low by historical measures. In that environment, further rate cuts should be a net positive.
So should investors pile on risk?
Unfortunately, the economy is not always a good bellwether for the sharemarket. They don’t always move in step.
Improved economic conditions may assist with earnings growth and dividends, but these are only half the story when it comes to investment returns. The other half – and the much more volatile half – is the price investors are willing to pay for those earnings. Both the US and Australian markets trade near record highs, leaving little margin for error.
History shows that when valuations are this rich, five-year forward returns tend to disappoint. The charts below illustrate this point. Over a one-year horizon, the chart on the left shows that historically a starting P/E of 22.8 delivered a very wide range of outcomes over the subsequent 12 months. Anyone’s guess.
However, as we extend the horizon, the laws of gravity tend to manifest themselves more forcefully. In general, five-year returns have been woeful and the starting valuation a much more accurate indicator of prospective returns.
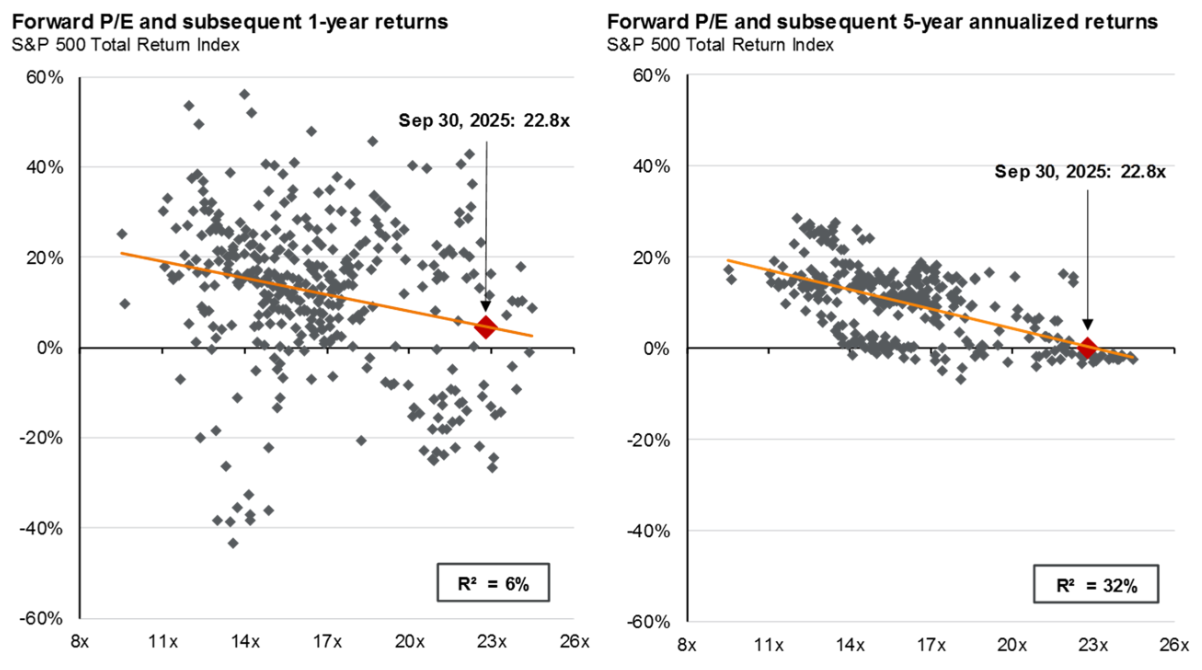
Source: FactSet, Refinitiv DataStream, S&P, JP Morgan Asset Management. Returns are 12-month and 60-month annualised total returns, measured monthly, beginning 12/31/93. R2 represents the percent of variation in total return that can be explained by forward P/E ratios. The forward P/E ratio is the most recent S&P500 Index price divided by consensus analyst estimates for earnings in the next 12 months, provided by IBES since Dec 1993 and FactSet since Jan 2022. Past performance is no guarantee of future results. Guide to the Markets – US Data as of Sept 2025.
The results are broadly similar for the Australian market. Here, we have used Price/Book as our valuation yardstick instead of Price/Earnings. This is due to the local market having a much higher component of cyclical exposures, which can cloud the fundamental valuation picture (as Peter Lynch noted, cyclicals tend to have earnings that are more variable than multiples). Using Price/Book avoids this.
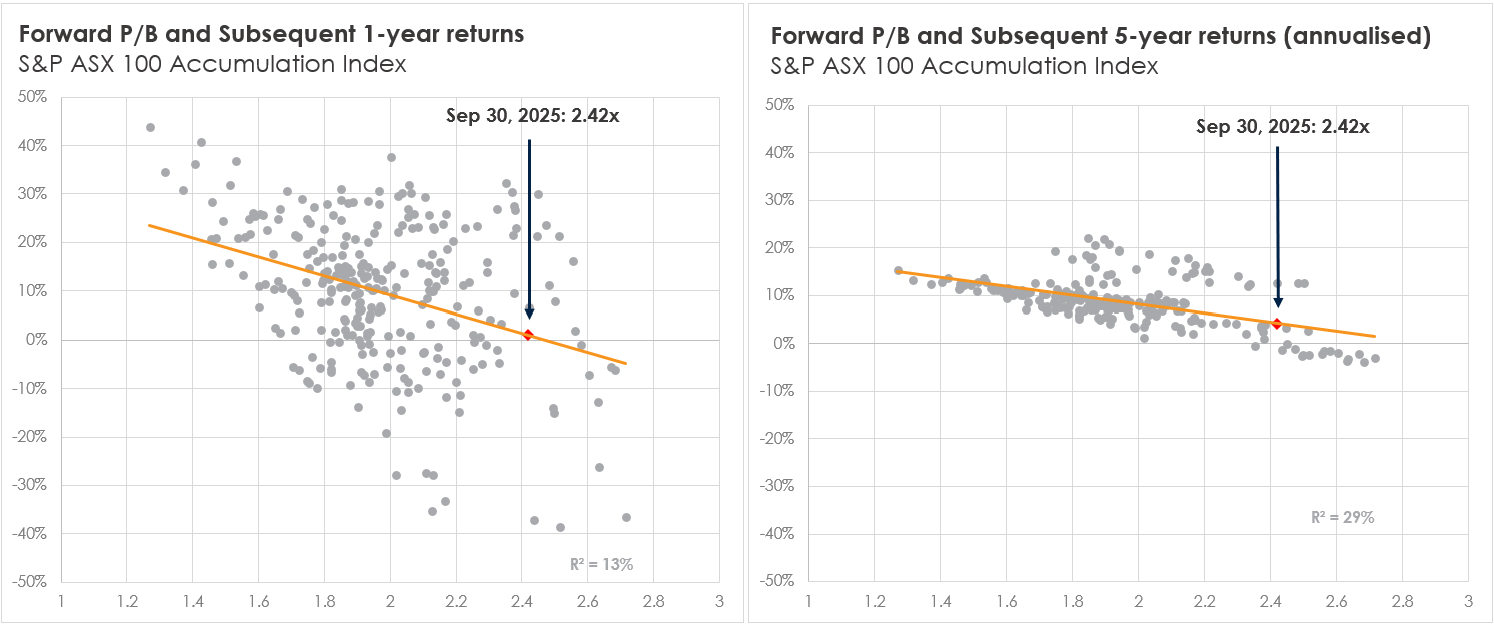
Will it be different this time? Even if a recession is avoided, today’s elevated valuations suggest any equity rebound could face greater headwinds than in past cycles. Better 'bang for your buck' may lie elsewhere.
This is where active management earns its keep
If valuation is such an important determinant of future expected returns, surely it makes sense to exercise discretion when putting new capital to work. However, not everyone finds the valuation argument compelling - mostly because it takes time. Over five years or longer, the relationship is clear. Over one or two, trends like AI or momentum can easily push prices far from fair value.
We see this short-term dynamic in both the Australian and US markets. Locally, valuations for major banks such as CBA remain unusually high. In the US, the “Magnificent 7” technology names have delivered exceptional earnings growth during the AI build-out, but expectations are now lofty. Our concern isn’t with what these companies have achieved, but with the valuations being paid for what comes next.
The sharemarket is not the economy
Nowhere is this distinction clearer than in the US. JP Morgan calculates that “AI related stocks have accounted for 75% of S&P500 returns, 80% of earnings growth and 90% of capital spending growth since ChatGPT launched in November 2022.”**
But does this massive cycle of investment, funded by the immense cashflows of the larger technology names, represent the ‘real’ economy in the United States?
One aspect to consider is the growth in earnings from smaller companies, well outside the vortex of AI expenditure, which has actually declined the past three years. This paints a very different picture of the underlying economy.
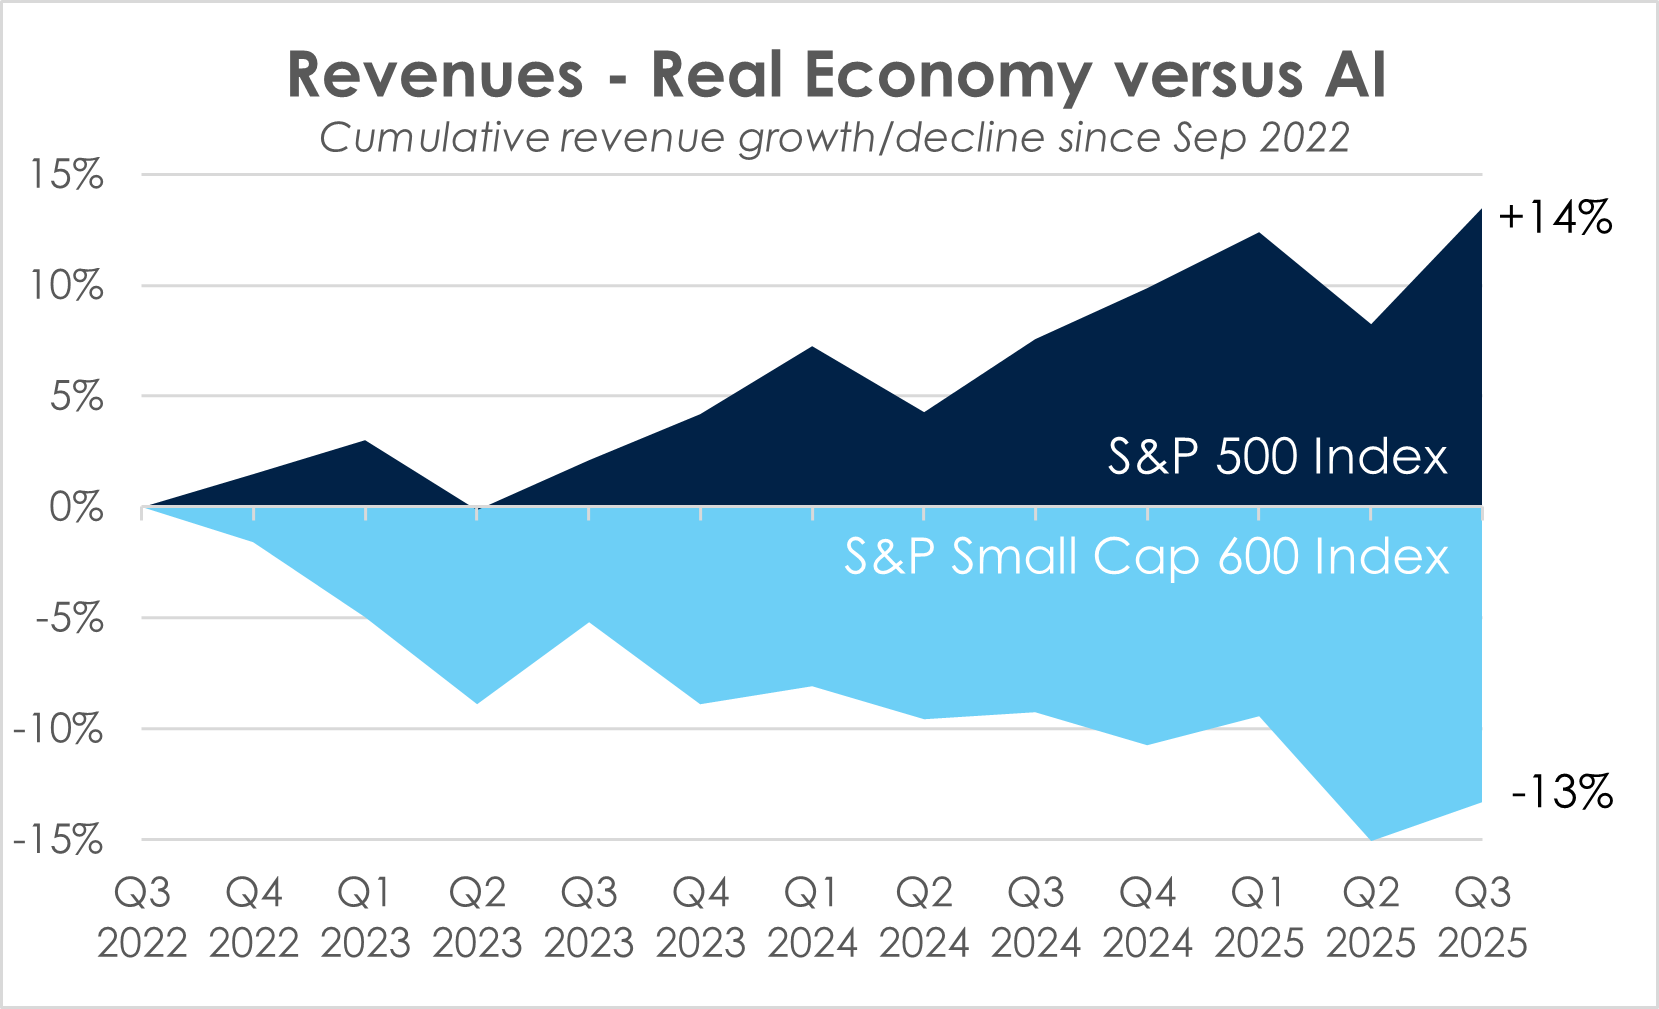
We believe the message is clear – we can’t simply point to the stellar sharemarket returns of the S&P 500, which is dominated by the Mag-7 technology shares, and infer that the broader economy is also booming.
In a similar vein, the Australian sharemarket has been buoyed by the re-rating of large financials, yet many discretionary and cyclical businesses tell a different story. It would be wrong to assume that record share market levels necessarily mean that the real economy is thriving.
Looking ahead
As rates move lower, history suggests smaller and more cyclical businesses - those closer to the “real” economy - tend to benefit most. Combined with active management that tilts toward value and discipline, and with a long-term perspective, we believe this next phase could present genuine opportunities for investors… outside of the broader cap-weighted indexes.
2 topics

