TOL - 15th Aug, 2025
ASX 200 flashes “overvalued” warning as key market indicator crosses danger level
A closely watched institutional indicator is flashing a warning that stocks are expensive. We investigate whether you should be worried.
One of Australia’s most closely watched institutional market indicators may be sending a warning to investors. The Macquarie Market PER – a valuation measure produced weekly by one of the country’s largest broking and research houses – has climbed to levels generally associated with widespread overvaluation. In fact, it’s now sitting at a record high, suggesting investors are paying more for earnings than at almost any other point in recent history.
In this article, we’ll unpack what the Macquarie Market PER indicator is, how it works, its track record in anticipating market shifts, and most importantly – whether investors should be concerned about what it’s telling us right now.
Understanding the P/E Ratio
One of the most widely referenced measures of stock market valuation is the Price-to-Earnings Ratio, or “P/E Ratio”. It is calculated by dividing the current price of an asset by the asset’s earnings.
This ratio acts as a shorthand for how much investors are willing to pay for each dollar of earnings. If the “E” (earnings) rises relative to the “P” (price), the P/E Ratio falls. That’s generally a positive sign as it costs less to buy a dollar’s worth of earnings, and in everyday terms, “costs less” usually translates to “cheaper”. So, we generally say that an asset with a lower P/E Ratio is cheaper than an asset with a higher P/E Ratio.
Conversely, if earnings fall relative to the price, the P/E Ratio climbs, and the asset is said to be more expensive. Of course, “cheap” and “expensive” are relative terms (as we’ll soon discuss!), for now, just note that market analysts often rely on a loose set of benchmarks when interpreting P/E Ratios:
Above 20 – Often considered expensive; historically, many major market tops have occurred when the market P/E pushed beyond this level.
Around 15 – Viewed as fair value.
Below 10 – Considered cheap; many significant market lows have coincided with P/E Ratios dipping under this threshold.

The Value Trap
While the P/E Ratio is a popular shorthand for market value, it can also be dangerously misleading. A “Value Trap” occurs when investors base their decisions on historical earnings data, only to discover that future earnings are far weaker than expected. A stock that once appeared to have a low and “attractive” P/E Ratio can suddenly see that multiple shoot higher when its actual earnings collapse, making it turn out to be far more expensive than initially thought.
The key takeaway? P/E Ratios are only valuable when based on forward-looking earnings estimates – and even then, they’re only as reliable as the forecast (and the forecaster). This means the real value in P/E Ratios lies in the skill, experience, and track record of whoever is calculating them.
Macquarie’s Australian Market PER
In its weekly “Market Ratios” series of research reports, Macquarie calculates a P/E Ratio for the Australian market based on its trailing six months of earnings and the broker’s forward six months of earnings. The Macquarie Market PER, as it is referred to, is one of the most comprehensive gauges of the value of Australian stocks.
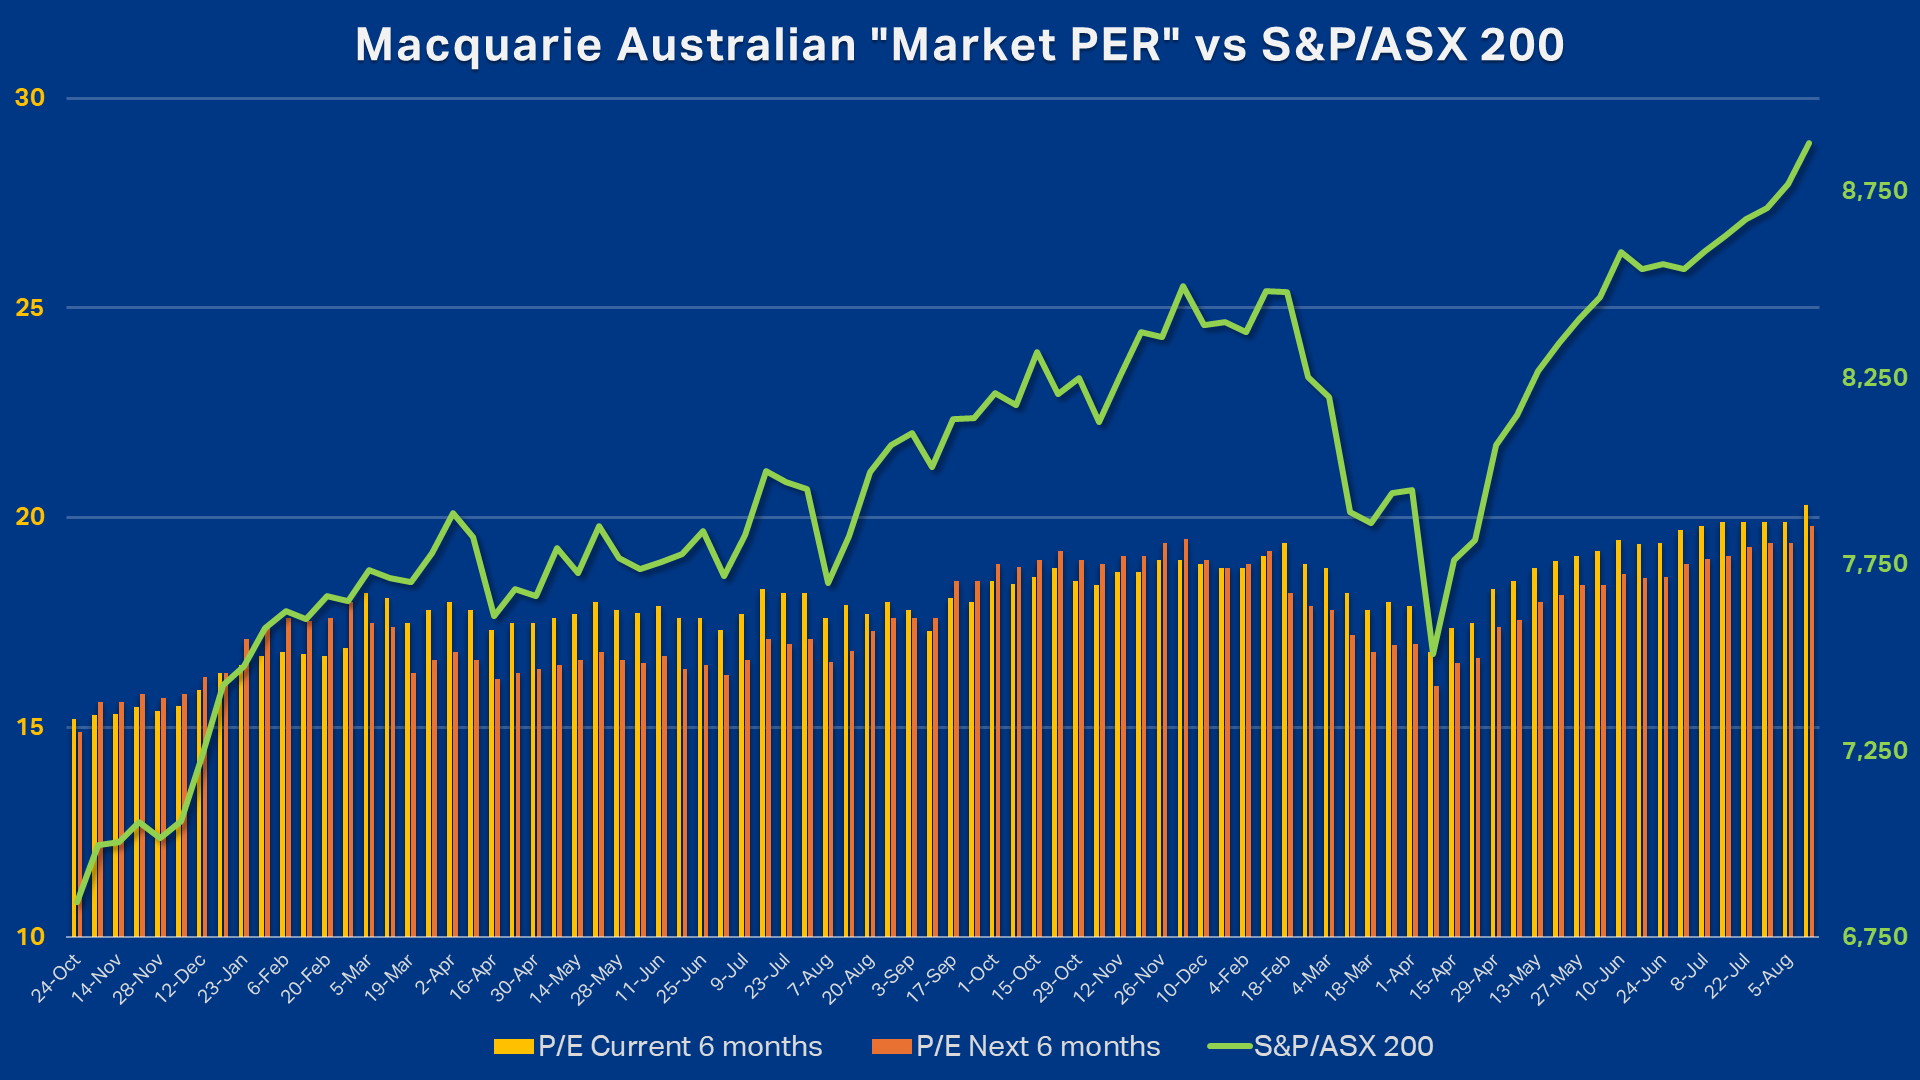
As of the latest Market Ratios report released yesterday, the trailing Macquarie Market PER – which refers to the earnings for the half-year ending 30 June 2025 – cracked the 20 level for the first time Market Index has been observing the report (since October 2023). At 20.3x (“x” is shorthand for “times earnings”), it potentially suggests that the recent run of record highs has caused Aussie stocks to officially become “expensive”.
Investors may take some comfort, though, in the fact that the forward-looking measure – which refers to the earnings for the half-year ending 31 December 2025 – is yet to breach 20x (but is not far away at 19.8x!). 20 is just a number, of course, it’s not like a flashing light went off in the main operations room of the ASX yesterday when Macquarie’s report was released – but we can say with confidence that both gauges are well above the traditional “fair value” benchmark of 15x.

The accompanying chart, which plots the S&P/ASX 200 (green line, right axis) against Macquarie’s Market PER (orange lines, left axis), shows that valuations have generally risen over the past two years, from around 15x in October 2023 to around 20x today. This suggests higher stock prices have occurred without commensurate earnings growth – i.e., investors are paying increasingly more for each dollar of forecast profit.
The reason why market analysts generally fret such elevated readings is that, should the forecast earnings growth fail to materialise, or if macroeconomic headwinds intensify, the market could see a valuation-led correction as prices adjust to more realistic profit expectations. In short, Macquarie’s Market PER is currently hinting that Australian stocks as a whole may be priced for perfection: I.e., there is likely little margin for disappointment.
Causality or coincidence?
Looking back over the past two years, there’s an observable pattern in the relationship between Macquarie’s Market PER and the performance of the S&P/ASX 200. When the PER has dipped towards the “fair value” zone around 15x – for example, in April 2025 and April 2024 – the market has tended to rally shortly after. Conversely, when readings have pushed towards 20x, such as in November–December 2024, they have often been followed by a period of consolidation or outright pullback.
That said, we need to be careful not to overstate the predictive power of these movements. The dataset is relatively small, and correlation does not necessarily imply causation. Short-term valuation peaks could coincide with other market drivers, the most obvious being the Trump tariff mayhem of March and April this year that saw stocks see-saw between the 20x and 15x regions pre- and post-correction. What we can say is that, on this particular measure of value, Australian stocks are currently trading at one of their least attractive ratios of earnings to price in a very long time.
Why the P/E Ratio might not be the best measure of ASX value
While the P/E Ratio is a simple and popular yardstick, it’s far from perfect, particularly for a market like Australia’s, which has a different sector composition to the US. Critics often point out that:
Sector composition skews results – The ASX is heavily weighted to financials and resources, which have very different earnings cycles and volatility compared to growth-oriented sectors (typically has historically made our market P/E Ratio lower than other countries, particularly the US).
Commodity price swings distort earnings – Resource company profits can spike or plunge with commodity cycles, making P/E ratios unusually low or high without reflecting sustainable earnings.
One-off events can mislead – Major macroeconomic shocks (e.g. COVID, 2022 invasion of Ukraine, etc.) can lead to temporary spikes/troughs in P/E ratios.
Interest rate environment matters – Low rates tend to justify higher P/E ratios, as investors accept lower earnings yields when bond yields are suppressed (right now, official rates are generally trending lower across the globe).
Comparisons across eras can be misleading – Just as in the US, where the market is now far more weighted to high-growth technology names than 20 years ago, today’s ASX has seen shifts in sector dominance away from traditionally low-P/E Ratio banks and resources, likely making historical comparisons less meaningful.
Conclusion: Important, but only one piece of the puzzle
Macquarie’s Market PER is, by recent experience, a useful and perhaps even reliable barometer of value. Right now, it’s flashing a warning signal. Yet, in practical terms, prices are high because investors with capital are choosing to buy stocks, and those holding stocks are reluctant to sell them. Both behaviours suggest that market participants still see value.
Assuming investors are acting rationally, the fact that the market sits at record levels can be taken as a vote of confidence in the earnings outlook. Still, as the chart above demonstrates, an elevated market P/E Ratio reminds us that vigilance is warranted. If earnings momentum falters, history suggests that share prices react negatively – often resulting in sharp corrections in stock prices. Still, there are two sides to even this coin, as the most compelling buying opportunities have emerged when the market P/E Ratio dipped back towards the “fair value” zone of 15x.
In conclusion, the P/E Ratio, and Macquarie’s Market PER in particular, can be a valuable part of an investor’s toolkit – but it should be treated as one piece of the puzzle, not the entire picture. Used wisely, it can help identify when caution is warranted, and when the odds might be stacked in favour of taking on more risk.
This article first appeared on Market Index on Wednesday, 13 August 2025.
Never miss an update
Enjoy this wire? Hit the ‘like’ button to let us know.
Stay up to date with my current content by
following me below and you’ll be notified every time I post a wire
Carl has over 30-years investing experience and has helped investors navigate several bull and bear markets over this time. He is a well respected markets commentator who specialises in how the global macro impacts Australian and US equities. Carl has a passion for technical analysis and has taught his unique brand of price-action trend following to thousands of Aussie investors.
........
Investing is risky. Inevitably you will endure losses. If you can't cope with losing, don't invest.

5 topics

Carl has over 30-years investing experience and has helped investors navigate several bull and bear markets over this time. He is a well respected markets commentator who specialises in how the global macro impacts Australian and US equities. Carl...
Carl has over 30-years investing experience and has helped investors navigate several bull and bear markets over this time. He is a well respected markets commentator who specialises in how the global macro impacts Australian and US equities. Carl...
Comments
Comments
Sign In or Join Free to comment