Australian ETF Review – One for the ages!
2020 was a standout year globally for ETFs, with the pandemic causing investors to turn to the liquidity and accessibility of ETFs in their droves in incredibly volatile conditions. It was also a year that finally silenced the sometimes outspoken critics of ETFs, some of whom had claimed that the investment vehicle had never been tested during stressful periods. In fact, ETFs globally coped admirably and reliably as investors bought and sold ETF holdings in record amounts during the ‘virus crises’. The Australian ETF industry, which started the year at $62 billion, ended up more than 50% higher, $95.2 billion, an all-time high, although admittedly this included a large conversion event by Magellan which immediately added around $13 billion to the industry*. Excluding this event, the industry grew by a still-rapid 32% over the year. Read on for more details, including best performers, asset flow categories and more.
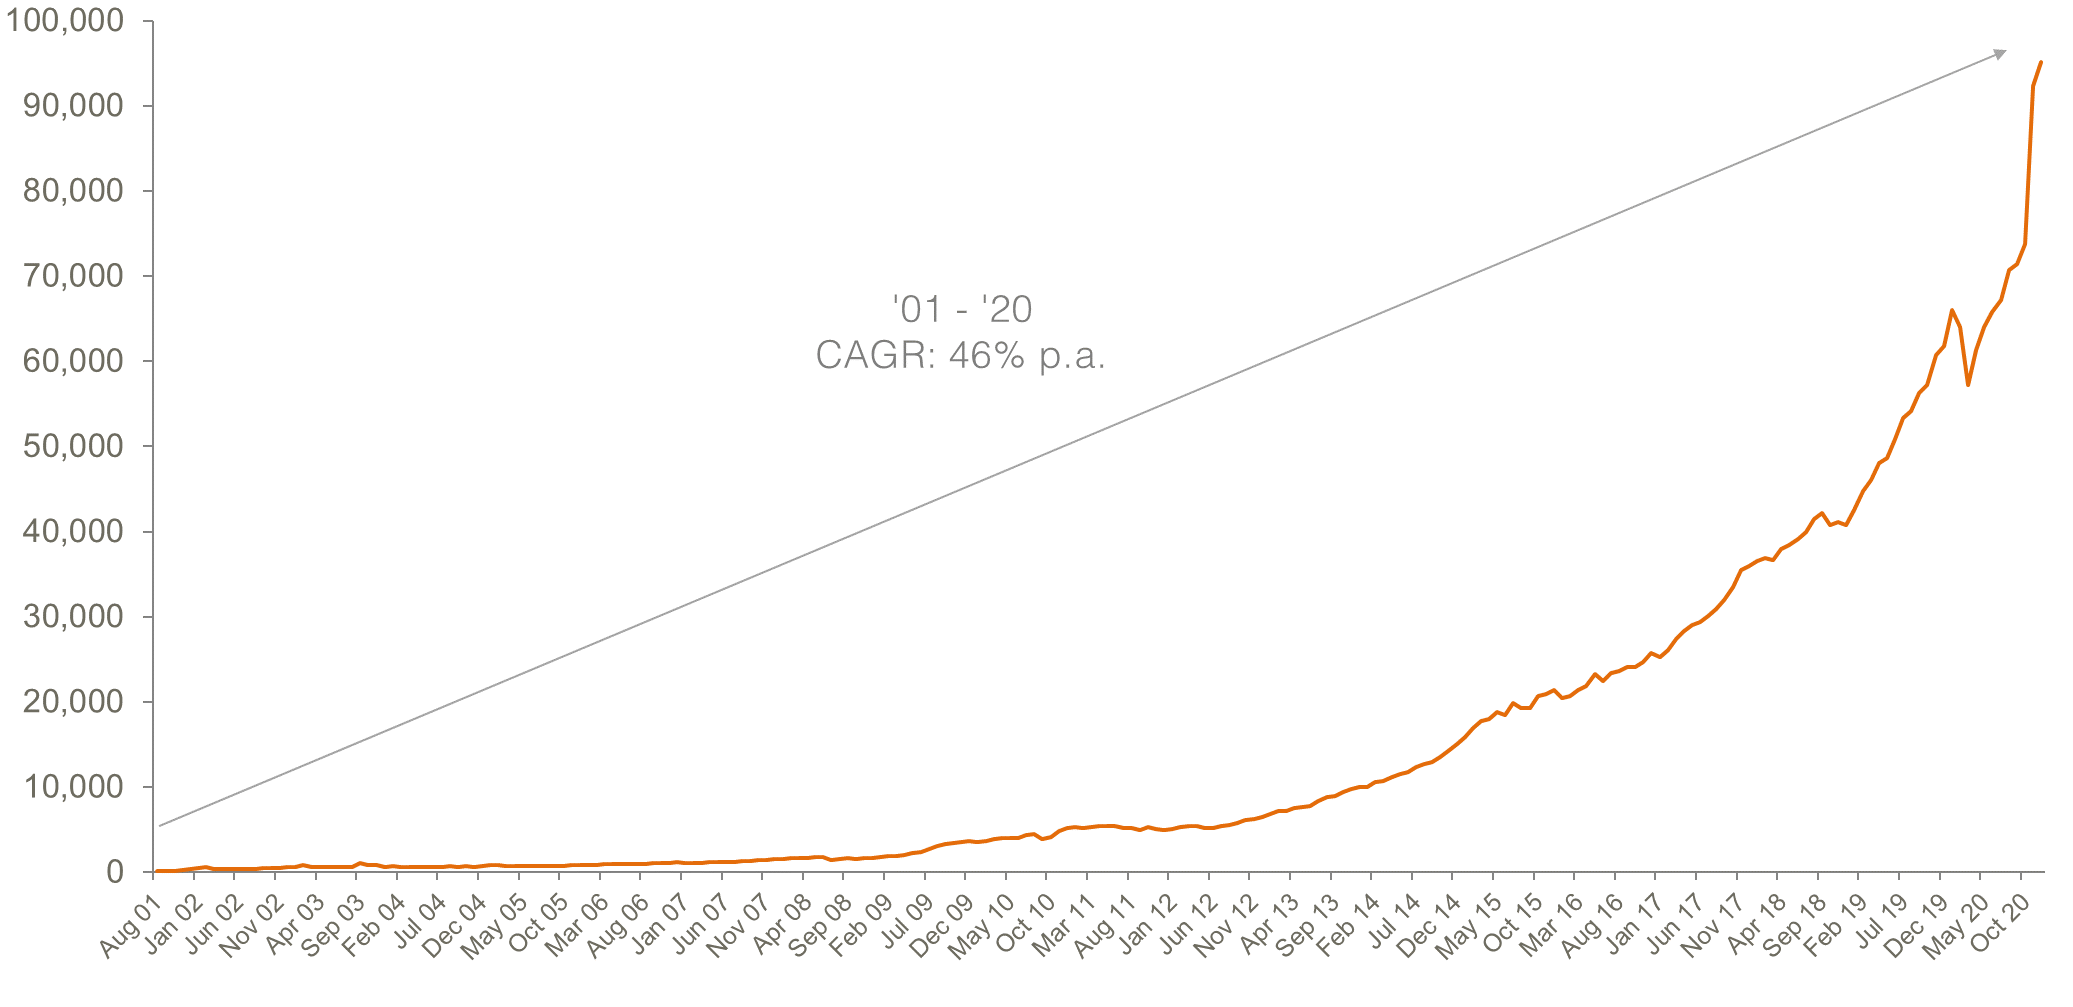
Australian ETP Market Cap: July 2001 – December 2020
Market cap
- Australian Exchange Traded Product Market Cap: $95.2 billoin(1) – new all-time high
- Market cap growth for year: 54%(2) +33.3 billion – the largest absolute 12-month dollar growth on record
Comment: The change in total industry size for the year was $33 billion which is by far the highest annual change on record.
New money
- Net new money (units outstanding by % value): +$20.5 billion – all-time highest annual flows on record
Comment: Perhaps the most striking feature of the industry’s growth in 2020 is that it was entirely driven by net inflows rather than asset value appreciation, with $20.5 billion of new money flowing into the industry over the course of the year. This represents far and away the highest annual inflows on record and a 59% increase in flows from the previous year’s figure. Our internal analysis also indicates that a higher proportion of these flows than ever came from direct individual investors, with hundreds and thousands of new, often young investors entering the share market for the first time via ETFs in 2020.
Issuer Flows
- The Top 2 issuers by net flow (Vanguard and BetaShares) received >50% of the total industry flow for the year
- BetaShares and Vanguard also become the first ETF issuers to receive inflows exceeding $5B in a year
Products
- 256 Exchange Traded Products trading on the ASX (vs 258 as at end 2019)
- New products: 38 new products launched in the year (vs. 24 in 2019), 40 products closed/matured – the highest number of products closed on record.
Comment: In terms of product launches, we saw product development activity pick up significantly compared to the year before. Over the course of 2020, 38 funds were launched. Notably, however, ‘net product growth’ was negative for the first time (-2) with a record number of products closing/maturing over the course of 2020, including 2 ETF issuers leaving the market (UBS and Pinnacle). We view the stabilisation in the number of total products trading to be a normal part of the maturation of the industry but do expect new product activity to continue unabated in 2021.
Trading value
- ASX ETF trading value increased 97% from 2019 – all-time record trading year for ETFs – ~$100B traded on ASX (vs. $50 bilion as the previous record).
Comment: The industry broke essentially all other records in addition to those described above, with ETF trading activity levels reaching a fresh record high, trading value doubling from 2019, and approximately $100B of value traded.
Performance
Technology exposures overwhelmingly recorded the best performance over the calendar year, including battery technology, Asian Technology, Robotics & A.I. and Global Cybersecurity.
Comment: The top 5 products for performance were all technology-oriented exposures, with this sector performing particularly well in the pandemic environment. In the BetaShares stable, ASIA was a real standout, not only from a performance perspective (60% return for the calendar year)** but for flows as well, with the product receiving over $300m of net new money.
Analysis of inflows
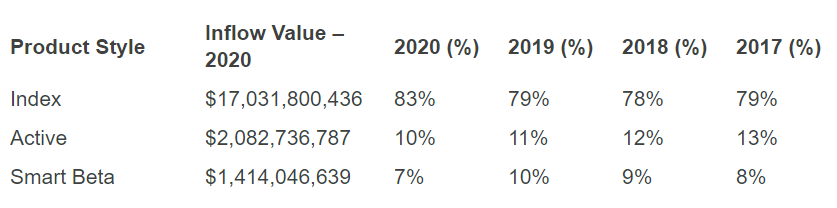
Comment: By inflows, passive products (Index + Smart Beta) captured the bulk of flows with 90% share, with the Active ETF sector retaining approximately the same proportion of flows as 2019 – 10%^. Within the passive category, vanilla index-tracking funds once again dominated, and indeed their share of flows grew vs. previous years (83% of flows in 2020 v. 79% of flows in 2019). That said, with the likelihood of significantly more launches of Active ETFs in 2020, we expect their share of flows to grow steadily over the coming years, particularly if more managers opt for conversions of existing mutual funds into open-ended structures.
Top 5 category inflows (by $) – 2020
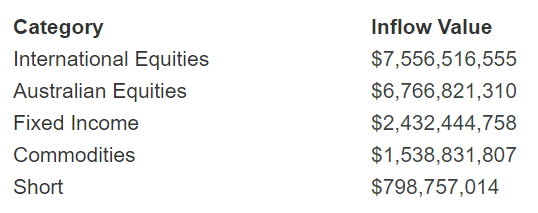
Comment: Compared to 2019, flows reverted heavily back to equities products in 2020, across both international and Australian exposures. By comparison, fixed income flows were muted by the ultra-low yield environment and investors’ return expectations of the fixed income asset class.
- International Equities received the highest level of flows at ~$7.6B
- Australian Equities also had a strong year for flows, with ~$6.8B received.
- We saw a surge in demand for Gold exposures as well as Short products which became the 5th most ‘bought’ category in the industry in 2020.
Top category outflows (by $) – 2020
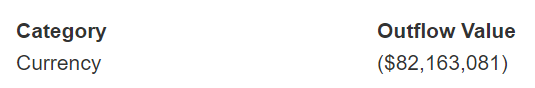
Comment: Outflows were limited, with only one broad category receiving net outflows – US Currency ETFs.
Top sub-category inflows (by $) – 2020
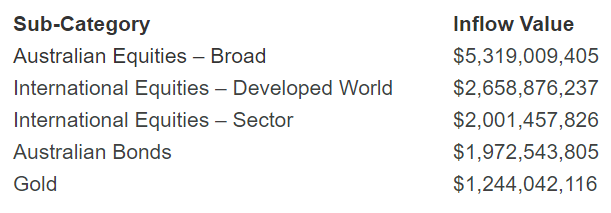
Comment: Outflows were limited, with only very small net outflows in geared Australian equities as investors took profits, as well as US dollar exposures.
In our year-end report for 2019, I wrote “We believe the industry will continue to grow strongly in 2020, but feel that another year of 50%+ growth is unlikely”, leading me to forecast total FUM of $72-$78B for year-end 2020. Excluding the unlisted fund conversion, the industry ended up over the top end of this range ($82B). The unlisted fund conversion created a new higher baseline FuM level for the industry going forward.
Given continued adoption by all client segments (direct individual investors, financial advisers and institutions), we believe the industry will continue to grow strongly in 2021, and forecast total industry FuM at end 2021 to be in the range of $110-$120B. We expect that the industry will break the $100B milestone by the end of the first quarter.
Learn more
ETFs are one of the fastest-growing investment vehicles in the Australian market. For BetaShares latest insights please visit our website and make sure you click follow below.
Footnotes
(1). Includes total FuM for ETFs trading on both ASX and Chi-X
(2). Excluding MGOC conversion, the market cap growth for the year was 32%.
* In November 2020, Magellan’s Global Fund was converted into an “Open Class” structure (which permits applications and redemptions both on and off-market). As a result of this change, the entire $13.5B of FUM in that strategy has been ‘ported’ across to the ETF industry data. We’ve included the converted fund for FUM purposes in this review but, given it’s a structural change and not a net flow, have excluded from the flow figures.
** Past performance is not indicative of future performance.
^ “Passive” products defined as passive/rules-based products (i.e. rather than as legally defined by ASIC/ASX) and include products with an element of investment discretion. “Active” defined as Active ETFs.
Never miss an update
Enjoy this wire? Hit the ‘like’ button to let us know.
Stay up to date with my current content by
following me below and you’ll be notified every time I post a wire
Ilan was a founding team member of BetaShares and is responsible for corporate & product strategy. Previously, Ilan worked for The Boston Consulting Group (BCG), one of the leading global strategy consulting firms.

1 topic
3 stocks mentioned
1 contributor mentioned

Ilan was a founding team member of BetaShares and is responsible for corporate & product strategy. Previously, Ilan worked for The Boston Consulting Group (BCG), one of the leading global strategy consulting firms.
Expertise
Ilan was a founding team member of BetaShares and is responsible for corporate & product strategy. Previously, Ilan worked for The Boston Consulting Group (BCG), one of the leading global strategy consulting firms.
Expertise
Comments
Comments
Sign In or Join Free to comment