(Credit) advantage Australia
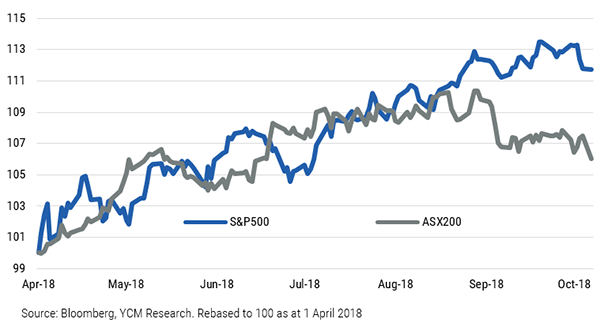
Much has been written about the recent divergence of the Australian and US markets, with pro-cyclical fiscal policy (i.e. Trump’s tax cuts) the major driver behind both the booming US economy and the S&P’s recent outperformance (refer chart 1).
Chart 1: S&P500 vs. ASX200 Index
While it can sometimes be difficult to make direct comparisons, current credit market data paints a more favourable picture for Australian investors, with clear deviations in key metrics helping to preserve both Australian credit quality and – critically – risk-adjusted returns. In particular:
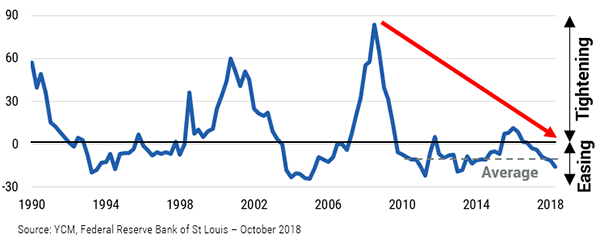
1. US lending standards have slackened
Lending standards have progressively loosened in the US for close to a decade. Put another way, those US borrowers at high risk of default have rarely had easier access to finance (refer chart 2).
Chart 2: % of US Banks Tightening Lending Standards
In Australia it’s a much different story: a tightening regulatory environment has seen local banks reduce exposures to riskier assets. Corporate and commercial property exposures peaked at ~40% of total loans in 2007 and have declined to ~34% today, and the Financial Services Royal Commission will – at the very least – maintain a tightening bias to lending standards.
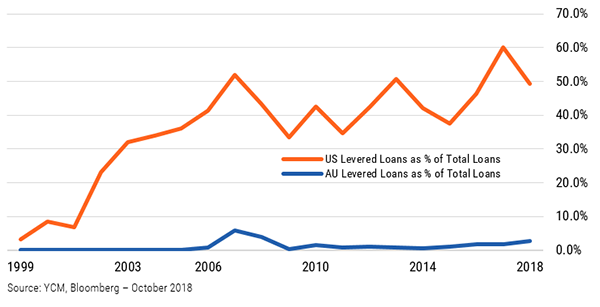
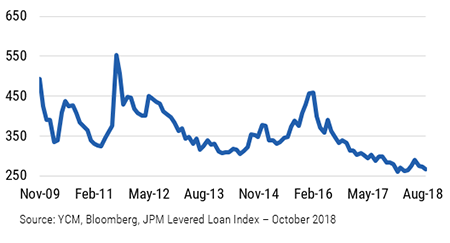
2. Levered loan issuance is high
Levered loans are an important consideration since they mainly comprise loans to parties with high existing debt or poor credit histories (i.e. those with a much higher default risk).
Levered loan issuance as a proportion of total US loans recently exceeded the previous peak (2007) and remains ~15 times higher since 2000. Australia, by contrast, has a much lower proportion of levered loan issuance and today sits at roughly half its previous peak (also 2007) (refer chart 3).
Chart 3: US and AU Levered Loan Issuance
3. US loan margins have shrunk and defaults remain elevated
While US loan margins have declined substantially – weighing on investor returns – they have hardly moved in Australia, a product of tighter lending standards and fewer institutional alternatives (refer charts 4 and 5).
Chart 4: Australian Bank Lending Margins (bps)
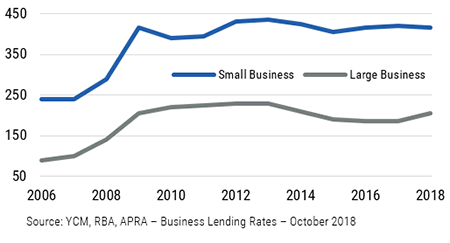
Chart 5: Australian Bank Lending Margins (bps)
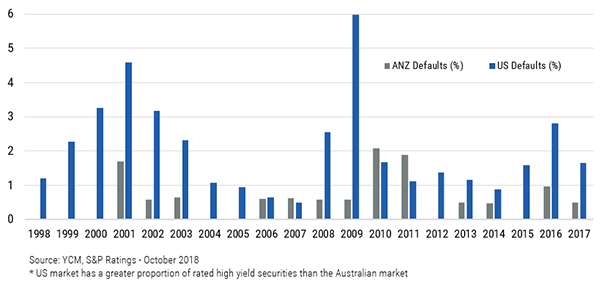
Default histories are also a concern; US defaults are 3-times those of Australia over the past 20 years (refer chart 6). With US rates rising, this trend is unlikely to reverse anytime soon.
Chart 6: Corporate Defaults (%)*
So what?
With Australia’s credit cycle in some segments significantly lagging the US, taking a multi-sector approach to Australian credit enables access to higher risk-adjusted returns than available in US portfolios offering similar risk characteristics.
In addition to being bullish on the Australian private debt and asset-backed sectors, in the public markets we continue to favour credits including NextDC 2022 bonds (BBSW+~350bps) and the callable 2021 Crown hybrids (BBSW+~300bps).
Never miss an update
Enjoy this wire? Hit the ‘like’ button to let us know.
Stay up to date with my current content by
following me below and you’ll be notified every time I post a wire
Phil is the lead portfolio manager for Yarra Capital Management’s Higher Income Strategy. A credit specialist, Phil has more than 20 years experience in financial markets across asset management and institutional banking.


Phil is the lead portfolio manager for Yarra Capital Management’s Higher Income Strategy. A credit specialist, Phil has more than 20 years experience in financial markets across asset management and institutional banking.
Expertise
Phil is the lead portfolio manager for Yarra Capital Management’s Higher Income Strategy. A credit specialist, Phil has more than 20 years experience in financial markets across asset management and institutional banking.
Expertise
Comments
Comments
Sign In or Join Free to comment