Dotcom on steroids
Decelerating revenue growth, collapsing free cash flow, and increasing competition. Is the tech bubble about to pop?
Since the 2008 financial crisis, the US technology sector has been the standout investment trade, defying the concerns of value investors over steep valuations. While many initially underestimated the business quality, growth runway, and long-term earnings power of big tech, these companies—led by visionary founders—evolved into monopolistic giants, delivering fast growth and robust profit margins. In a growth-starved, zero-interest-rate world that continuously drove capital toward secular growing compounders, this was the perfect setup for massive outperformance.
Today, we believe the sector stands at a significant inflection point, with investors seemingly making a one-way bet on the AI mania while appearing to ignore alarming fundamental issues. In our view, the momentum in these growth-oriented segments of the market—including big tech and companies tied to the AI infrastructure buildout—could reverse at any moment. As a result, we have adopted a much more cautious stance toward these investments. We anticipate the next few years for the sector will be defined by deteriorating fundamentals: lower growth, higher competition, and greater capital intensity.
We are not perma-bears on the technology sector; in fact, we were comparatively larger buyers of Nvidia (NASDAQ: NVDA) in 2023, and the stock has been among the top performers since the firm’s June 2016 inception.(1) Clients regularly pushed back on our historical overweight position in the technology sector just a few years ago.
However, our views on the sector have since shifted. Given our goal of capital preservation during downturns and our natural inclination to forgo some upside possibilities in favor of maximizing potential long-term compounding, we would be remiss if we did not raise the question:
How much of your net worth do you want invested in a cyclical sector where many of the largest players appear to be exhibiting growth deceleration, free cash flow margin deterioration, and increasing competition?
This may be worse than the DOTCOM

It may be hard for investors to face the uncomfortable reality that the trade that worked for over a decade may be over. After all, most money managers today do not carry the scars of the dotcom era. Of the approximately 1,700 active large-cap US portfolio managers, just 4% invested through that period.(2) There is a difference between living through a downturn and merely reading about it.
Even the best companies can falter when valuations are stretched and expectations appear exuberant. During the dotcom crash, Microsoft (NASDAQ: MSFT) and Cisco (NASDAQ: CSCO) lost a third of their value in a matter of a week, and Amazon (NASDAQ: AMZN) shed nearly 80% percent of its value over 12 months.(3)
Earnings revisions also tend to be a trailing indicator. For example, in December 2000, several quarters after the peak, analysts were still forecasting nearly 9% earnings growth for 2001. Many leading companies, like Microsoft, continued to grow enviably well in the years following the bubble’s burst. This brings to mind Howard Marks’s view that there are no bad assets, only bad prices. Today feels like an era where bad prices are rampant.
We believe big tech exhibits backward-looking quality
GQG’s investment philosophy is grounded on the idea of “Forward-Looking Quality.” For the first time in our firm’s history, we believe many large technology companies today—particularly those with meaningful roles in the AI infrastructure build-out—represent backward-looking quality.
For much of the last 15 years, investors who compared the exuberant periods in the technology sector to the dotcom era have been repeatedly proven wrong. Is it different this time? We believe so.
In our view, the consequences of the current AI boom could be worse than those of the dotcom era, as its scale—relative to the economy and the market—is far greater.(4,5) Even the AI poster child, Sam Altman, recently admitted we are in an AI bubble, stating: “When bubbles happen, smart people get overexcited about a kernel of truth. Are we in a phase where investors as a whole are overexcited about AI? My opinion is yes.”(6)
Dotcom and today: The similarities
The prior tech bull market was underpinned by two core beliefs, both of which are held today, in our opinion.
1. US Exceptionalism
Both the dotcom bubble and today’s AI boom have been fueled by the belief in American economic dominance. In 1999, the US economy was experiencing 5% GDP growth, deregulation, and a booming stock market while other major economies struggled to keep pace. Emerging markets collapsed during the Asian financial crisis, Mexican tequila crisis, and Russian default. Meanwhile, developed markets like Japan and Europe faced sluggish growth. The period became known as the “American Age of Affluence.”
A similar narrative today underpins the AI rally, where the “TINA” (there is no alternative) trade has driven significant capital into US equities.

By Paine Webber 22 November 1999
2. Revolutionary Technology
A key element of prior bubbles is often a new, revolutionary technology that excites both institutional and retail investors. Like AI today, the 1990s gave birth to the internet, a technology that would eventually change the world. Given their fast growth and profitability, Microsoft, Dell (NASDAQ: DELL), and Oracle (NASDAQ: ORCL) were perceived as obvious winners in the late 1990s, thereby justifying their high multiples.
IBM’s (NASDAQ: IBM) comments near the peak of the dotcom bubble capture the prevailing sentiment: “The [internet] revolution has arrived. With stunning speed, it has swept all of us into a new kind of economy and a new kind of society. It’s the first question I get from any IBM customer in almost any part of the world: “What must I do to survive and win in this new world?”…It was a tidal wave, sweeping everything before it.”
We believe this sounds like AI today.
Dotcom and today: The differences and the myths
Most investors can easily understand the above two points, but many quickly push back with the following claims to argue that this time will be different:
- Tech companies today are higher-quality businesses compared to 2000
- Tech companies today are cheaper compared to 2000
- The broader US market today is cheaper compared to 2000
We agree this time the outcome could be different—we believe it could be worse than the dotcom collapse. We also think that some are making an ill-advised bet on the AI boom with their clients’ retirement security on the line.
Misperception #1: Tech companies today are much higher quality than they were in the dotcom era
Revenue growth has structurally decelerated
The remaining runway in most technology end markets is an issue, in our view. Once a company becomes the proverbial 800-pound gorilla in its respective sector, sustaining supernormal topline growth tends to be virtually impossible.
How fast can Microsoft or Nvidia grow now that they respectively control approximately 60% of the entire software and semiconductor industry’s profits?
On the current trajectory, we would not be surprised to see long-term revenue growth decelerate to single digits within the next five years. In other words, we believe big tech no longer offers a unique growth profile relative to other sectors. Indeed, a few of these larger spenders like Amazon and Alphabet have been trending in that direction for some time, all the while their capital expenditures as a percentage of sales sets new heights. To be clear, these are names we have owned in the past in a big way—and very well may own in the future when the visibility improves—but at the current juncture we remain cautious.


Source: GQG Partners LLC, Bloomberg. Data for the time period 30 June 2018 through 31 December 2026. Content does not constitute investment advice and no investment decision should be made based on it. Actual results may differ from any projections illustrated above.
AI CapEx Is Tied to Digital Advertising
Most of today’s AI capital expenditures are funded by advertising revenue—the lifeblood of Silicon Valley. Digital advertising now accounts for more than 70% of all advertising, so the penetration-driven growth story could be approaching its final innings. Morgan Stanley expects the US digital ad industry to grow at a 9% compound annual growth rate (CAGR) from 2025 to 2030—less than half of its 20% CAGR between 2014 to 2019.

At these rates, we believe the sector may only grow in line with sleepy sectors—think transmission and distribution utilities or property and casualty insurance—yet with considerably higher risk and cyclicality.
Competition has structurally increased
During the 2010s, we viewed big tech as a collection of monopolies: Amazon dominated e-commerce, and Google (NASDAQ: GOOGL) dominated search. Their only competition came from sleepy incumbents ripe for disruption, such as cable television or brick-and-mortar retailers.
Digital’s Share of Total Advertising Spend
That is no longer the case today. Instead of playing in different sandboxes, big tech has largely converged into the same AI arms race, where they now compete directly against each other.
For example, countless new competitors have entered the digital advertising sector, including Walmart (NASDAQ: WMT), Netflix (NASDAQ: NFLX), and Uber (NASDAQ: UBER). Chinese internet companies have also become fierce global competitors. In fact, ByteDance recently surpassed Meta to become the biggest social network by revenue worldwide.(7)

At the end of the day, ad budgets are finite, and tech companies are increasingly competing against each other—rather than legacy media companies—for incremental growth. Despite massive innovation over the past century, total advertising revenue has remained constant at around 2% of GDP,(8) and we do not believe AI can change this fact. Moreover, there are only 24 hours per day, placing a natural limit on how much each digital platform can monetize users.
Clouds on the horizon
Another great example of the deteriorating competitive landscape is the cloud market, which has been one of the most important growth drivers for several tech giants. This was once a stable three-player market: Microsoft, Amazon, and Alphabet. However, a disruptive fourth player (Oracle) just entered in a big way and is explicitly undercutting peers on pricing by 40%, according to our research.(9) Adding to the shakeup, CoreWeave—a financially constrained fifth player with an arguably more cutting-edge product—has announced its intention to aggressively gain market share through pricing pressure.
Such dynamics have the potential to make life difficult for even the most established players. AWS, for instance, is already showing signs of competitive strain. Its earnings before interest and taxes (EBIT) margins declined by a staggering 7% last quarter, while earnings growth slowed to a pedestrian 9%. That is hardly the picture of robust performance for a stock trading at 30x forward earnings, in our view.(10)
Competition will likely only increase with sovereign cloud players and startups all simultaneously ramping up supply. In fact, China is already experiencing a massive datacenter oversupply, resulting in only 20%-30% utilization rates.11
The cloud market now reminds us of the telecom industry, another highly capital-intensive business. Historically, we have observed that telecom economics typically deteriorate when a fourth player enters the market, particularly if it competes on price. While there are some switching costs with cloud, we do not believe they are insurmountable, as plenty of companies have changed providers in the past. For example, ServiceNow (NASDAQ: NOW) and Salesforce (NASDAQ: CRM) recently signed large deals with Google Cloud, representing a shift away from industry leaders Amazon and Microsoft.(12,13)
It is also unclear how much of the cloud sector’s revenue growth now comes from AI startups, which are typically funded by the same cloud companies. According to one estimate, AI startups spend more than 80% of raised venture capital money on compute resources.(14) If VC funding dries up, a substantial slice of the cloud sector’s incremental spend could be at risk, potentially slowing growth.
This contrasts with the source of the CapEx spent during the telecom era, which came from very profitable, well entrenched regional oligopolies such as AT&T, Verizon (NASDAQ: VZ), and Southwestern Bell, but also names like Deutsche Telekom and China Mobile abroad. In our view, the common narrative of unprofitable start-ups funding growth during that era is just that—a convenient narrative not backed by facts if one examines the sell-side notes from that era. Indeed, we believe today’s CapEx is much more fragile and dependent indirectly on venture capital funding, which has had mediocre returns for a few years now.15 We are not seeing any signs of revenue being generated to keep fueling this spend.
Tech faces substantial disruption risk
In the 2010s, big tech were the disruptors. Today, big tech is the incumbent, while AI is emerging as a highly disruptive force. It is not obvious to us who will be the biggest winners from AI over the next decade.
“Most of the companies anointed as ‘winners’ fairly quickly turned out not to be winners at all…incumbents rarely find a way to adapt their businesses to the new technology that threatens their existence.”
—Alasdair Nairn , Engines That Move Markets
Even in the internet era, the biggest winners only became apparent many years after the bubble burst (e.g. Meta, Google). As a result, we believe investors are not adequately pricing in the risk of disruption. Google’s dominance in search is being challenged by AI advancements like ChatGPT, while software’s once-sticky dynamics are facing erosion, as seen in Adobe’s sharp de-rating from 50x to 15x earnings per share (EPS) despite robust earnings growth. These shifts highlight how quickly market narratives can unravel.

Source: GQG Partners LLC, Bloomberg. Data from 21 August 2020 to 22 August 2025. NTM: Next Twelve Months. For illustrative purposes only. Content does not constitute investment advice and no investment decision should be made based on it. PAST PERFORMANCE MAY NOT BE INDICATIVE OF FUTURE RESULTS.
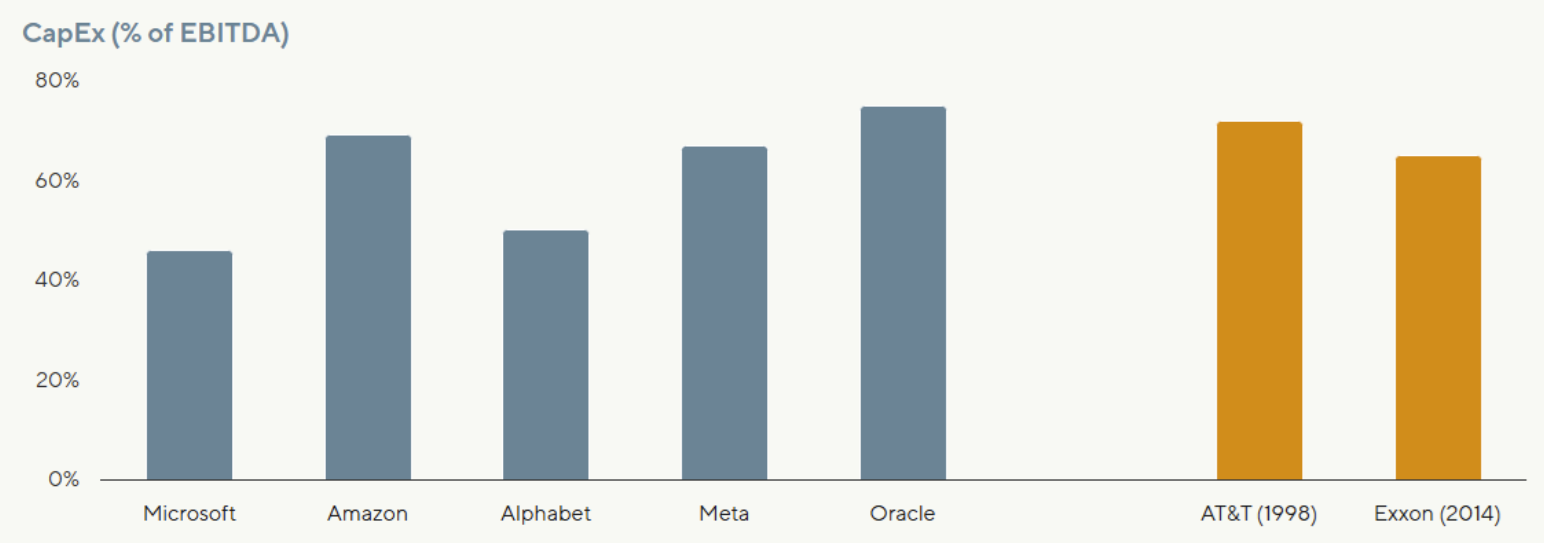
Capital intensity has structurally increased
The third pillar of the big tech thesis during the 2010s was hyper scalability. Unlike most industries, big tech grew rapidly without requiring much incremental investment, allowing them to generate substantial free cash flow. For example, Google raised up to $50 million from inception through its IPO—a figure that would be unimaginable today. Similarly, Meta essentially required no incremental investment for each new subscriber. This argument no longer holds true in the AI era.
Big tech CapEx as percentage of EBITDA is now running at 50%-70%, which is similar to AT&T’s 72% at the peak of the 2000 telecom bubble and Exxon’s 65% at the peak of the 2014 energy bubble.
Historically, companies experiencing higher capital intensity tend to be structurally poor investments. In other words, AI CapEx has already caught up to prior bubble levels, even after adjusting for big tech’s initial high margins.
In both the telecom and energy bubbles, an exciting new technology (internet for telecom, shale for energy) justified unprecedented levels of investment. Eventually, supply outstripped demand, and the companies never earned a return on their investment, as discussed in our GQG Research Software is the New Shale.15 However, customers benefited massively from cheap internet and energy.

We believe that a similar scenario could unfold with AI over the longer run, but in the short and medium term, the signs are questionable. ChatGPT launched nearly three years ago, yet revenues for the “AI Natives”, estimated to be less than US$20 billion today(16), still pales relative to the approximately US$7 trillion datacenter CapEx expected by 2030. Many potential monetization angles, such as AI smartphones, have ended up being flops thus far.
Cisco 1999 Annual Report
A recent study by the University of Texas found that in 1998 alone, the internet economy in the United States generated more than $300 billion in revenue and was responsible for more than 1.2 million jobs. In just five years since the introduction of the World Wide Web, the internet economy already rivals the size of century-old sectors such as energy, automotive, and telecommunications.
In our view, this is far worse than the internet bubble, which at least generated meaningful revenue. We believe today’s intensive AI CapEx may structurally reduce returns on capital for the entire sector. Indeed, this is exactly what happened to the telecom sector during the 1990s fiber rollout. Contrary to popular perception, telecom used to be a highly profitable sector made up of regional monopolies up until the mid-1990s.

Only three players controlled the long-distance and international telecom market, with AT&T leading the pack at 60% market share. To quote one analyst, “For a long time, the prices and margins for international telecommunications were better than the drug trade…because of competition, those margins are falling and have almost disappeared.”(18) According to a 1999 research report, Vodafone—the largest European telecom company at the time—had an “unmatched portfolio of wireless assets and is positioned for rapid subscriber and EBITDA growth” and that the “scale and geographic scope of Vodafone’s assets are almost impossible to replicate.”19 However, the combination of massive CapEx and increased competition permanently impaired the sector’s economics by the late 1990s.
We think the fatal flaw was adopting a “if you build it, they will come” strategy, where telecom providers assumed new applications would get developed to take advantage of the excess bandwidth. In the end, the killer internet apps eventually popped up years later, but by then, it was already too late for the telecom sector.
We believe that today’s surge of datacenter CapEx and cash-burning AI startups could end similarly to the telecom bloodbath from 25 years ago.
To date, big tech has been able to mitigate the impact of massive CapEx spending on their earnings by repeatedly extending the depreciation periods for their investments. We believe that current depreciation numbers are grossly understated as the hyperscalers need to keep buying the latest Nvidia GPU models, which are released annually, to stay competitive.
In today’s AI arms race, any company that does not buy the latest generation of technology may quickly be at a disadvantage. This is why companies like Oracle are now spending more than 100% of their operating cash flow on CapEx. Once reality sets in, investors may find that earnings are massively inflated due to much higher depreciation.

We may already be starting to see early signs of that. For example, Amazon quietly reduced its useful life for its assets this past quarter due to the “increased pace of technology development, particularly in the area of artificial intelligence and machine learning.”(20)
Misperception #2: Tech companies today are cheaper compared to 2000
We believe simply looking at multiples can be misleading. On a growth-adjusted basis, we found that technology companies today are already more expensive than the companies of the dotcom era. As discussed above, we believe today’s tech prospects are largely deteriorating, and this also does not account for the exuberance on the private side.
For example, an AI startup, Thinking Machines (Founded by the former OpenAI CTO), recently raised US$2 billion at a US$12 billion valuation despite lacking a business model—let alone revenue or profits.21 Similarly, OpenAI is creeping toward a US$500 billion valuation despite only generating US$13 billion revenue while expected to post cash losses in excess of US$8 billion this year.22,23

Source: GQG Partners LLC, Bloomberg. Data from 1994 to 1999. For illustrative purposes only. Content does not constitute investment advice and no investment decision should be made based on it.
In contrast, big tech in the late 1990s was growing rapidly with minimal competition or CapEx requirements. Like today, there were many low-quality businesses (such as Pets.com), but that was not the case for the mega caps of that era. Microsoft is a great example of the sector’s business quality and growth at the time. In our opinion, this was truly Microsoft at its best: a hyper-profitable monopoly growing rapidly without CapEx and still led by its visionary founder, Bill Gates. At the very peak of the bubble, the company traded at 60x next twelve months’ (NTM) EPS but was growing revenue by about 35% annually, which is significantly faster than almost any tech company today.
Microsoft’s current valuation looks cheaper at 35x NTM EPS, but the company will likely only see low-teens revenue growth,24 while facing increasing competition in its most important segment (Azure) and requiring massive CapEx to grow.
A better analogy would be Palantir or ServiceNow. Palantir delivers similar 30%+ revenue growth but trades at 75x NTM revenue (not EPS). Similarly, ServiceNow trades at 50x EPS, but revenue only grows 20%.
As we now know, Microsoft took 15 years to recover to its 2000 valuation levels, as the stock eventually de-rated to a maximum of 10x EPS despite strong earnings growth. We believe the same could happen to many of the high-flying technology companies today.

Source: GQG Partners LLC, Bloomberg. Data as of 25 August 2025. NTM: Next Twelve Month. For illustrative purposes only. Content does not constitute investment advice and no investment decision should be made based on it.
We can also look at Cisco, which created the hardware used to power the internet. This was essentially the Nvidia of the internet era, and it briefly became the world’s largest company at just over US$500billion—equivalent to 5% of US GDP at the time–prior to the bubble’s collapse. (Nvidia is currently valued at 15% of GDP.) The core belief then was that internet traffic would double every 100 days, thus requiring massive purchases from Cisco.
According to a research report published within weeks of the peak: “Cisco continues to argue that the industry will grow at 30-50% in countries with healthy economies. It sees several years of strong growth powered by a growing acceptance of the internet as a crucial tool for business and government…Revenues of $4.35 billion rose 53% over the year-prior number of $2.85 billion: FQ2 marked the eighth quarter of accelerating topline growth.”25
In other words, Cisco’s business was booming, hence why it was viewed as a must-own name and traded at more than 20x NTM revenue at the peak—similar to Nvidia today.
Misperception #3: The broader US market today is cheaper than it was in 2000
The S&P 500 trades at 23x EPS today, compared to 25x at the dotcom peak in 2000. While interest rates were slightly higher back then, earnings growth was significantly faster and were not artificially inflated by massive CapEx stimulus.

The overvaluation of US equities today appears to echo the dotcom bubble in 2000 and extends into sectors like industrials, financials, retail, and healthcare. In industrials, companies linked to the power theme, such as GE Vernova and Constellation Energy (NASDAQ: CEG), have seen unsustainable multiple expansions, in our view. This feels reminiscent of the 1990s euphoria over internet-driven electricity demand, which ultimately collapsed. Today, the biggest US power generation company, Constellation Energy, is already warning investors that markets are being overly bullish on power demand, although few seem to care at the moment.26
In financials, Robinhood’s meteoric rise to a US$100 billion valuation mirrors Charles Schwab’s ascent during the 1990s, when investor enthusiasm drove stocks to sky-high valuations before years of stagnation. In retail, we think high-quality companies like Walmart (NASDAQ: WMT) and Costco (NASDAQ: COST) now trade at massively inflated multiples, paralleling Walmart’s peak valuation during the dotcom bubble. Similarly, healthcare giants Eli Lilly (NASDAQ: LLY) and Novo Nordisk (NASDAQ: NVO), buoyed by the GLP-1 craze, appear to resemble Pfizer’s 1999 peak, which collapsed in the early 2000s.
Across these sectors, history warns that while innovation drives excitement, valuations can eventually revert—and investors may be in for a rude awakening.
Indeed, these examples only begin to scratch the surface in our view: today’s market features a plethora of companies trading at unsubstantiated valuations, which a simple scanning of the top 20 most expensive businesses in the S&P 500 today (on a calendar year 2025 revenue basis) can quickly evidence. Further to this point, if simply looking at the broader representation of such pricey revenue names in the S&P 500, we’re already well past the Dotcom peak, with 35% of the benchmark’s weight driven by such names, versus only 25% then.

Source: GQG Partners LLC, Bloomberg. Data as of 8 September 2025. You cannot invest directly in an index.

Source: GQG Partners LLC, Bloomberg. Data as of 8 September 2025. For illustrative purposes only. Actual results may differ from projections illustrated above. Content does not constitute investment advice and no investment decision should be made based on it. *”Not Meaningful” as expected GAAP earnings per share for CY2025 are negative.
Warning signs ahead
At GQG, we rarely turn cautious purely based on rich valuations. However, the trifecta of rich valuations, increasing macro risk, and—perhaps most importantly—deteriorating company fundamentals is very dangerous. We believe much of today’s market leadership has effectively become indexed to the AI theme, whether it be industrials, independent power producers, semiconductors, or capital market businesses.
It is important to underscore just how much more cyclical this broad theme has become—a fact that we believe many quality growth managers similarly underappreciated in 2022, leading to significant losses. Recall that most AI CapEx is funded by advertising revenue, which is extremely cyclical. In the commodity cycle, investors similarly paid a heavy price for confusing inherently cyclical businesses as secular growers.
To be clear, Nvidia was an unquestionably great company in 2018 and 2022, yet the stock still collapsed around 60% in both cases due to the underlying cyclicality. In many ways, Nvidia and other tech giants today have become this generation’s equivalent of the Nifty Fifty ‘one decision stocks’–companies so dominant that they appear untouchable. However, as we noted in an earlier paper, even the best businesses can lead to poor investment outcomes if bought at inflated prices. We would also remind readers that even the best management teams are notoriously bad at predicting inflection points. For example, Jensen Huang, while undoubtedly an exceptional operator, still led investors into significant drawdowns during the recent semiconductor downcycle, like the cheerleading we saw from John Chambers at Cisco, Jack Welch at General Electric, and Jeff Bezos at Amazon in the late 1990s.27
Bulls will surely argue we are in 1995, not 1999—suggesting more upside ahead—but we disagree for two key reasons. First, retail mania. The resurgence of meme stocks, zero-dated options, and levered ETFs mirrors the late-stage froth of 2021, which signaled the end of the last bull run. Second, valuations. Tech names already trade at 1999-like multiples, unlike the reasonable levels of 1995-1998. Giants like Nvidia, at a US$4.5 trillion market cap, leave little room for outsized growth, in our view.
For reference, the S&P 500 traded at a maximum of 15x NTM EPS in 1995 and only crossed 20x near the end in 1998. On a trailing 12-month basis, the S&P technology subset’s price-to-sales ratio is 10x compared to 4x going into 1999, while its price-to-earnings ratio is 42x versus 46x back then. Moreover, earnings growth tells a sobering tale: at the height of the late 1990s boom, broader market growth was on the order of 18% per annum in the five years leading into 1999. Today, that figure sits closer to 10% despite valuations remaining lofty.
This contrast is even more stark when viewed in the context of the fiscal backdrop. In 1999, the US government was running a budget surplus so substantial that senior Treasury officials were concerned about the possibility of eliminating Treasury issuance altogether. As the NY Fed noted in April 2000, the real prospect of paying back all outstanding debt over the next decade sparked concerns about the potential impact on Treasury market liquidity and its role as the risk-free benchmark.28
In our view, big tech no longer offers the unique growth it once did, yet it trades at lofty 30x-50x free cash flow multiples. Meanwhile, we see exciting opportunities elsewhere with the potential for similar low double-digit returns over a full market cycle at what we believe is a significantly lower level of risk. Today, we see better opportunities outside the tech sector.
So, the question for investors becomes: how much of your retirement would you bet on the AI bubble?
Never miss an update
Enjoy this wire? Hit the ‘like’ button to let us know.
Stay up to date with my current content by
following me below and you’ll be notified every time I post a wire
Founded in 2016, GQG Partners LLC is an investment boutique that manages US $172.4 billion* in global, US, and emerging market equities for institutions, advisors, and individuals worldwide. Headquartered in Fort Lauderdale, Florida, with offices in Abu Dhabi, New York, Seattle, Tacoma, London, and Sydney, we are committed to delivering long-only equity strategies with the goal of compounding capital for our clients. In addition to our public equity strategies, GQG recently launched Private Capital Solutions, a GP stakes investing business focused on strategic solutions for lower middle market private capital asset management firms. GQG Partners is a majority employee-owned company that is listed on the Australian Securities Exchange (ASX:GQG). *As of 30 June 2025. AUM represents both discretionary and non-discretionary assets, and are rounded to the nearest US$100 million. AUM has not been audited and in certain instances reflects the most recently available estimate.
........
1Agnew, Harriet. “AI will create ‘more losers than winners’ even as Nvidia soars”. Financial Times. June 2023.
2Morningstar, GQG analysis.
3Bloomberg database.
4Kedrosky, Paul. “Honey, AI CapEx is Eating the Economy”. paulkedrosky.com. 18 July 2025.
5Arnott, Rob, Commins, Trent, and Liu, Xi. “The AI Boom vs. the Dot-Com Bubble: Have We Seen This Movie Before?” Research Affiliates. March 2025.
6Landymore, Frank. “Sam Altman Says the Quiet Part Out Loud, Believes We’re in an AI Bubble”. Futurism. August 2025.
7Hu, Krystal. “ByteDance surpasses Meta, plus Jensen Huang’s fruitful trip in Beijing”Reuters. 17 July 2025.
8Marto, Ricardo. Le. Hoang. “The Rise of Digital Advertising and Its Economic Implications”. Federal Reserve Bank of St. Louis. 10 October 2024.
9Source: GQG Research .
10Source: AWS 1Q2025 earnings call. Bloomberg.
11Reuters. “China plans network to sell surplus computing power in crackdown on data centre glut”. July 2025.
12Butler, Georgia. “ServiceNow signs $1.2bn contract with Google Cloud – report”. Data Center Dynamics. July 2025.
13Butler, Georgia. “Google Cloud wins $2.5bn contract from Salesforce”. Data Center Dynamics. February 2025.
14Appenzeller, Guido. Bornstein, Matt. Casado, Martin. “Navigating the High Cost of AI Compute”. Andreessen Horowitz. April 2023.
15Walker, Peter, Young PhD, Michael, Dowd, Kevin. “Q1 2025 VC Fund Performance Report.” carta.com. 17 June 2025.
16GQG Research. “Is Software the New Shale?”. GQG. December 2022.
17Efrati, Amir. “AI Native” Apps’ 18.5 Billion Annualized Revenues Rebut MITs Skeptical Study.” The Information. 26 August 2025.
18Borland, John. “Bandwidth glut may threaten profits.” CNET. July 1999.
19Source: Research report from Warburg Dillon Read. July 1999
20Usvyatsky, Olga. “Amazon revises server lifespan amid AI shift, impacting 2025 earnings”. Deep Quarry. February 2025.
21Zeff, Maxwell. “Mira Murati’s Thinking Machines Lab is worth $12B in seed round”. Tech Crunch. July 2025.
22 Hu, Krystal. Tanna, Shivani. “OpenAI eyes $500 billion valuation in potential employee share sale, source says”. Reuters. August 2025.
23 Zitron, Edward. “Why Everybody Is Losing Money On AI”. Where’s Your Ed At? 5 September 2025.
24Source: Bloomberg database.
25Source: RBC Research Report. February 2000.
26Chernikov, Vlad. “Constellation Energy CEO 27Challenges Overstated Data Center Electricity Demand Projections”. ROIC.ai. May 2025.
27September 2018: “We’re expecting the channel inventory to work itself out. We are masters at managing our channel, and we understand the channel very well.” August 2021: “I would expect that we will see a supply constrained environment for the vast majority of next year is my guess at the moment. But a lot of that has to do with the time of our demand is just too great.”
28Fleming, J Michael. “The Benchmark U.S. Treasury Market: Recent Performance and Possible Alternatives”. FRBNY Economic Policy Review. April 2000.
DEFINITIONS
Earnings Per Share (EPS) is a measure of a company’s profitability, calculated by dividing quarterly or annual income (minus dividends) by the number of outstanding stock shares.
Compound Annual Growth Rate (CAGR) is a measure of an investment’s annual growth rate over a period of time.
EBITDA: Earnings Before Interest Taxes Depreciation Amortization.
FCF margin (Free Cash Flow margin) is a financial metric that shows a company’s efficiency in converting revenue into actual cash after covering operational and capital expenditures, calculated by dividing Free Cash Flow by total revenue. A higher FCF margin indicates a stronger ability to generate cash for dividends, debt reduction, or investments.
CapEx (capital expenditure) refers to the funds a company uses to acquire, upgrade, or maintain long-term physical or intangible assets. Unlike operating expenses, which cover daily business costs, CapEx is an investment in assets expected to generate economic benefits for more than one year.
The Price-to-Earnings (P/E) ratio is a stock valuation metric that divides a company’s share price by its earnings per share (EPS), indicating what investors are willing to pay for each dollar of a company’s earnings. A higher P/E suggests investors expect higher future earnings, while a lower P/E may indicate a stock is undervalued or has lower growth potential.
The Price-to-Sales (P/S) ratio is a stock valuation metric that indicates how much investors are willing to pay for each dollar of a company’s sales revenue, calculated by dividing the company’s market capitalization by its total sales over a specific period, often the trailing twelve months (TTM). A lower P/S ratio generally suggests a stock is undervalued, while a higher P/S ratio may indicate overvaluation.
GAAP: Generally Accepted Accounting Principles
IMPORTANT INFORMATION
This document may be distributed by GQG Partners LLC and its affiliates (collectively “GQG”).
The information provided in this document does not constitute investment advice and no investment decision should be made based on it. Neither the information contained in this document or in any accompanying oral presentation is a recommendation to follow any strategy or allocation. In addition, neither is it a recommendation, offer or solicitation to (i) sell or buy any security, (ii) purchase shares in any investment fund that GQG may sponsor, offer or manage, (iii) establish any separately managed account, or (iv) implement any investment advice. It should not be assumed that any investments made or recommended by GQG in the future will be profitable or will equal the performance of any securities discussed herein. Before making any investment decision, you should seek expert, professional advice, including tax advice, and obtain information regarding the legal, fiscal, regulatory and foreign currency requirements for any investment according to the law of your home country, place of residence or current abode.
This document reflects the views of GQG as of a particular time. GQG’s views may change without notice. Any forward-looking statements or forecasts are based on assumptions and actual results may vary.
GQG provides this information for informational purposes only. GQG has gathered the information in good faith from sources it believes to be reliable, including its own resources and third parties. However, GQG does not represent or warrant that any information, including, without limitation, any past performance results and any third-party information provided, is accurate, reliable or complete, and it should not be relied upon as such. GQG has not independently verified any information used or presented that is derived from third parties, which is subject to change. Information on holdings, allocations, and other characteristics is for illustrative purposes only and may not be representative of current or future investments or allocations.
Past performance may not be indicative of future results. Performance may vary substantially from year to year or even from month to month. The value of investments can go down as well as up. Future performance may be lower or higher than the performance presented and may include the possibility of loss of principal. It should not be assumed that investments made in the future will be profitable or will equal the performance of securities listed herein.
The information contained in this document is unaudited. It is published for the assistance of recipients but is not to be relied upon as authoritative and is not to be substituted for the exercise of one’s own judgment. GQG is not required to update the information contained in these materials, unless otherwise required by applicable law. No portion of this document and/or its attachments may be reproduced, quoted or distributed without the prior written consent of GQG.
GQG is registered as an investment adviser with the U.S. Securities and Exchange Commission. Please see GQG’s Form ADV Part 2, which is available upon request, for more information about GQG.
Any account or fund advised by GQG involves significant risks and is appropriate only for those persons who can bear the economic risk of the complete loss of their investment. There is no assurance that any account or fund will achieve its investment objectives. Accounts and funds are subject to price volatility and the value of a portfolio will change as the prices of investments go up or down. Before investing in a strategy, you should consider the risks of the strategy as well as whether the strategy is appropriate based upon your investment objectives and risk tolerance.
There may be additional risks associated with international and emerging markets investing involving foreign, economic, political, monetary, and/or legal factors. International investing is not for everyone. You can lose money by investing in securities.
GQG Partners LLC is a wholly owned subsidiary of GQG Partners Inc., a Delaware corporation that is listed on the Australian Securities Exchange (ASX: GQG). GQG Partners LLC and its affiliates provide certain services to each other.
INFORMATION ABOUT INDEXES
The S&P 500 Index is a float-adjusted market cap weighted equity index of stocks of 500 leading companies in the United States.
The S&P 500® Equal Weight Index (EWI) is the equal-weight version of the widely-used S&P 500. The index includes the same constituents as the capitalization weighted S&P 500, but each company in the S&P 500 EWI is allocated a fixed weight – or 0.2% of the index total at each quarterly rebalance.
You cannot invest directly in indices, which do not take into account trading commissions and costs.
NOTICE TO RECIPIENTS IN AUSTRALIA & NEW ZEALAND INVESTORS
The information in this document is issued and approved by GQG Partners LLC (“GQG”), a limited liability company and authorised representative of GQG Partners (Australia) Pty Ltd, ACN 626 132 572, AFSL number 515673. This information and our services may be provided to wholesale and retail clients (as defined in section 761G of the Corporations Act 2001 (Cth)) domiciled in Australia. This document contains general information only, does not contain any personal advice and does not take into account any prospective investor’s objectives, financial situation or needs. In New Zealand, any offer of a Fund is limited to ‘wholesale investors’ within the meaning of clause 3(2) of Schedule 1 of the Financial Markets Conduct Act 2013. This information is not intended to be distributed or passed on, directly or indirectly, to any other person.
NOTICE TO RECIPIENTS IN CANADA (Alberta, British Columbia, Manitoba, New Brunswick, Nova Scotia, Ontario, Québec, Saskatchewan (the “Canadian Jurisdictions”))
GQG Partners LLC relies on the (i) international adviser exemption pursuant to section 8.26 of NI 31-103 in each of the Canadian Jurisdictions, and (ii) non-resident investment fund manager exemption pursuant to section 4 of MI 32-102 in Ontario and Québec and is not registered as an adviser or investment fund manager in the Canadian Jurisdictions.
This document has been prepared solely for information purposes and is not an offering memorandum or any other kind of an offer to buy or sell or a solicitation of an offer to buy or sell any security, instrument or investment product or to participate in any particular trading strategy. It is not intended and should not be taken as any form of advertising, recommendation, investment advice or invitation to trade. This information is confidential and for the use of the intended recipient only. The distribution of this document in Canada is restricted to recipients who are qualified “permitted clients” for purposes of National Instrument 31-103 Registration Requirements, Exemptions and Ongoing Registrant Obligations. This document may not be reproduced, redistributed or copied in whole or in part for any purpose without the prior written consent of GQG. Upon receipt of this document, each Canadian recipient hereby confirms having expressly requested that all documents evidencing or relating in any way to the information described herein be drawn up in the English language only. Par la réception de ce document, le détenteur au Canada de celui-ci confirme par les présentes avoir expressément exigé que tous les documents faisant foi ou se rapportant de quelque manière que ce soit aux informations présentées dans ce document soient rédigés en anglais seulement.
NOTICE TO RECIPIENTS IN SOUTH AFRICA
GQG PARTNERS LLC is an authorised financial services provider in the Republic of South Africa and regulated by the Financial Sector Conduct Authority (FSCA) with FSP number: 48881. Investors should take cognisance of the fact that there are always risks involved when buying or selling any financial product. Past performance of a financial product is not necessarily indicative of future performance. The value of financial products can increase as well as decrease over time, depending on the value of the underlying securities and prevailing market conditions. The investment value of a financial product is not guaranteed, and any illustrations, forecasts or hypothetical data are provided for illustrative purposes only. This document does not constitute financial advice, a solicitation, invitation or investment recommendation. Prior to selecting a financial product or investment, it is recommended that South African based investors seek and obtain specialised financial, legal and tax advice.
NOTICE TO RECIPIENTS IN THE UNITED KINGDOM
GQG Partners LLC is not an authorised person for the purposes of the Financial Services and Markets Act 2000 of the United Kingdom (“FSMA”) and the distribution of this document in the United Kingdom is restricted by law. Accordingly, this document is provided only for and is directed only at persons in the United Kingdom reasonably believed to be of a kind to whom such promotions may be communicated by a person who is not an authorised person under FSMA pursuant to the FSMA (Financial Promotion) Order 2005 (the “FPO”). Such persons include: (a) persons having professional experience in matters relating to investments; and (b) high net worth bodies corporate, partnerships, unincorporated associations, trusts, etc. falling within Article 49 of the FPO. The services provided by GQG Partners LLC and the investment opportunities described in this document are available only to such persons, and persons of any other description may not rely on the information in it. All, or most, of the rules made under the FSMA for the protection of retail clients will not apply, and compensation under the United Kingdom Financial Services Compensation Scheme will not be available.
GQG Partners (UK) Ltd. is a company registered in England and Wales, registered number 1175684. GQG Partners (UK) Ltd. is an appointed representative of Sapia Partners LLP, which is authorised and regulated by the Financial Conduct Authority (“FCA”) (550103).
NOTICE TO RECIPIENTS IN ADGM
GQG Partners Ltd, a company limited by shares, registered in Abu Dhabi Global Markets (“ADGM”), having its address at Unit 12, 7th Floor, Al Khatem Tower, Al Maryah Island, Abu Dhabi, United Arab Emirates. GQG Partners Ltd is licensed by the ADGM’s Financial Services Regulatory Authority (FSRA) (license number 240015). GQG Partners Limited is licensed by the ADGM’s Financial Services Regulatory Authority (FSRA) to conduct the regulated activities of Managing a Collective Investment Fund, Advising on Investments or Credit, Arranging Deals in Investments, Managing Assets, Shari’a-compliant Regulated Activities. This document is intended for distribution only to persons of a type specified in the FSRA’s Rules (i.e., “Professional Clients”) and must not be delivered to or relied on by any other type of person. It is for the exclusive use of the persons to whom it is addressed and in connection with the subject matter contained therein. The FSRA, or any other regulatory authority, has no responsibility for reviewing or verifying this document or any other document in connection with it. Accordingly, the FSRA, or any other regulatory authority, neither approved this document or any other associated documents nor taken any steps to verify the information set out in this document and has no responsibility for it.
© 2025 GQG Partners LLC. All rights reserved. This document reflects the views of GQG as of September 2025.
-01%20(1).png)
19 stocks mentioned
-01%20(1).png)
Founded in 2016, GQG Partners LLC is an investment boutique that manages US $172.4 billion* in global, US, and emerging market equities for institutions, advisors, and individuals worldwide. Headquartered in Fort Lauderdale, Florida, with offices...
Expertise
Founded in 2016, GQG Partners LLC is an investment boutique that manages US $172.4 billion* in global, US, and emerging market equities for institutions, advisors, and individuals worldwide. Headquartered in Fort Lauderdale, Florida, with offices...
Expertise
Comments
Comments
Sign In or Join Free to comment