How to avoid the equity market disaster zone
Investing in ‘ten-baggers’, much loved by Peter Lynch, is easy to say but hard to do. We prefer to start by avoiding the losers, the bottom 20%. I show in this wire five simple financial ratios that can help you do this, and just how beneficial to performance they can be.
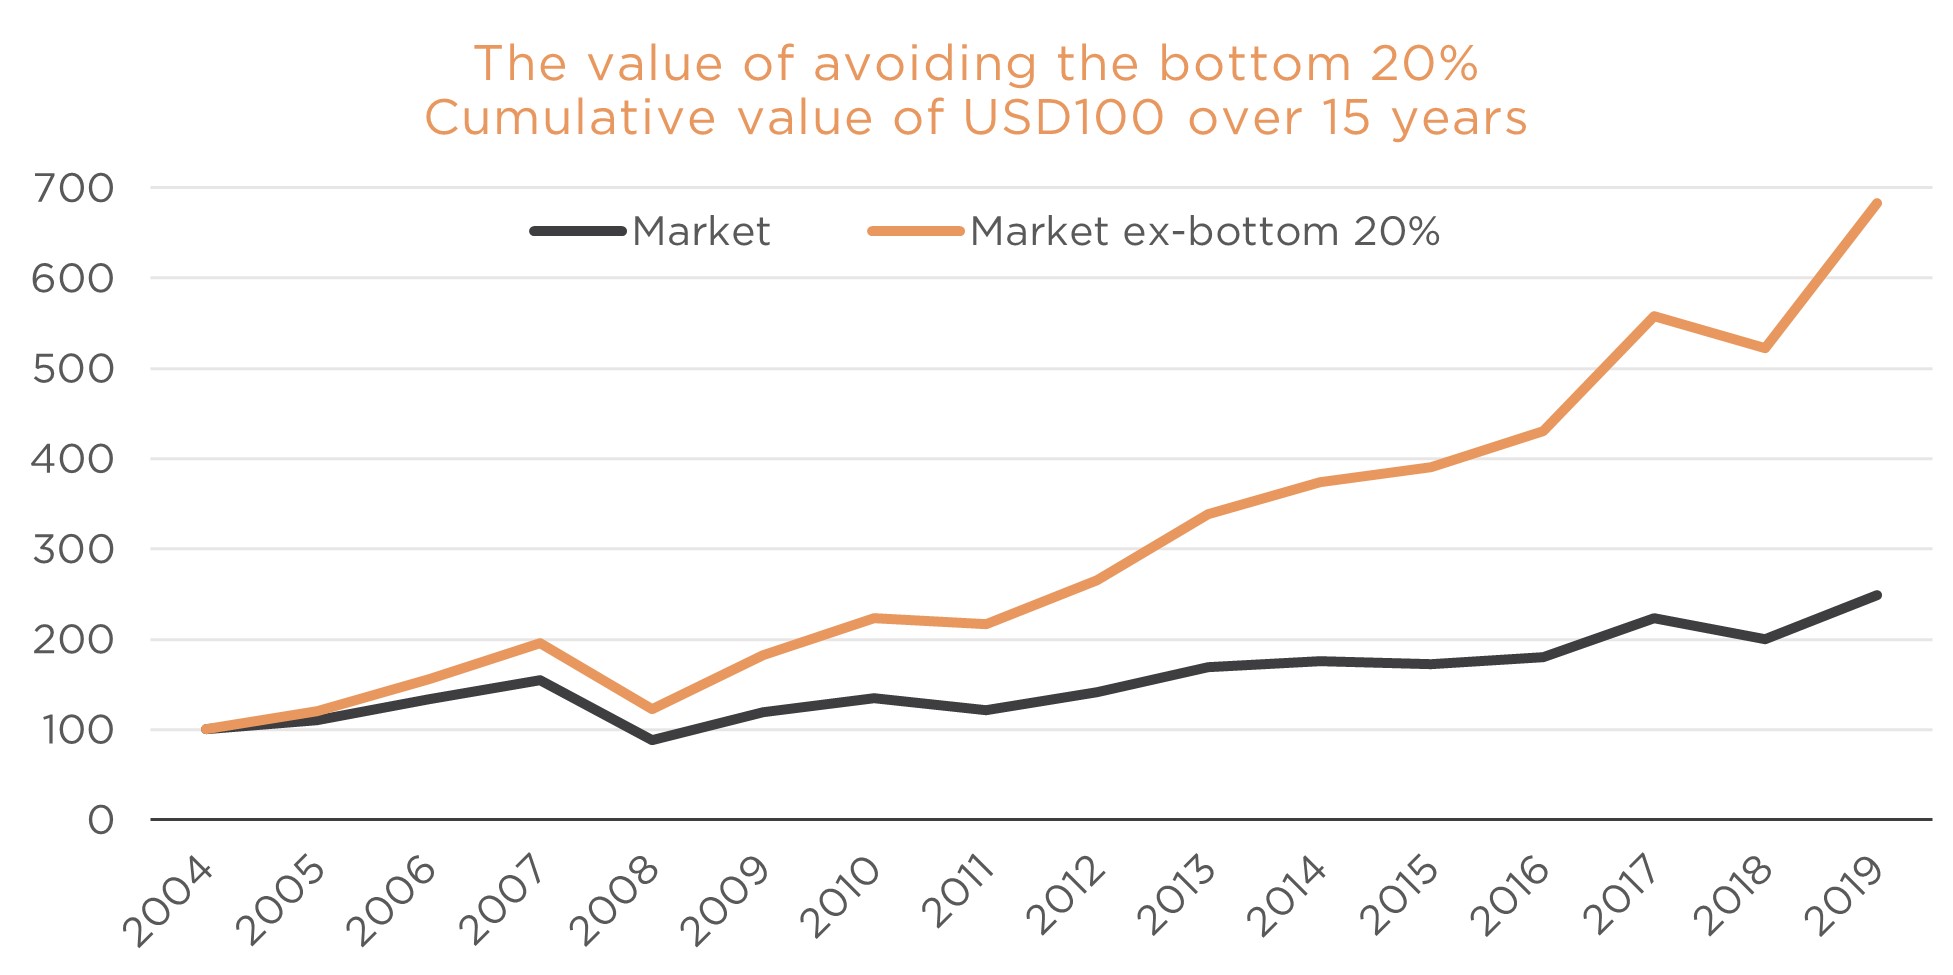
No-one talks at a BBQ about the stock market losers that they didn’t own. Yet, over the last 15 years if you had done nothing other than avoid the worst quintile of the market you would have ranked in the top 5% of all investors. Below I identify five common characteristics to the stocks that end up in the disaster zone, capturing profitability, earnings growth, balance sheet expansion and valuation. One of these characteristics is by far the most impactful, and it will surprise most readers. Note that the analysis below is over the 15 years to 2019 and uses data from a universe of about 6,000 companies with a market capitalisation above US$2bn.
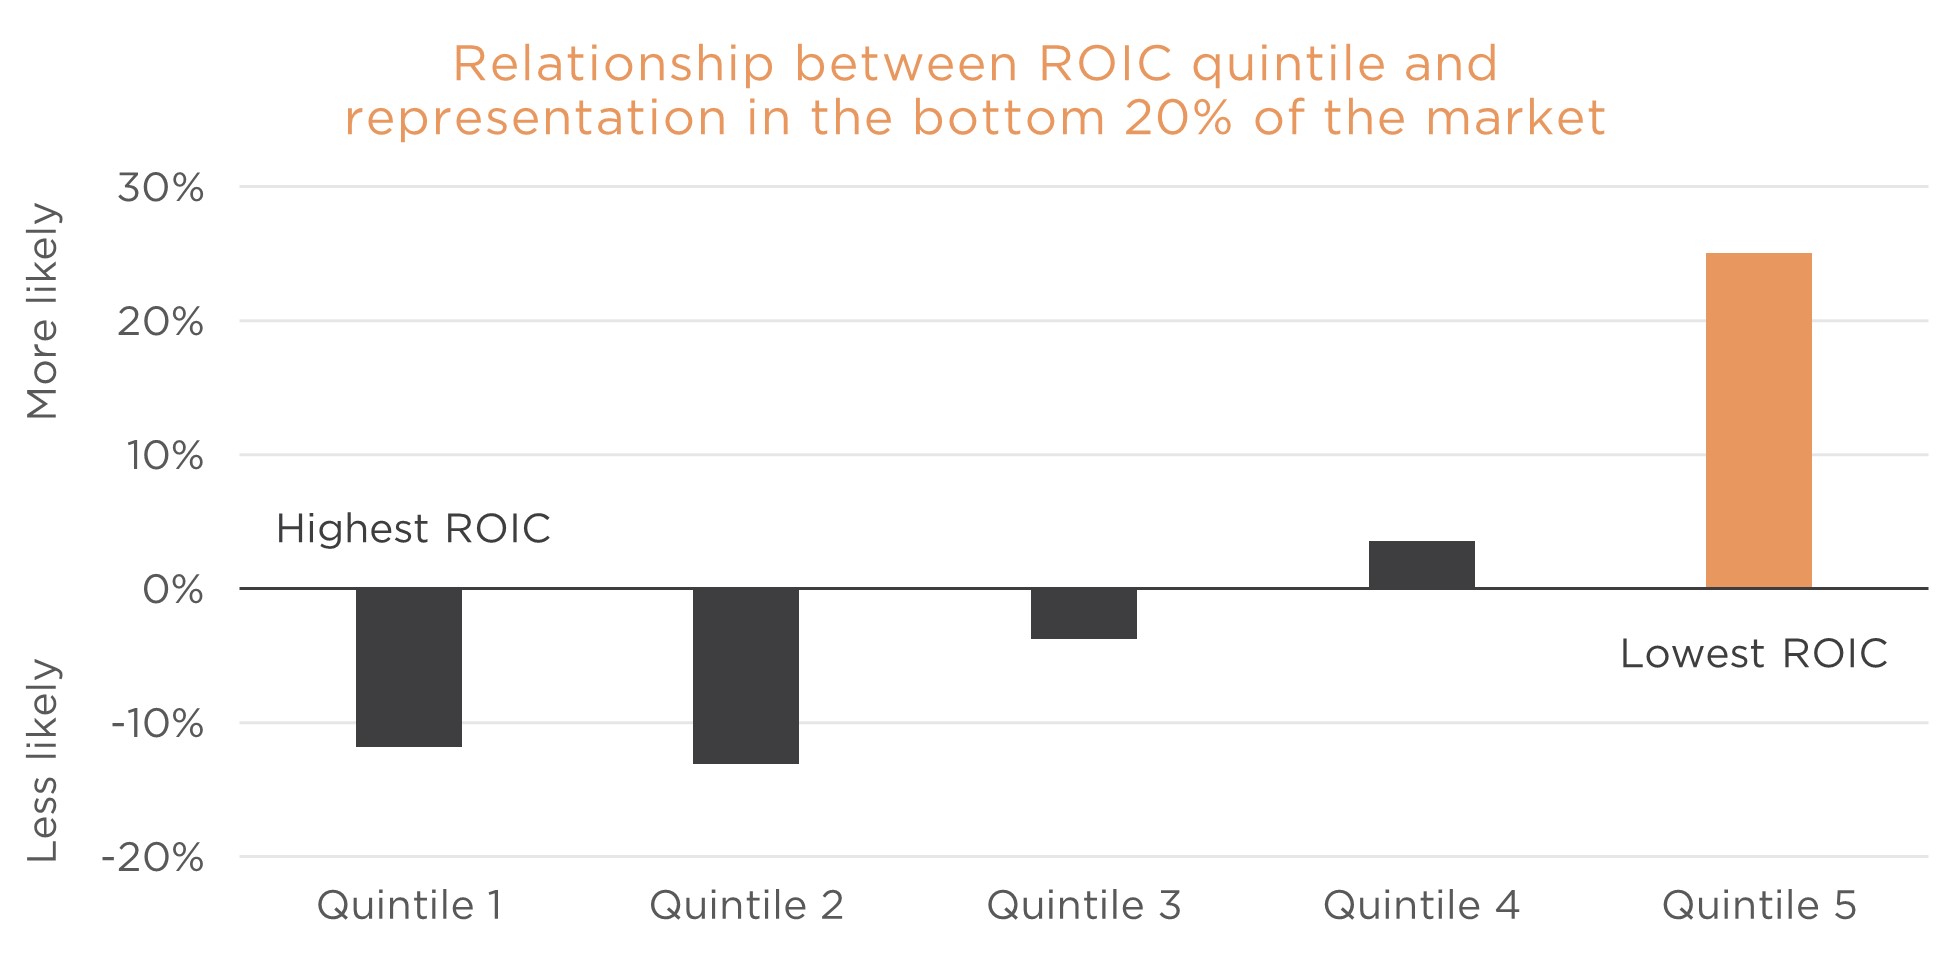
Profitability
The difference that profitability makes to the likelihood that a given company ends up in the disaster zone is stark. The least profitable companies are 25% more likely to be in the bottom quintile by share price performance than a randomly selected one.
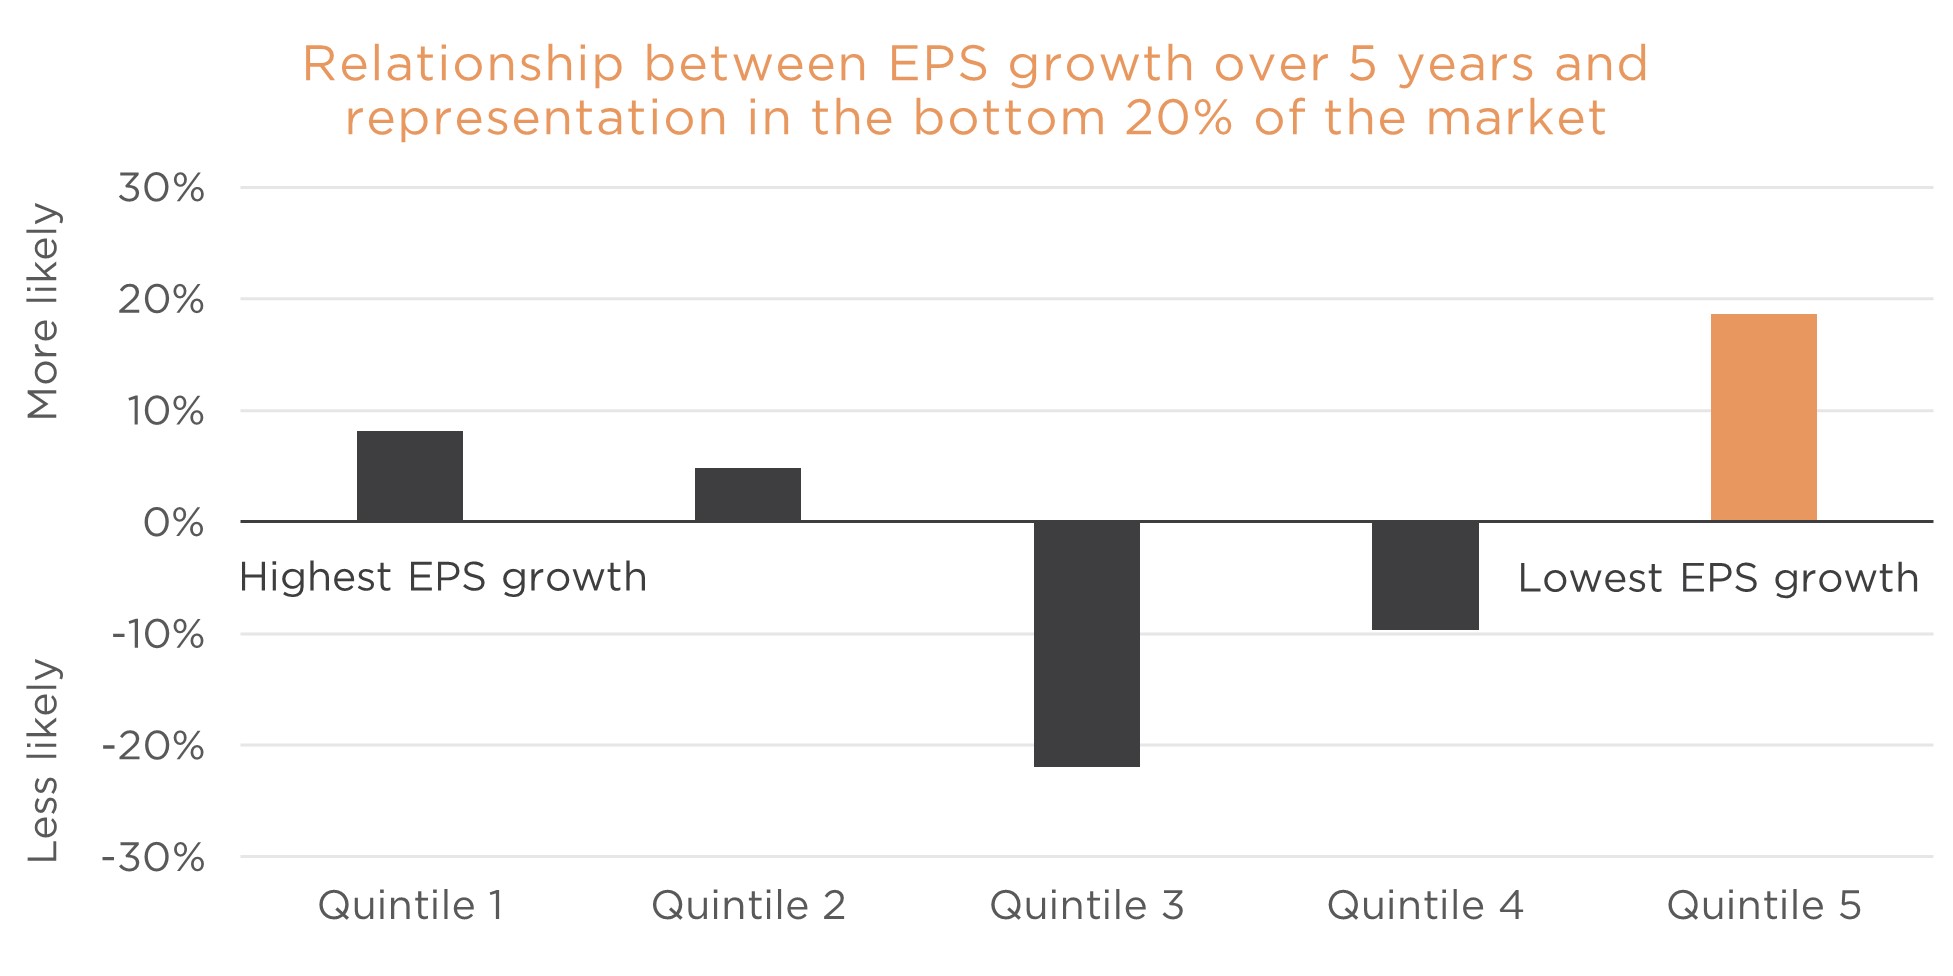
Earnings growth
Companies drawn from the weakest quintile by five-year earnings growth are 19% more likely to be in next year’s bottom quintile than an average company. Interestingly, the group with the highest historical rate of EPS growth also has an above-average likelihood of being in the worst quintile by share price performance. The sweet spot is the moderate growers.
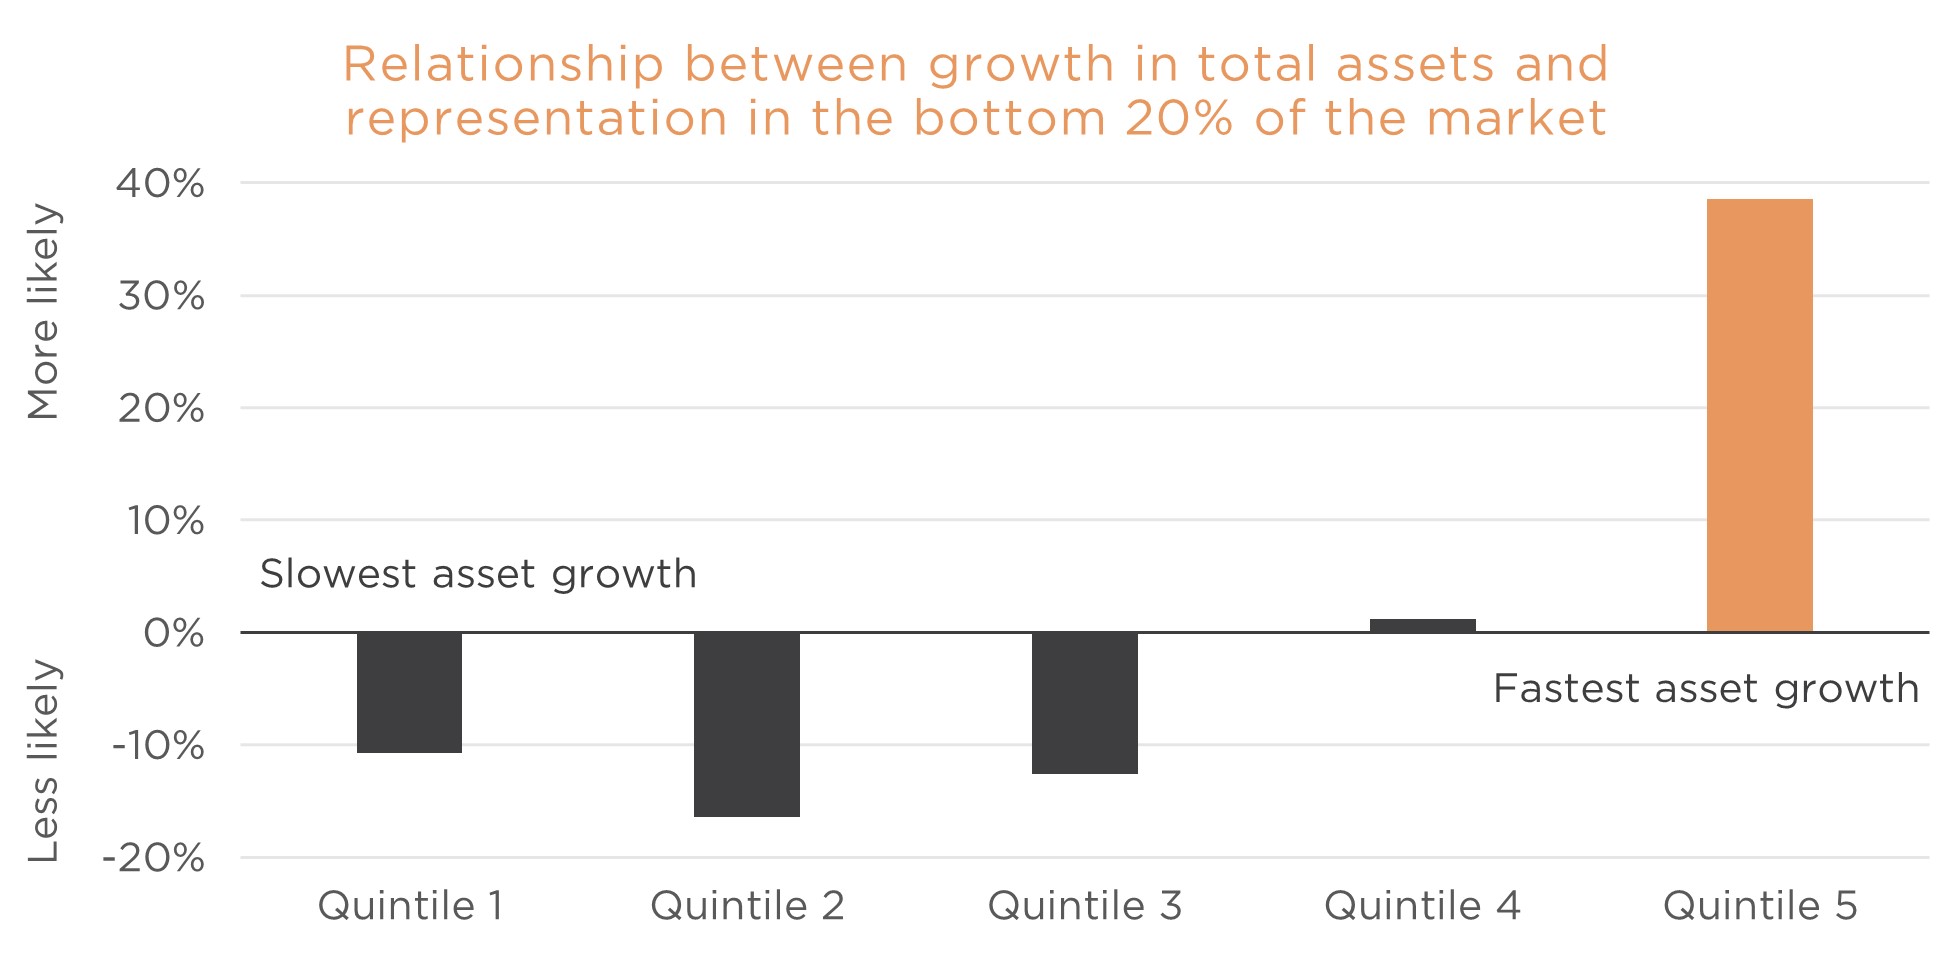
Balance sheet growth
It is well documented that big, transformational acquisitions often end in disappointment for the acquiror. Large acquisitions introduce significant risks in integrating difference cultures, accounting systems and organisational structures. They can take the acquirer well outside their core competency, and the strategic merits, which look compelling in the PowerPoint slides, often prove illusory. Lastly, the larger the deal value, the more likely a significant price premium will be required to have the bid accepted.
We can capture acquisition risk in a company’s balance sheet growth which we can measure two ways. Firstly, through growth in a company’s total assets and secondly, through growth in issued shares as large acquisitions are often paid for through the issuance of new equity. Both variables present a similar picture – rapid balance sheet is expansion is likely to put you in the equity market’s disaster zone.
Valuation
There is a strong relationship between starting PE and the likelihood that a given company ends up in the market’s bottom 20%. That is not surprising. What is perhaps surprising is the direction of the relationship.
Stocks drawn from the lowest PE quintile are dramatically more likely to end up in the bottom quintile by share price performance than an average business.

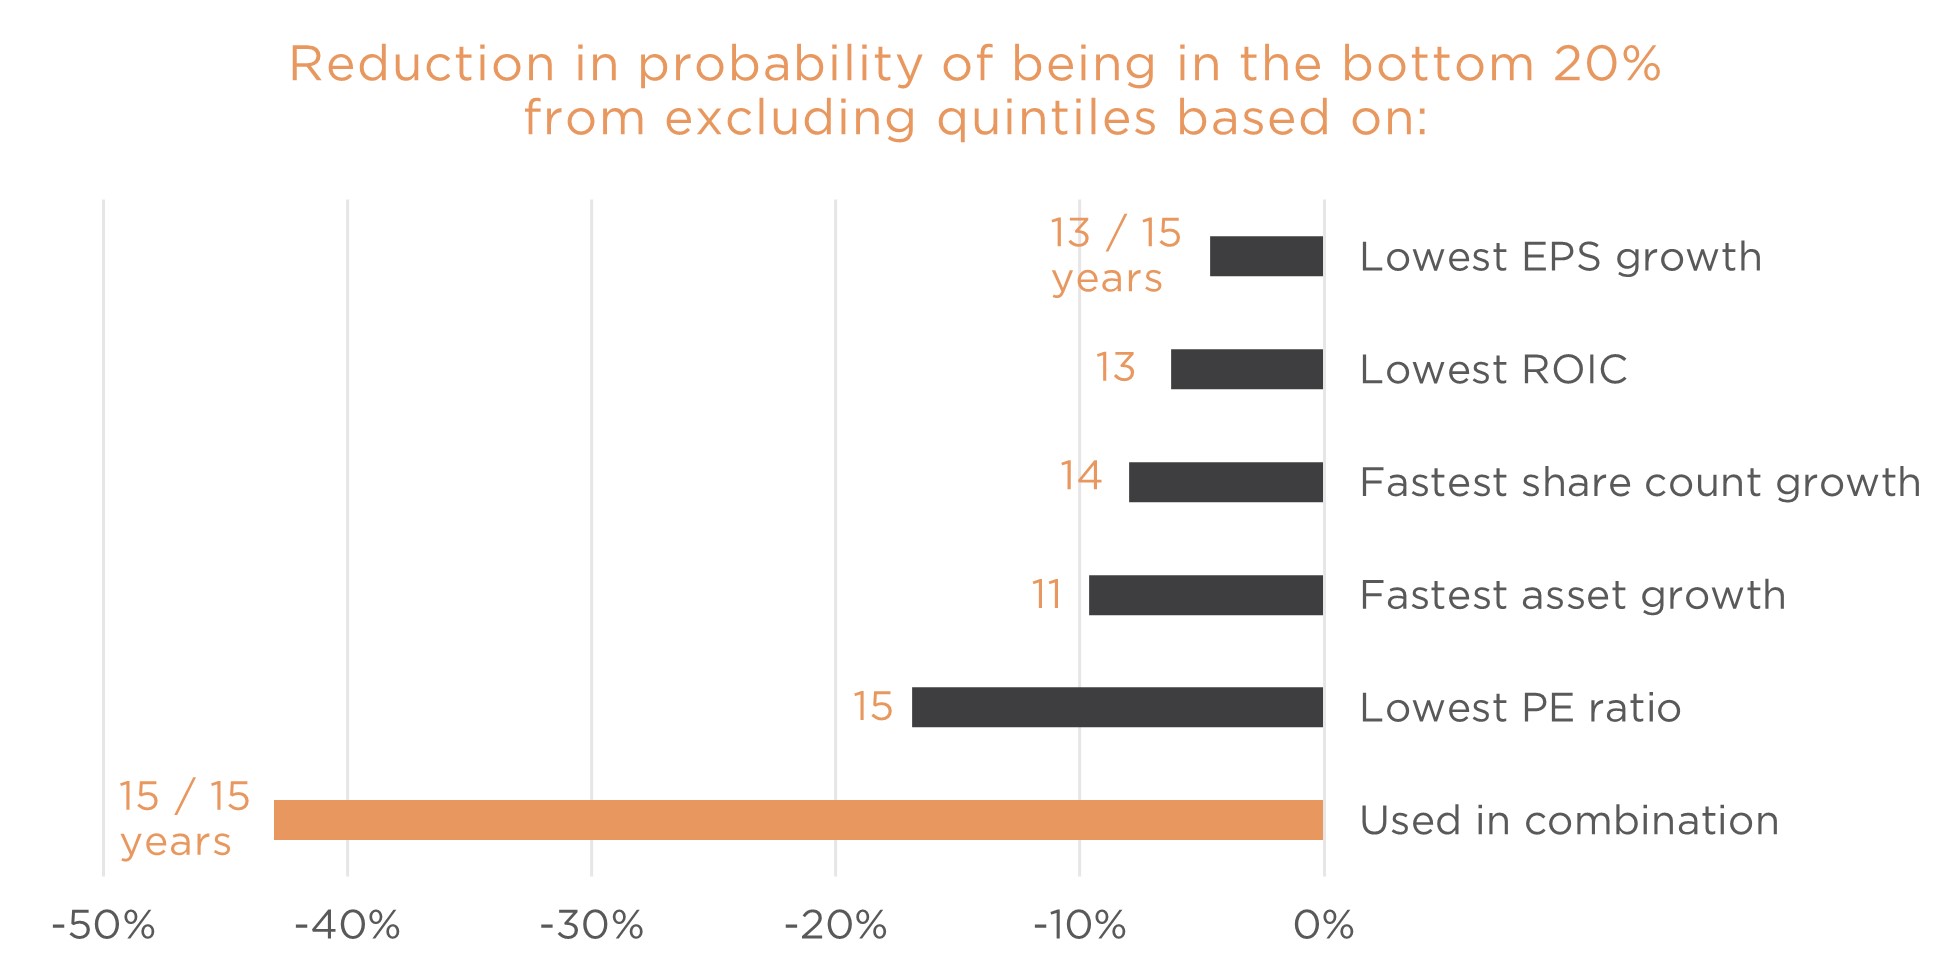
Putting it all together
The chart below shows impact on the likelihood of selecting a stock that ends up in the bottom 20% by avoiding the worst quintile of stocks based on each of the five variables discussed above. You can see that applying all measures together reduced the probability of participation in the bottom 20% over the last 15 years by 43%. The numbers in orange alongside the bars show how many of the last 15 years each variable would have had a beneficial impact.
Lastly, what does all this do for performance. What if by avoiding stocks that end up in the worst quintile we also miss out on stocks in the best performing group. It may be that the net effect on performance is negative. The chart below shows the annualised performance uplift relative to the market over the last 15 years by applying each of the five exclusions in isolation and together, and how many years they benefited performance.
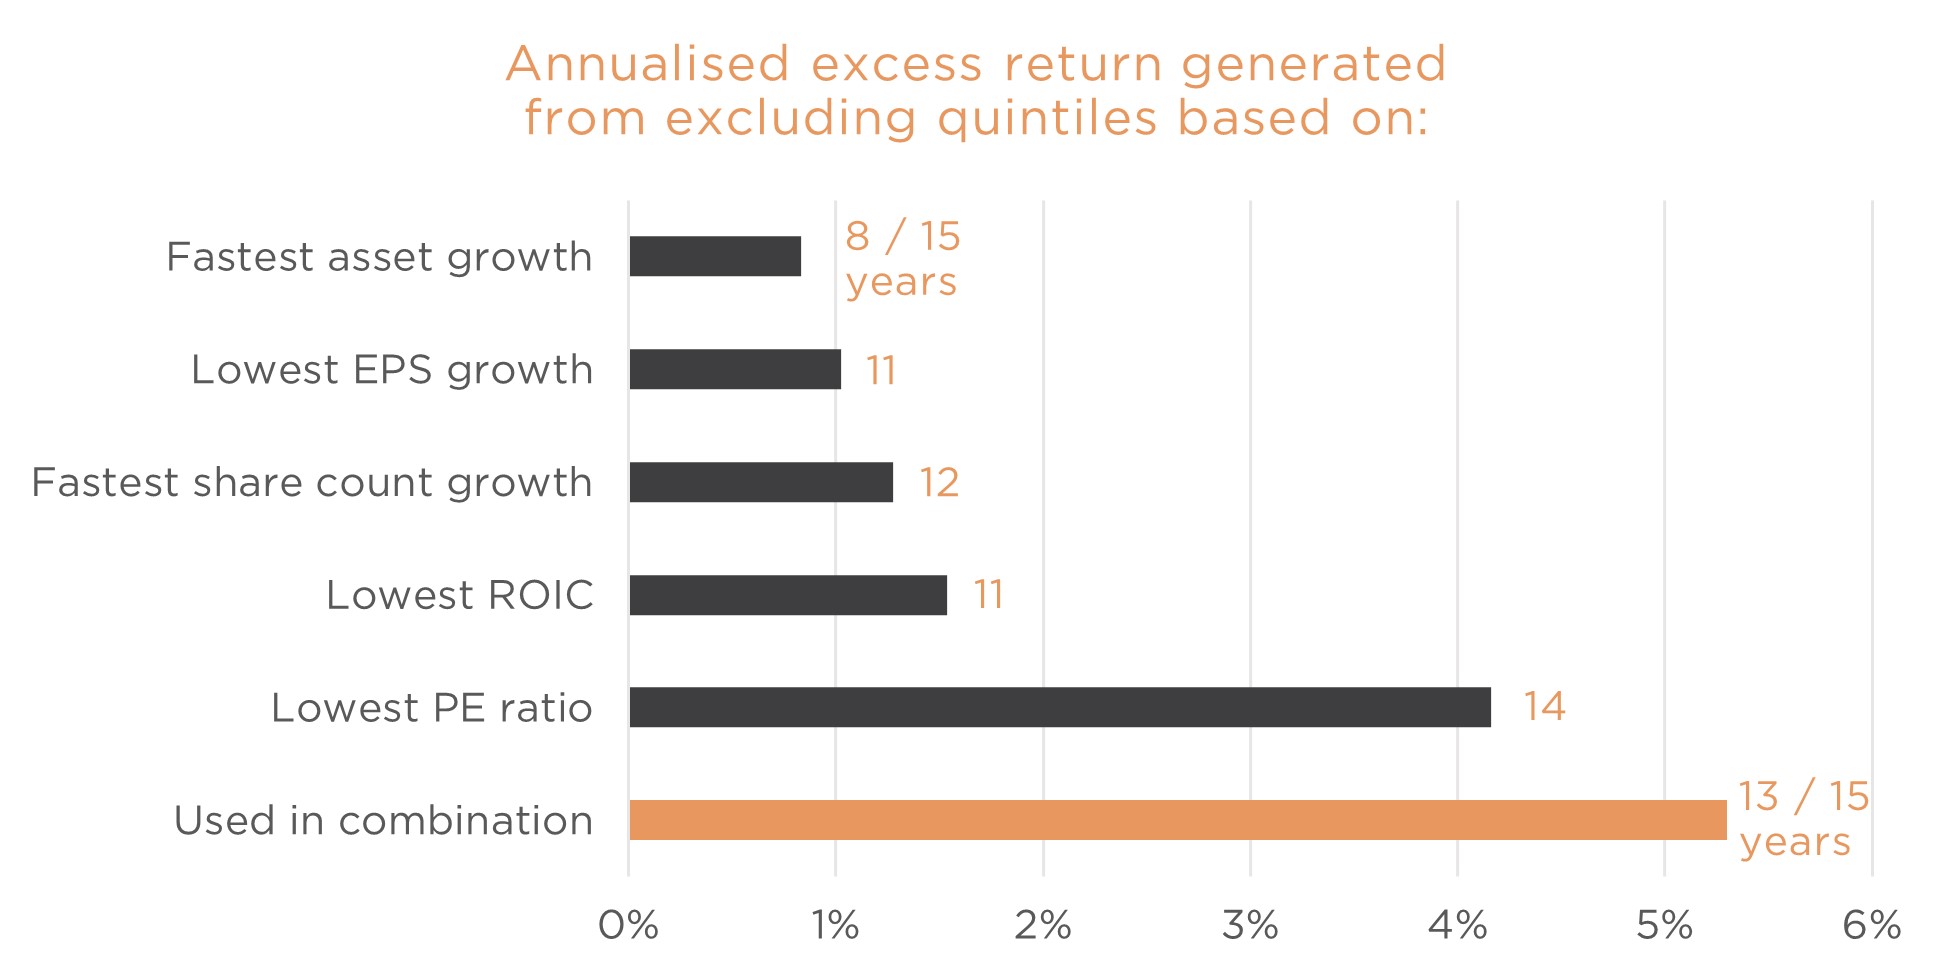
We showed in the prior chart that these five factors, applied together, would have reduced an investor’s participation in the bottom quintile of the equity market by 43%. The chart above shows that this would have added an annualised 5.3% to return. Interestingly, avoiding the quintile with lowest PE stocks would have improved performance in 14 of the last 15 years, and by itself added 4.2% p.a. to performance.
These five metrics are powerful tools in avoiding the bottom 20% but they do not provide the whole toolkit an investor needs. An investor must also be vigilant in looking for signs of a good business one the wane, such as falling customer retention rates, slowing growth or management’s rising appetite for large acquisitions. The payoff for doing so is remarkable, as shown below.
Never miss an update
Enjoy this wire? Hit the ‘like’ button to let us know.
Stay up to date with my current content by
following me below and you’ll be notified every time I post a wire
Stephen has been investing in global markets for over 30 years, making him one of Australia’s most experienced international investors.
He is the Founder and Chief Investment Officer of Aoris Investment Management, an independent, Sydney-based firm dedicated to a single strategy: a highly selective global equity portfolio.
Since its inception in March 2018 through to the end of April 2025, the Aoris strategy has ranked in the top 5% over 3 years, 5 years, and since inception, relative to a broad peer group of international equity funds (Morningstar). The firm currently manages just under $2 billion in assets.
Prior to founding Aoris in 2017, Stephen was Head of International Equities at Evans & Partners.


Stephen has been investing in global markets for over 30 years, making him one of Australia’s most experienced international investors. He is the Founder and Chief Investment Officer of Aoris Investment Management, an independent, Sydney-based...
Expertise
Stephen has been investing in global markets for over 30 years, making him one of Australia’s most experienced international investors. He is the Founder and Chief Investment Officer of Aoris Investment Management, an independent, Sydney-based...
Expertise
Comments
Comments
Sign In or Join Free to comment