I’m so bearish, I’m bullish

Thomas Bignill
Mason Stevens
Just over a week ago the Mexican central bank cut rates, which meant that we have had 800 rate cuts from global central banks since the Lehman collapse. This has in part led to the worst 10 year rolling returns from cash and commodities since the 1930’s.
All the below data points are in USD, and are as at 20th February.
No surprise then that we are seeing week after week record breaking flows into Bonds. Last week a staggering $18.1 Bln went into bonds. Investment grade saw $11.6 bln, High Yield $0.6 bln and Emerging market debt has $2.1 bln. This brings Year to date flow into bonds at a massive $130 bln. We have seen Credit Default swaps ( ie the risk of default ) on European Investment Grade Corporate Bonds fall in the last 2 weeks to an all time low to 42 bps.
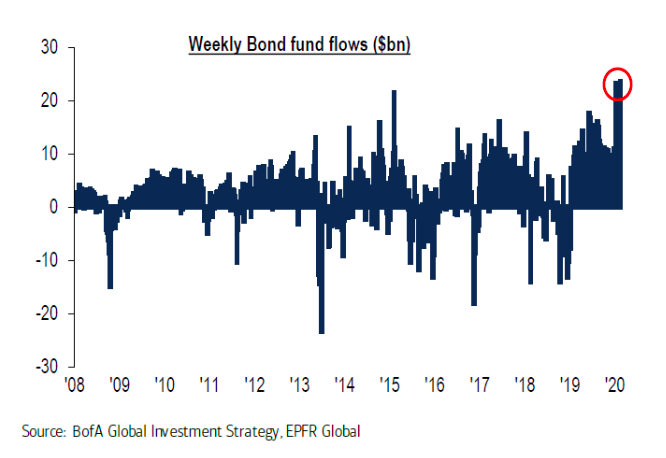
This means Inflows into bonds are annualising at $966 bln, on track to double the previous record inflow into bonds from last year at $481 bln. Investment grade bonds are annualising at $605bn, again pacing at almost double previous record set last year at $308 bln.
The below chart shows the significant YTD asset flows of equities and bonds vs flows each year for the last decade:
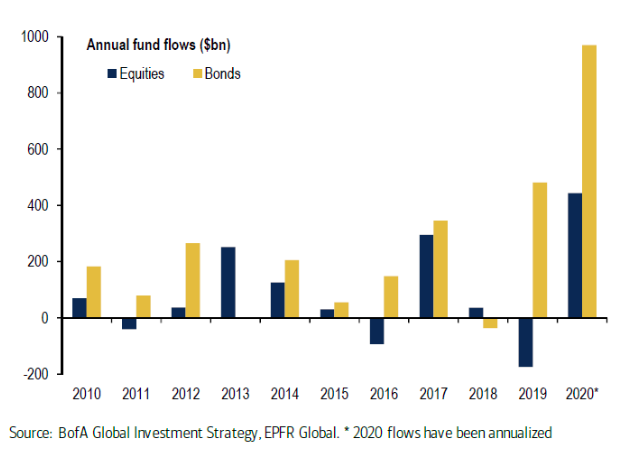
Whilst these flows have seen money pour into Bonds, equities are getting their fair share. Equities continue to see strong inflows, some $54 bln has gone into equity markets in the first 7 weeks of this year. Of course that only tells half the story. Actually, $67 bln has gone into ETFs, whilst $13 bln has come out of long only equity funds, hence the net inflow number of $54 bln. State Street Global Advisers highlight that Equity ETF flows for January was more than 6x greater than their 20 year January average.
Not surprisingly, some 2,712 ETFs have been created in the last 2 years. Peeling back the onion a bit further and Emerging markets have continued to see good flows this year, some $7.5 bln has been invested there, Brazil attracting roughly 8%
The below chart looks at the history of asset bubbles over the past 40 years, and it puts into context the movement of the so called “disrupters” and how their movement has compared to a number of previous bubbles, such as the recent tech bubble and then the US housing.
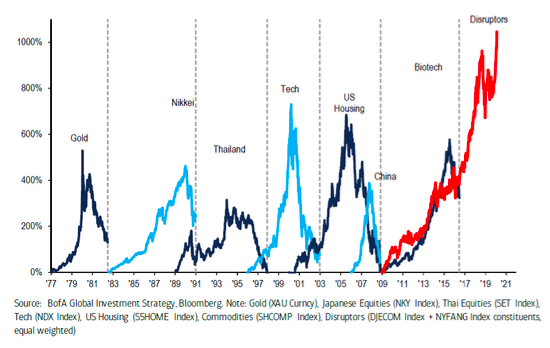
This flow of global capital continues to flow to the US tech disruption bubble, last week it saw another $1.9bln directed there last week. The Lady “MAGA“ stocks (Microsoft, Apple, Google, Amazon ) all have market caps of over $1 trillion dollars. Each of them bigger than the entire S and P Energy sector. These tech flows are now annualising at $62 bln. If this continues it will beat the previous record inflow of $18 bln in 2017. It is not, however, just focused on the US. ChiNext index (“the NASDAQ of China”) was up 22% in 2020, until this week.
Investors clearly thought -What virus?
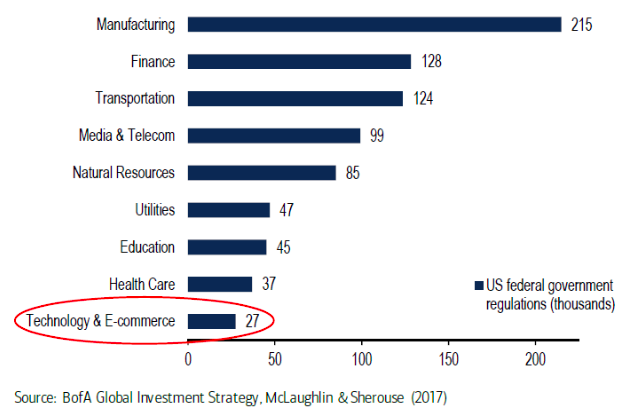
The below chart puts into perspective the flows this year into the tech sector. These have been annualised.
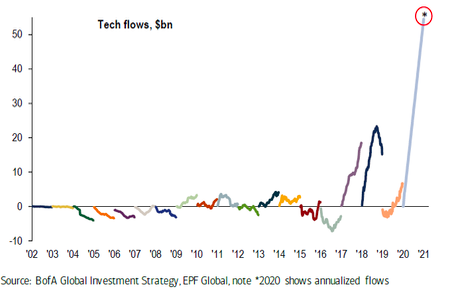
Ironically, despite many headlines and the broader “Big Tech” antitrust actions, Technology remains the US’s least regulated sector.
Markets have driven higher as the flows continue to support these asset classes, with a real fear of missing out mentality starting to take hold. There is a lot of cash that remains burning a hole in pockets around the world and the lower for longer global interest rate situation is starting to bite and cash is being deployed.
Given all these data points are a week old, all eyes will be on this week’s flows given the sharp sell off in markets!
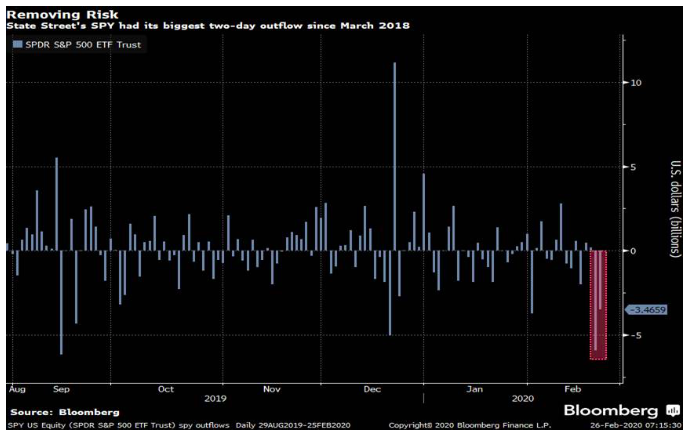
The only preliminary number we have is for the first 2 days of this week, from Bloomberg, the world’s biggest exchange-traded fund is feeling the pinch. Traders pulled almost $9.4 billion from State Street Corp.’s SPDR S&P 500 ETF Trust in the past two days, according to data compiled by Bloomberg. That marks the largest back-to-back withdrawal since March 2018 for the $298 billion fund that tracks the American equity benchmark. “These SPY flows are ‘big-boy level,’ but pretty typical for an easily spooked trading crowd that is adjusting their portfolios to account for growing virus risk,” said Bloomberg Intelligence analyst Eric Balchunas.
Let’s see how the rest of the week plays out.
Never miss an update
Enjoy this wire? Hit the ‘like’ button to let us know.
Stay up to date with my current content by
following me below and you’ll be notified every time I post a wire
Tom has a strong vision for the growth and development of the managed accounts industry and is committed to enhancing the investment and client service models of financial advisory practices in Australia.

Thomas Bignill
Co Chief Investment Officer
Mason Stevens
Tom has a strong vision for the growth and development of the managed accounts industry and is committed to enhancing the investment and client service models of financial advisory practices in Australia.
Expertise
No areas of expertise
Thomas Bignill
Co Chief Investment Officer
Mason Stevens
Tom has a strong vision for the growth and development of the managed accounts industry and is committed to enhancing the investment and client service models of financial advisory practices in Australia.
Expertise
No areas of expertise
Comments
Comments
Sign In or Join Free to comment