Identifying when / how to buy pullbacks as markets surge
Global stock markets have rallied strongly this month with the ASX200 up 8.9% reaching levels not seen since August 2015, while the US S&P500 is also up 8.9% reaching fresh all-time highs. This rally should come as no surprise to the open-minded investor, with fund managers sitting on record levels of cash and central banks continuing to support asset prices, the path of least resistance is clearly up.

Nicholas Forsyth
Market Matters
We have no doubt this artificial bond market will come to a sticky end, BUT the music appears to have months to play out yet:
Roughly 500 million people are living in countries paying negative interest rates. e.g. If you lend the Swiss Government $1000 for 50 years, they will kindly pay you back less than $990, try teaching that in an economics lecture a decade ago!
Over the last few months the European Central Bank (ECB), Swiss National Bank (SNB) and Bank of Japan (BOJ) have all increased their respective purchase of "assets" in an attempt to promote growth and inflation. However in Emerging Countries central banks have now also turned from net sellers to net buyers. Hence on a global level central banks are in effect combining their efforts to push asset prices higher - including shares
Importantly we believe it's highly unlikely that central banks will take their foots off the accelerator after only a few months effort. More plausible is sustained central bank support, particularly from emerging markets and for an extended period given the expectation for rate hikes in the US is now tipped to be a 2017 story. Simply put, emerging markets have enjoyed capital from the US given the interest rate differential (low rates in the US – higher rates in emerging countries) however when US rates go higher there is a risk that repatriation of funds back to the US will play out. Because of that concern, central banks in emerging markets are priming the pumps in preparation for an event that is yet to happen – which creates a very supportive undertone for stocks in the near term.
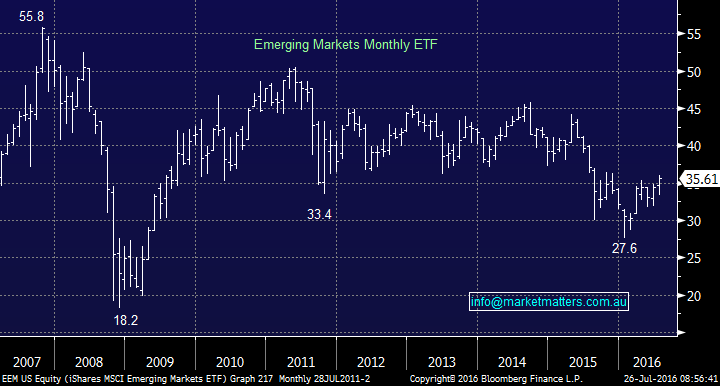
The local ASX200 is highly correlated to emerging markets. Importantly bond buying in these "higher risk" countries reached all-time high levels in the week to July 20th. A large shift is occurring as the hunt for yield intensifies - two of the best-performing countries since BREXIT, illustrating increased risk appetites are Mongolia and Zambia!
Roughly the same amount of money is pouring into emerging markets equities as bonds as global fund managers chase performance. All this combines to be short term very bullish for Australian equities.
Technically the Emerging Markets look poised to at least rally another 10% from current levels, but when we look at the decline since 2014, this is no more than a decent bounce, not an aggressive bullish call.
Emerging Markets Monthly Chart
Hence identifying relatively low-risk entry levels for stocks that have shown their hand and commenced rallying should be very useful for the remainder of 2016. Also as we believe this is the last "blow off" rally for equities volatility is likely to pick up creating good entry and exit opportunities for stocks. Two methods we like and use are:
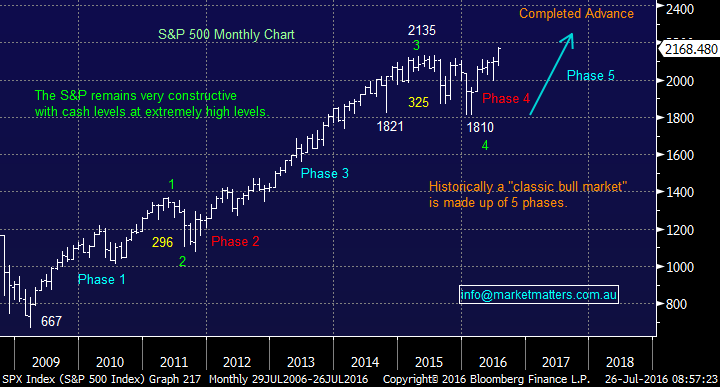
1. Buying Wave Symmetry Retracements
We often use Wave Symmetry as a method to identify levels to enter stocks / markets during a correction. This method enabled us to aggressively buy stocks when others panicked in early 2016 as the S&P500 retraced 325-points, similar to the 296-points in 2011 - under 10% difference.
Obviously for this method to be useful an investor needs to have a firm view if they are a buyer / seller of stocks overall. Following are two stocks that we are watching closely at present using this method.
US S&P500 Monthly Chart
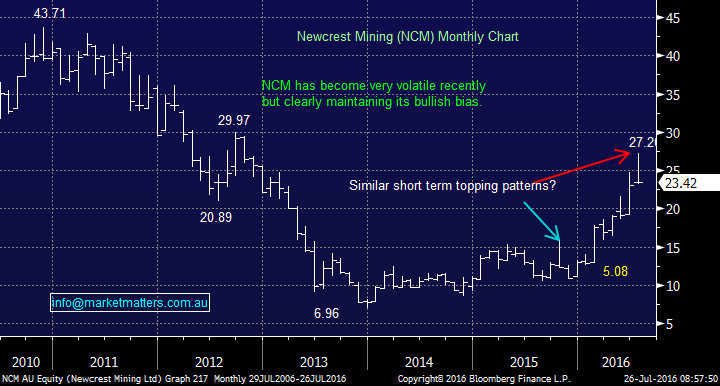
Newcrest Mining's last major correction was $5.08. We like gold for the months / years ahead hence are looking at the $22 area to buy NCM and / or another good Australian gold producer.
Newcrest Mining (NCM) Monthly Chart
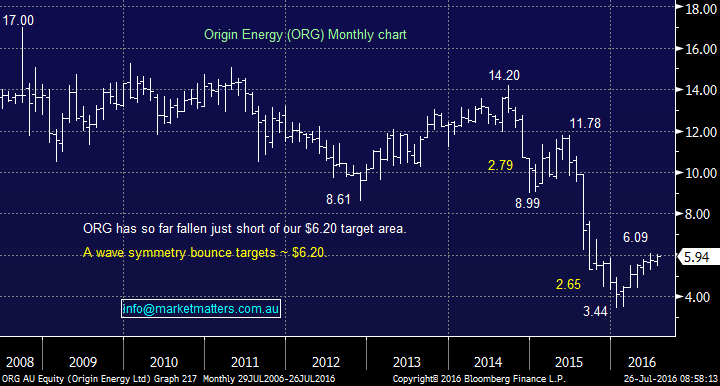
We have thrown this example in to show the method goes both ways. We are long ORG looking to take profits in the $6.20 region.
Origin Energy (ORG) Monthly Chart
2. "ABC" Retracements
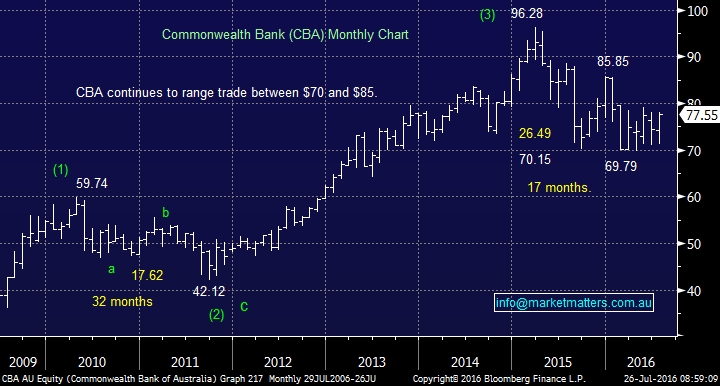
Both stocks and markets often correct in an "ABC" style pattern i.e. a drop bounce followed by a second drop of similar magnitude to the original. The buy signal is technically confirmed when the market rallies up through the "a" point, but we often will buy around the "c" point - see CBA monthly chart for an excellent clear example of this back in 2010-2011.
Again we have shown 2 examples where we are watching stocks closely using this method.
Commonwealth Bank (CBA) Monthly Chart
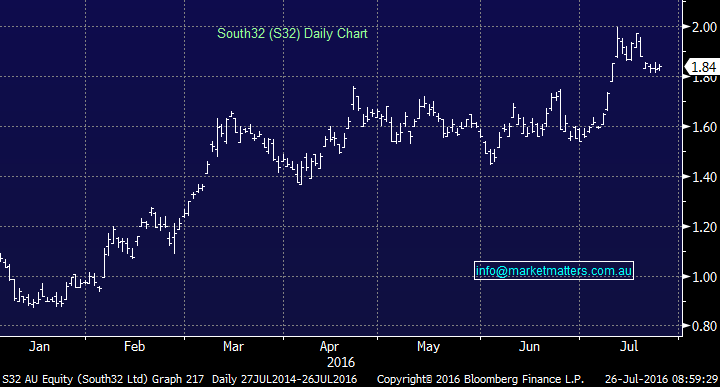
We recently purchased S32 around $1.83; we are looking for a close over $1.86 to generate a confirmed "ABC" style buy signal targeting recent highs over $2.
South32 (S32) Daily Chart
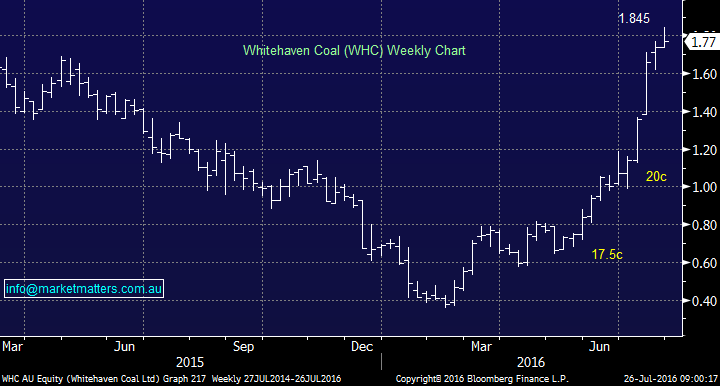
We are watching Whitehaven Coal (WHC) as its rally appears to have further to go, but a pull-back is overdue.Ideally, we will get an "ABC" style pullback towards $1.60 for a buying opportunity.
Whitehaven Coal (WHC) Weekly Chart
Summary
- As central banks attempt to avoid the inevitable painful fallout from the GFC, stocks look likely to be propelled higher short term.
- We are looking for shorter term trading opportunities in this current environment and believe that being more active, having technical structures in place to support our fundamental/macro views will serve us well.
- As outlined above we often use Symmetry Waves and "ABC" targets as methods to identify buy / sell areas and when they come together it’s even more powerful.
All figures contained from sources believed to be accurate. Market Matters does not make any representation of warranty as to the accuracy of the figures and disclaims any liability resulting from any inaccuracy. Prices as at 26/07/2016. 9:00AM.
Reports and other documents published on this website and email (‘Reports’) are authored by Market Matters and the reports represent the views of Market Matters. The Market Matters Report is based on technical analysis of companies, commodities and the market in general. Technical analysis focuses on interpreting charts and other data to determine what the market sentiment about a particular financial product is, or will be. Unlike fundamental analysis, it does not involve a detailed review of the company’s financial position.
The Reports contain general, as opposed to personal, advice. That means they are prepared for multiple distributions without consideration of your investment objectives, financial situation and needs (‘Personal Circumstances’). Accordingly, any advice given is not a recommendation that a particular course of action is suitable for you and the advice is therefore not to be acted on as investment advice. You must assess whether or not any advice is appropriate for your Personal Circumstances before making any investment decisions. You can either make this assessment yourself or if you require a personal recommendation, you can seek the assistance of a financial adviser. Market Matters or its author(s) accepts no responsibility for any losses or damages resulting from decisions made from or because of information within this publication. Investing and trading in financial products are always risky, so you should do your own research before buying or selling a financial product.
The Reports are published by Market Matters in good faith based on the facts known to it at the time of their preparation and do not purport to contain all relevant information with respect to the financial products to which they relate. Although the Reports are based on information obtained from sources believed to be reliable, Market Matters does not make any representation or warranty that they are accurate, complete or up to date and Market Matters accepts no obligation to correct or update the information or opinions in the Reports.
If you rely on a Report, you do so at your own risk. Any projections are estimates only and may not berealised in the future. Except to the extent that liability under any law cannot be excluded, Market Matters disclaims liability for all loss or damage arising as a result of any opinion, advice, recommendation, representation or information expressly or impliedly published in or in relation to this report notwithstanding any error or omission including negligence.
Never miss an update
Enjoy this wire? Hit the ‘like’ button to let us know.
Stay up to date with my current content by
following me below and you’ll be notified every time I post a wire
Market Matters is an online investment and share trading advisory service designed for those that want to take their wealth further. We specialise in advice for active share market investors, including those new to the markets or those with a Self Managed Super Fund (SMSF). As a member, you will receive twice daily and weekly trading and investment advice focusing primarily on ASX equity investments. Additionally, we share his market positions and provide an ongoing outlook on key stocks and markets that matter. We provide clear share trading and investment buy and sell recommendations with the clear aim of outperforming the market. https://marketmatters.com.au/

1 topic
4 stocks mentioned
Nicholas Forsyth
Director
Market Matters
Market Matters is an online investment and share trading advisory service designed for those that want to take their wealth further. We specialise in advice for active share market investors, including those new to the markets or those with a Self...
Expertise
No areas of expertise
Comments
Comments
Sign In or Join Free to comment