In the US, another big retailer bites the dust
Amazon and changing consumer habits claimed another victim during the week with US ‘category killer’ Toys R Us filing for Chapter 11 bankruptcy protection. This brings the total number of US retailers that have filed for Chapter 11 to 24 this year, up from 18 in 2016, according to S&P Global Market Intelligence. And there’s still three months of the year to go.
Toys R Us has struggled under its debt load. This reduces its strategic options in meeting the changing shopping preferences of consumers in the digital age. As margins come under pressure from new entrants and models, fixed costs act as a pressure point for the business, restricting the ability of management to reinvest and restructure the operations in response to the new market reality.
High levels of debt are an obvious source of fixed costs. But the true level of fixed costs is higher than this, particularly for retailers, due to the use of off balance sheet funding of property through leases.
One way to look at the fixed cost leverage in a business is through the fixed charge coverage ratio. This ratio measures the earnings buffer the company has above the fixed cost of interest and lease obligations by dividing these costs into the earnings before interest, tax, depreciation and lease costs (EBITDAR).
In the case of Toys R Us, the fixed charge coverage ratio had fallen to just 1.22x in the year April 2017. This shows how little room to move management had on gross margins and operating cost reinvestment once it had paid its debt and lease obligations.
With Amazon expected to enter the Australian and New Zealand markets in the next year or two, the current fixed charge coverage ratio of Australian retailers is a data point to consider in looking at the vulnerability of retailers to this new source of margin pressure.
The chart below shows the fixed charge coverage ratio for the listed retailers. The operating lease charge used excludes contingent lease costs where possible, as these are effectively variable cost components to the company’s annual lease costs. The figures also remove non-cash profits such as equity accounted associate earnings and asset revaluations for the EBITDAR figure.
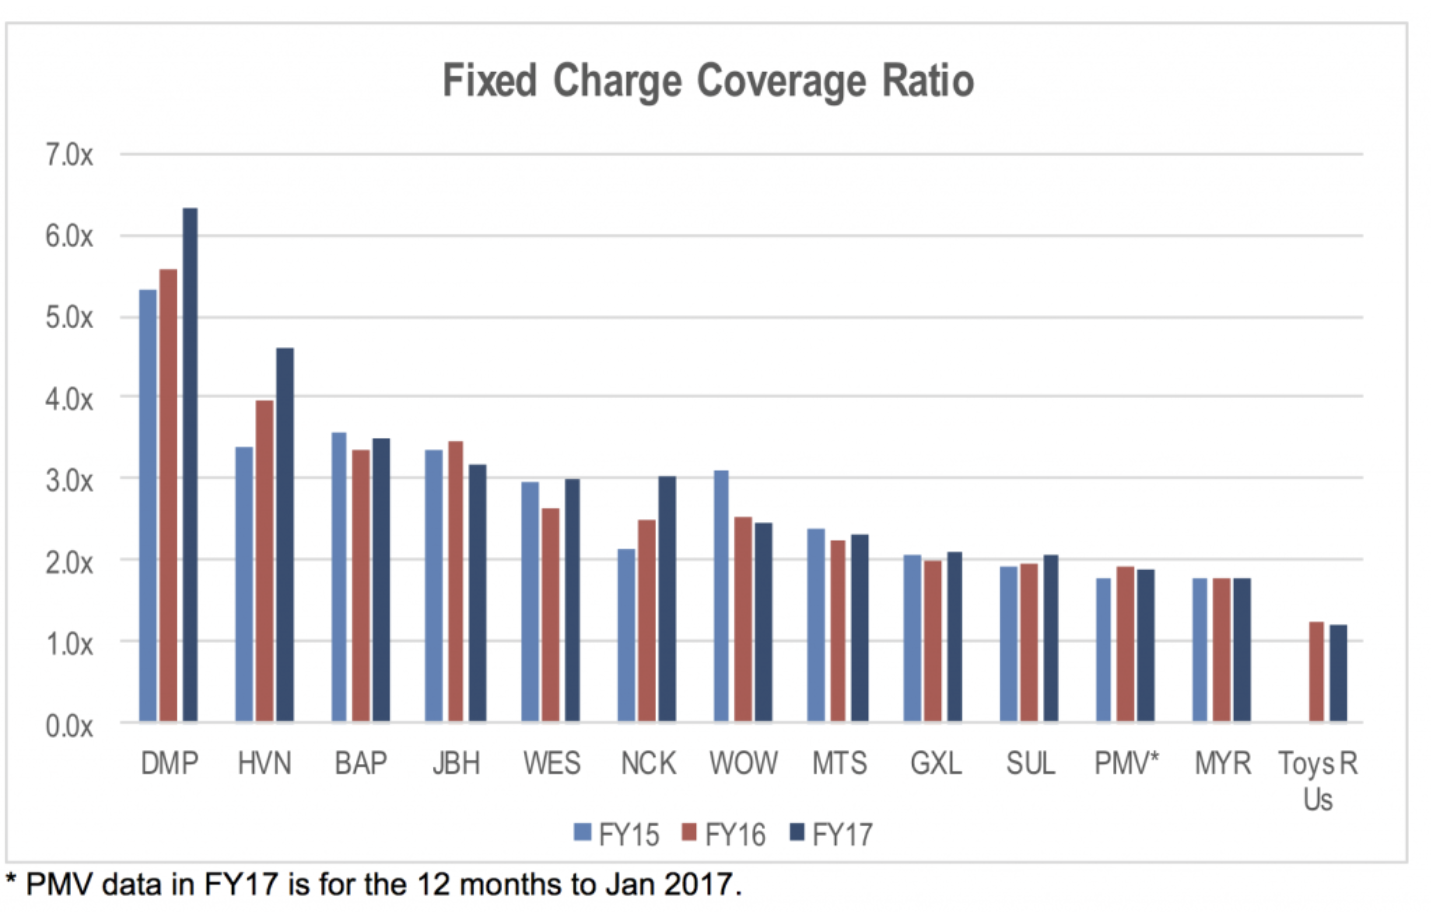
While the fixed charge coverage ratio for Australian retailers is well above that of Toys R Us, it wouldn’t require much pressure on gross margins to see this gap close for some retailers. The other point to note is the momentum in this ratio for each of the retailers. A falling fixed charge ratio could indicate that pressure and risk is starting to build for the business.
Note that the fixed charge coverage ratio does not indicate which retailers are likely to face pressure. However, it does provide some information on which retailers have less ability to reinvest in their operations and absorb gross margin pressure in the face of the Amazon threat.
If you would like to read more articles by me, please click here.
Never miss an update
Enjoy this wire? Hit the ‘like’ button to let us know.
Stay up to date with my current content by
following me below and you’ll be notified every time I post a wire
Prior to his departure in August 2022, Stuart was employed by Montgomery Investment Management for over seven years as a Senior Analyst and Portfolio Manager of The Montgomery [Private] Fund.


Senior Analyst and Portfolio Manager
Prior to his departure in August 2022, Stuart was employed by Montgomery Investment Management for over seven years as a Senior Analyst and Portfolio Manager of The Montgomery [Private] Fund.
Expertise
Senior Analyst and Portfolio Manager
Prior to his departure in August 2022, Stuart was employed by Montgomery Investment Management for over seven years as a Senior Analyst and Portfolio Manager of The Montgomery [Private] Fund.
Expertise
Comments
Comments
Sign In or Join Free to comment