Is anything compellingly cheap?
There are a number of reasons to switch weightings out of one asset class and into another. One of those reasons, which is often an effective strategy, is an absolute or relative valuation which has become stretched (one way or the other).
Defensive sectors, for example, were valued especially attractively earlier in 2018, relative to other sectors, and were deeply out of favour. Since that time these sectors have outperformed their counterparts.
With a variety of (non-US) asset classes now down considerably, many market participants are asking that same question: What is compellingly cheap?
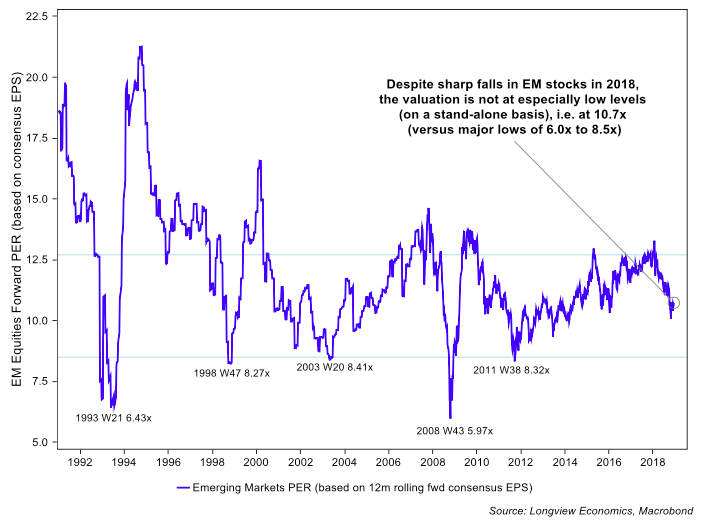
Fig 1: Emerging markets PE ratio (based on consensus 12m forward PER)
1. Are emerging market assets, as a group, compellingly cheap?
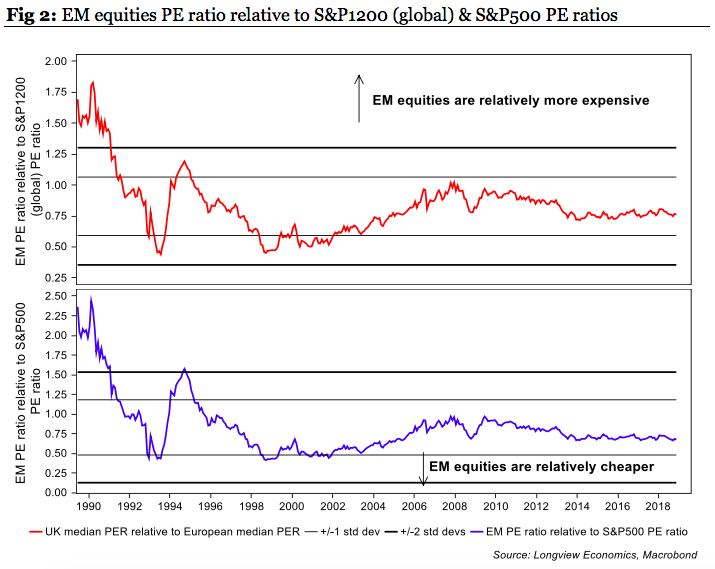
Despite weakness throughout 2018, the valuations of the overall EM index have not fallen to an extreme, as of yet. On a standalone basis, for example, the index’s PE ratio is still 25% higher than the level at which it has historically bottomed (i.e. currently at 10.7x but typically troughs in a range of 6.0x to 8.5x, fig 1). On a relative basis, EM is also not yet cheap (vs. both the US & the world, fig 2).
2. Is China cheap?
With the Chinese economy having weakened significantly and the Chinese market much lower in 2018, the equity market is notably cheaper than it was at the start of the year. The large cap Shanghai Composite’s PE ratio, for example, has fallen from 13.4x to 9.5x in 2018. Historically, though, that PE level doesn’t typically represent a major low point with the index typically troughing at lower multiples.
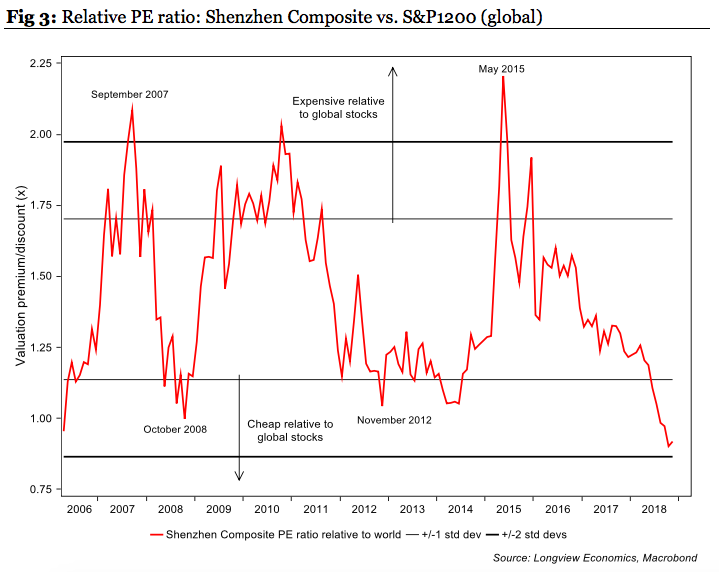
More extreme valuations in China, though, are on offer from the mid cap equities (as represented by the Shenzhen Composite index). On a standalone basis, this index is now close to its cheapest level since our data began in 2006. This index is also attractive when compared to global equities (using a relative PE ratio). Having traded at a valuation premium to the S&P1200 almost consistently for the last 12 years, the relative PE ratio now shows a (modest) valuation discount (i.e. the ratio is less than 1, fig 9b). While these valuations warrant consideration, the current Chinese macroeconomic environment is not favourable. That though should lead to further Chinese stimulus (which, once sufficient, should act as a trigger to bring about a re-rating of Chinese equities).
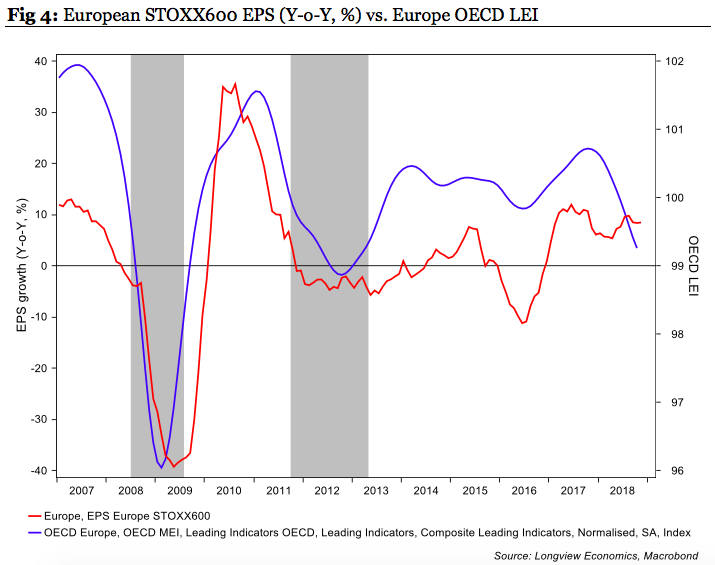
3. European markets are down considerably from their highs having posted severe declines this year (e.g. STOXX600 -15% from its highs, DAX -20%). As a result, European equities are cheaper on several metrics. Despite that, though, European equities are not yet cheap enough to consider them attractive based solely on valuation. On a straightforward PE measure, for example, while the ratio has fallen sharply from 14.8x at the start of the year, to 12.7x currently, it is broadly mid-range (relative to its history) and still above its negative 1 standard deviation threshold (at which it starts to become attractive). Relative to global equities Europe also appears expensive, trading just below +1 standard deviation relative to history. Also of note, European earnings growth is likely to soften. The OECD’s LEI for Europe, for example, has deteriorated notably over the course of the year and typically leads earnings growth (fig 4).
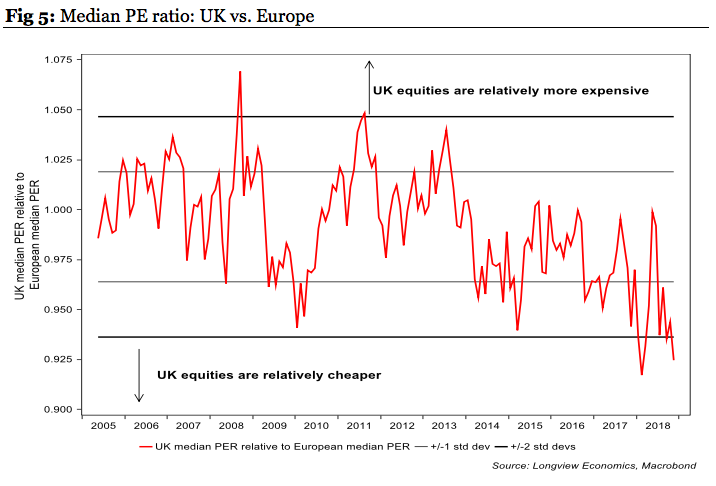
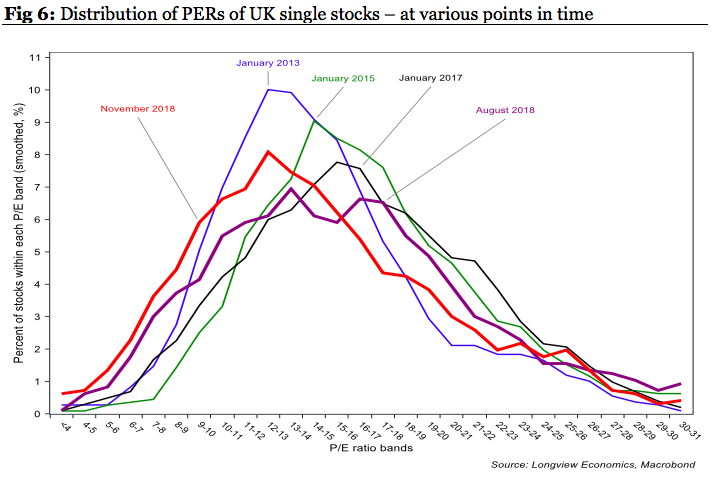
4. How significant is the UK’s Brexit discount
Brexit related uncertainty has generated a UK valuation discount. This is most evident, for example, in commercial property where London prime yields are trading above those of other European cities. Historically London has typically traded with lower yields (i.e. higher valuations). In equities, on a standalone PE ratio, UK stocks are the cheapest that they have been since 2013. The median PE ratio of UK stocks (i.e. 12.6x) is close to 1 standard deviation below its historical mean while relative to the European and US median PE ratios, the UK is notably attractive (e.g. fig 5). Looking at the broader UK ‘single stock’ distribution of PE ratios, it has shifted significantly leftwards (fig 6). That illustrates the significant proportion of UK stocks which are currently trading on relatively cheap valuations. The percentage of UK stocks with a PE ratio of 15x or less is now over 65% (higher than in both Europe and the US).
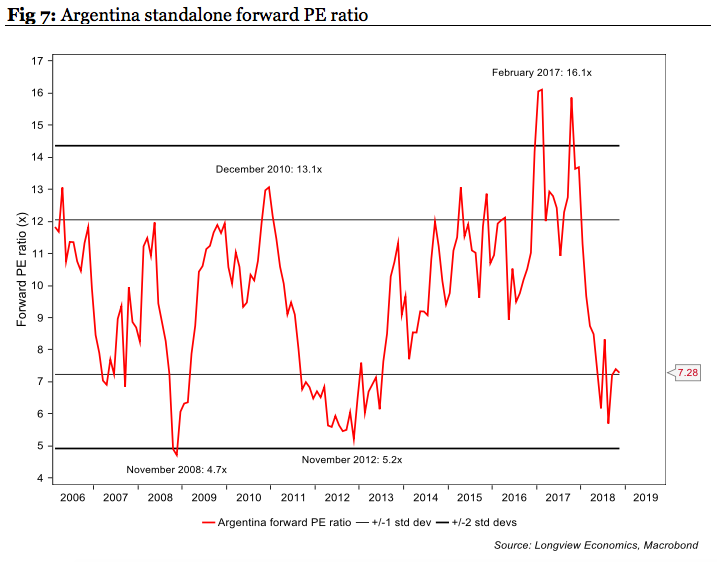
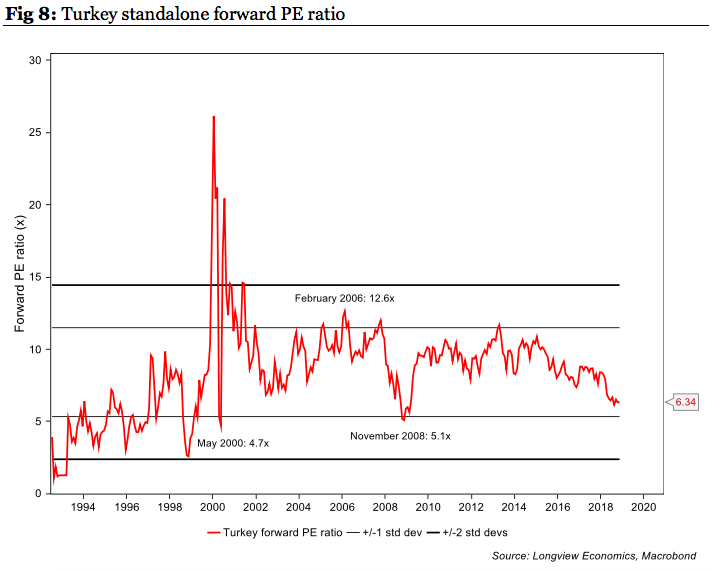
5. How cheap are individual EM countries?
After weakness throughout the year, several emerging market country indices are now trading at low single digit forward PE ratios. Argentina, for example, is trading on a PER of 7.28x, which is less than half its level from as recently as February and October last year. It is also trading 1 standard deviation below its historical valuation mean (fig 7). Other cheap emerging markets which are close to their -1 standard deviation threshold include Russia (5.2x), South Korea (8.4x) and Turkey (see fig 8).
Never miss an update
Enjoy this wire? Hit the ‘like’ button to let us know.
Stay up to date with my current content by
following me below and you’ll be notified every time I post a wire
Longview Economics, founded in 2003 by Chris Watling, is an independent research house based in London, providing three distinct yet interrelated groups of research products: Short and medium term market timing; Long term global asset allocation advice; and Global thematic, macro and commodities research.

1 topic

Longview Economics, founded in 2003 by Chris Watling, is an independent research house based in London, providing three distinct yet interrelated groups of research products: Short and medium term market timing; Long term global asset allocation...
Expertise
Longview Economics, founded in 2003 by Chris Watling, is an independent research house based in London, providing three distinct yet interrelated groups of research products: Short and medium term market timing; Long term global asset allocation...
Expertise
Comments
Comments
Sign In or Join Free to comment
most popular
Equities
Buy Hold Sell: 5 ASX stayers built to go the distance
Livewire Markets