It’s getting hot in here

Brett Gillespie
Global Macro
Tariff wars, emerging markets in crisis, and the US economy overheating…where does one start when trying to work out what it all means? Well, as always I like to start with history. Have we seen this before? Pretty much. We have many historical analogues to ponder, and so many possibilities. But for me the 60’s and the 90’s come to mind.
“A little knowledge is a dangerous thing” Alexander Pope 1706
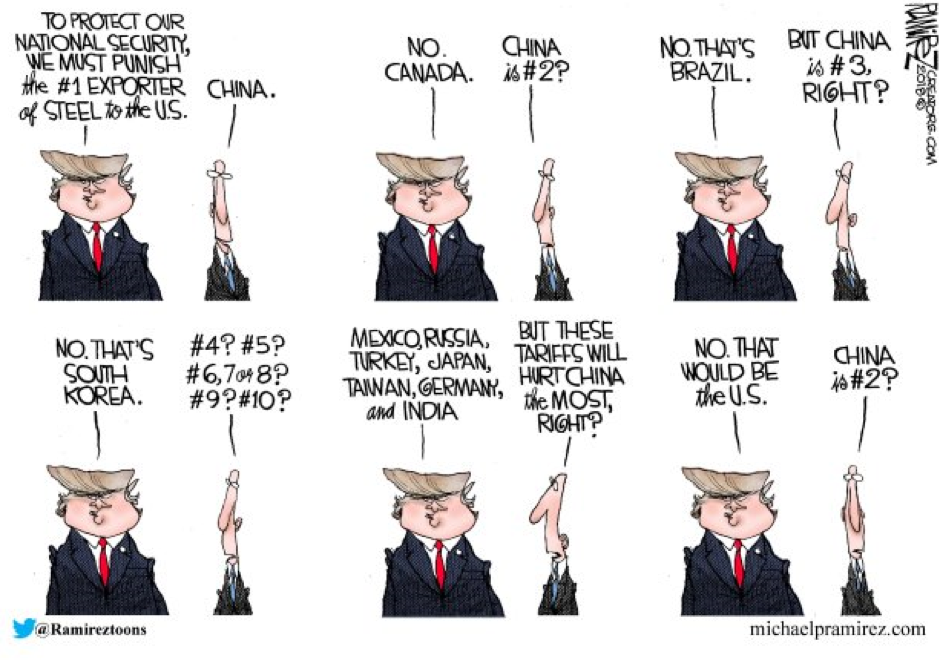
Let’s start with tariffs. Is it simply brinkmanship, where Trump’s true desire at the end of the day is to force the Chinese to lower tariffs? Or is it something more pernicious, perhaps a multi-decade turning point in globalisation?
If brinkmanship, how will it end? The market assumes rather gently, with the US stock market generally happy to look through the shenanigans and assume a positive end result. Perhaps that will be the case, but key to securing large concessions through brinkmanship is not only threatening large repercussions, as Trump is currently doing. But convincing your combatant that you are deadly serious about following through. More often than not deadly serious means actually following through.
Kennedy knew this. For a perspective on successful brinkmanship, one can’t go past 13 days in October, 1962 – the Cuban missile crisis. In August 1962, the Soviet Union snuck nuclear missiles into Cuba(1) and assembled launch pads before the US noticed. Despite some suspicions, the US did not realise a nuclear arsenal had been deployed until October 14th when aerial reconnaissance confirmed launch pads and missiles ready to go in Cuba.
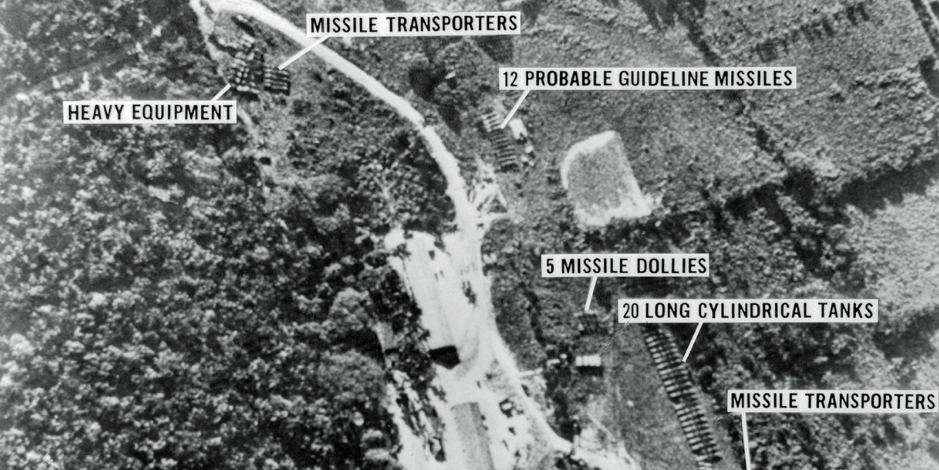
Kennedy threatened to invade if they were not removed. The Soviet Union protested. The missiles in Cuba were purely for Cuba’s defence, and any invasion by the US of Cuba would trigger a war with the Soviet Union. Kennedy publically moved to DEFCON 2, said that the United States will "regard any nuclear missile launched from Cuba against any nation in the Western Hemisphere as an attack by the Soviet Union on the United States, requiring a full retaliatory response against the Soviet Union." After some rather tense exchanges, they took his threat seriously, and agreed to remove the missiles. Pretty heavy brinkmanship when the consequences of escalation were so high for both parties.(2)
Of course we are not talking about the same consequences here. But we are talking about the same game, namely the game of brinkmanship. To get big concessions, big threats need to be made convincingly. Which as we are seeing, needs some follow through. Sometimes the outcomes aren’t as intended…
Beyond brinkmanship, there are a few other analogues that come to mind. Perhaps inflation breaking out, like in the late 60’s when the Fed allowed unemployment to breach new lows? Or can the US economy handle stronger growth, like the productivity surge Greenspan embraced in 1996/97 to forestall rate hikes? Or does none of this matter, because we are about to repeat an EM crisis like 1997/98?
Perhaps there is no historical analogue? After all, we don’t have a historical analogue of 10 years of zero to negative interest rates in the major economies of the world; combined with 18 trillion dollars of bond purchases by their central banks! (But we do have analogues of low interest rates generating financial bubbles).
Do you have a conviction? If you are highly convicted, perhaps you should heed Alexander Pope’s famous phrase, “A little knowledge is a dangerous thing”! Nonetheless, I think one can have conviction in how scenarios might play out. So let’s start with the scenarios.
The scenarios
Tariff escalation
If Trump imposes a tariff of 25% on 200b of US imports from China, and particularly if he follows it up with another 267b of tariffs, that is all that will matter for markets in the next 6 months. With the latter, one can’t escape both a significant growth and inflation impact in coming months. EM equities will fall a further 10-15%, and US equities likely fall 5-10%. The USD would soar 5-10%, at which point the Fed stops hiking.
Tariff de-escalation
If the US agrees a resolution with China, the focus turns back to the current status of the US economy. It is too strong. Initially equities rally, the USD likely falls as emerging market equities outperform, and bond yields rise markedly. At some point in the next 6-12 months the market realises the Fed needs to take policy restrictive to slow the economy and quell inflation, and a recession gets priced.
A bubble bursts
What bubble? As I wrote in June, after 10 years of zero interest rates and low bond yields, money has poured into any bonds that gives a little extra yield. We have seen the wobbles already…
At the moment, with the unresolved tariff war, it is impossible to be emphatic. But the time is nigh when it will pay to be very decisive indeed. And conversely, a disaster, potentially, if you are not. Am I being too alarmist? Or even too simple? Let me give you some facts, after which you can decide.
How bad can a tariff war be?
Well I could start with the Bank of England’s prognosis;
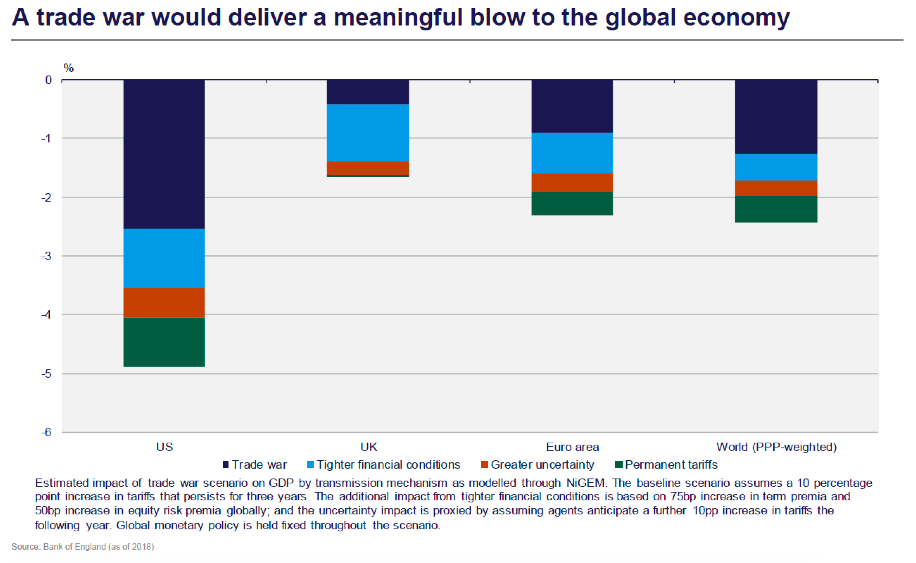
Wow, 5% off US growth…
However, note there are some pretty dire assumptions in there. Firstly, they assume every country imposes a 10% tariff. The impact of that is shown in the dark blue (about half the overall impact). The rest of the impact comes predominantly from higher bond yields, lower equity markets, and greater uncertainty. There is no assumption of stimulus, either from rate cuts or fiscal policy (which has just had a windfall from the tariff “tax”).
So it is fair to say that the impact would be much less than this. But how much? Well the first point is we don’t know what the final tariffs are yet. But if Trump proceeds with tariffs on all Chinese imports (about $500 billion), as he is threatening, reasonable estimates would see a growth impact of 1 to 2% for each economy. And that will hurt.
Of course, many assume this is nothing more than brinkmanship. A game of chicken. As John Cirace argues,
to win the game of chicken, the individual must “create the impression that nobody is crazier or badder than me”. Ipso facto, Trump will win!
Or crash...I’m not sure he realises crashing is a possibility. So he just might not see it coming. What does a crash look like? US stocks down 10%. That would get his attention, though not necessarily a reaction.
Will it happen? Well, by the time you are reading this, the answer might be clear. But I strongly believe as I write, one cannot hold a view on the evolution of the confrontation with conviction. We pay many consultants who are experts on Chinese and US politics. The more you know, you realise the less you can be sure.
The US economy is too hot
What we can be sure of right now is the current momentum in the US economy and the building wage and inflation pressures. Yawn you say? Forecasters have been saying that for over a year. Boring!
Well just because the bond market isn’t pricing it, doesn’t mean it isn’t happening. Like the Russians stealthily shipping their missiles into Cuba and assembling them without the US noticing, the US economy is slowly but surely overheating whilst the Fed embraces patience.
Indeed, it is the storm clouds of tariffs and emerging market stress that has both the Fed and the market ignoring domestic strength. To be fair, that is fair. Both have to price a weighted possibility of the possible outcomes. But don’t mistake market stability for market calm. There are two powerful forces at play for bonds, both getting stronger. One is going to give.
Why do I say getting stronger? First, let’s take a look at US growth. Our nowcasting (which converts the pulse of US data into GDP) shows an accelerating US economy.
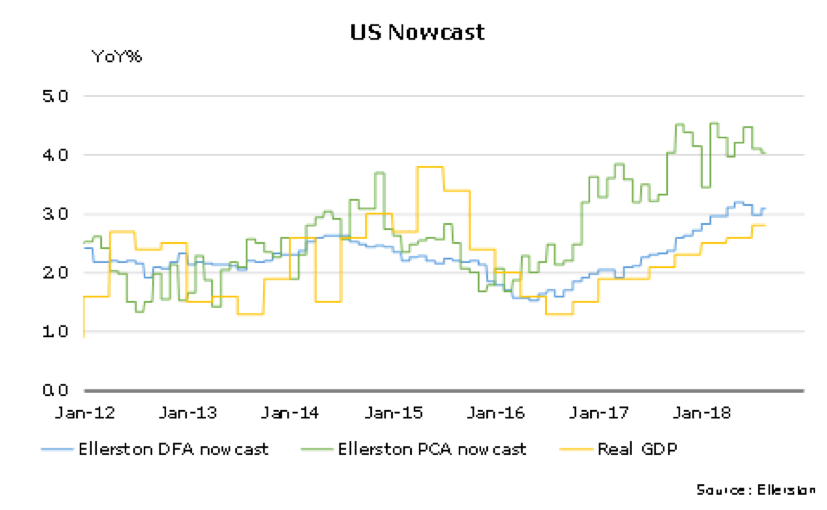
Our Financial Conditions Index suggests US growth will slow…
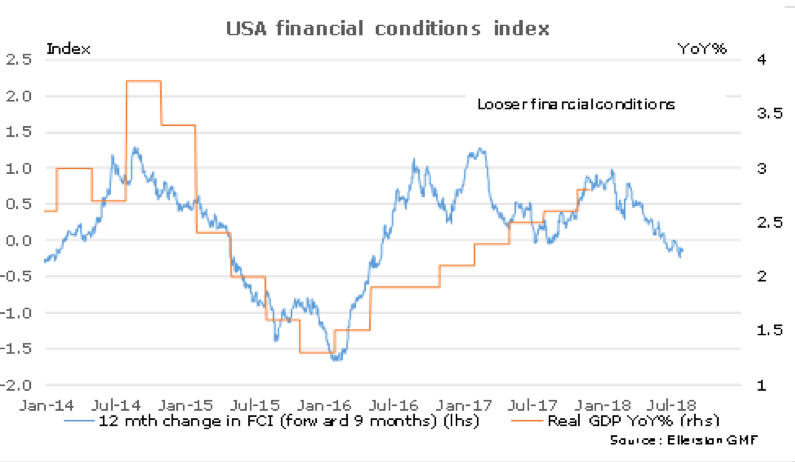
But when we incorporate the US fiscal stimulus largely still to come (worth about 0.7%), we forecast US growth of 3% in 2018, and a US unemployment rate below 3.5% by the middle of next year.
Isn’t that great? Well no, as usual, it depends. It depends on two factors.
- Are inflationary pressures building
- If so, will those pressures fade, or intensify?
I have waxed on ad nauseam in past monthlies about NAIRU (the non-accelerating inflation rate of unemployment), that we are through it, and that wages will rise followed by inflation. Some posit we are not through it, or at least not much through. Some go even further, suggesting in effect that NAIRU does not exist, and that wages will never rise. Let’s quickly dismiss the later (can you really imagine a world with zero unemployment and employers aren’t willing to pay higher wages? Even wages are rising in Japan now at 2.5% unemployment). So assume NAIRU does exist. So what is the evidence telling us about where it is?
Well, the evidence is telling us that the Fed’s estimate of 4.5% looks about right. How can I say that, when so many smart people are suggesting that low wages today indicate NAIRU must be lower (and the Phillips curve flat)? I guess I don’t think they are that smart.
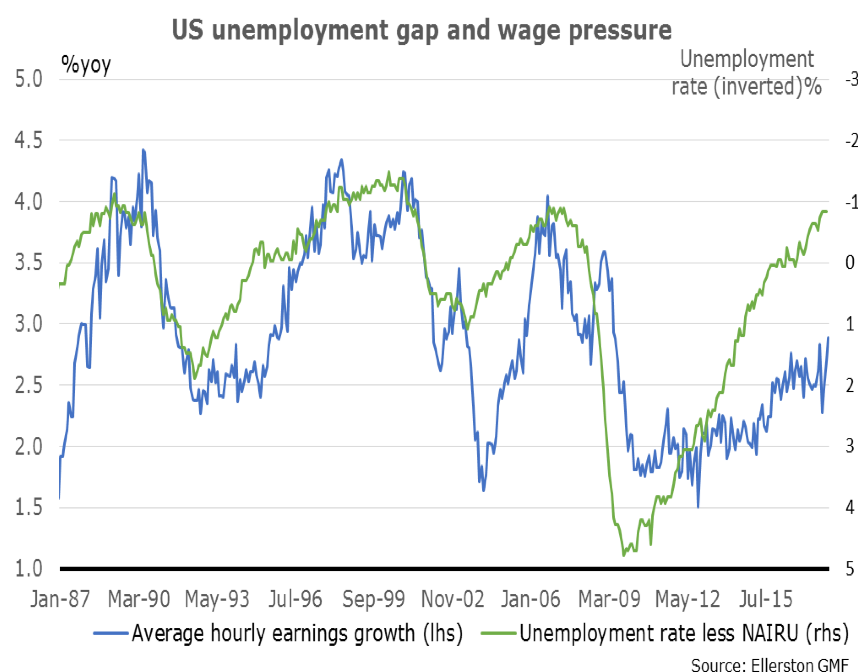
Let’s start with the Phillips curve (for wages). First point; it is not a curve. It is a hockey stick. Yes it is a little curvy when one considers an unemployment rate that is between 1% below NAIRU and 2% above. But when unemployment goes well above NAIRU, by say 5%, the curve is flat. It doesn’t matter if unemployment is 1% higher than NAIRU, or 5%, it exerts no impact on wages. As long as there is excess workers available, employers don’t need to pay up. Too many commentators have observed that no increase in wages, as unemployment has fallen, suggests the relationship is broken. Wrong, the relationship is perfectly consistent with the last 30 years of data.
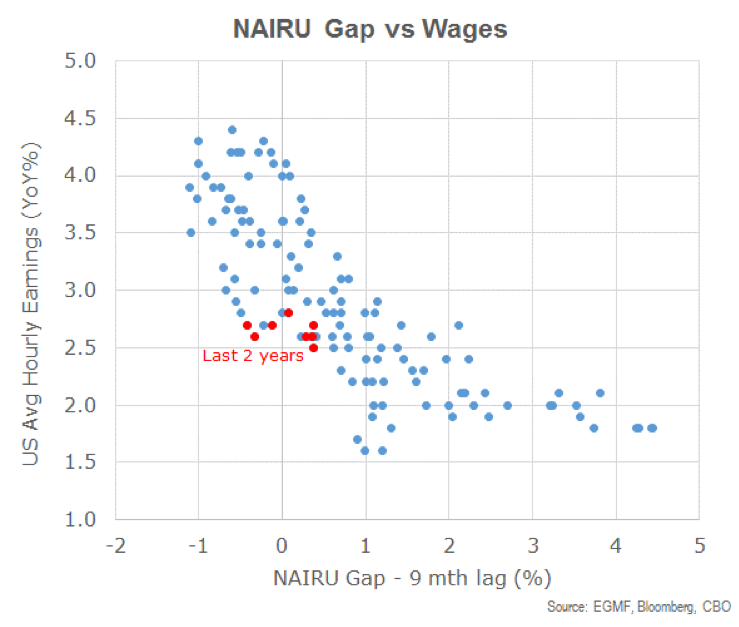
And the latest employment number, dare I say, is emphatically conforming to past relationships.
Can we be confident it will continue? After all, the past relationship sample is small.
Only 3 times in the last 35 years has the unemployment rate been this far below NAIRU.
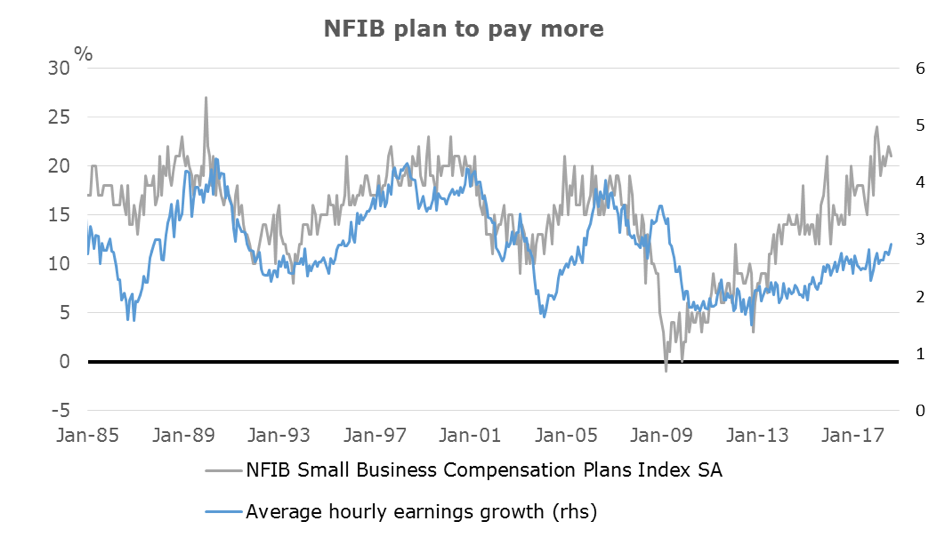
Perhaps we can look elsewhere for corroboration? What are businesses saying? Well businesses are saying they expect to put wages up the most in 35 years!
Ok, hopefully you accept that the pressures are building. Where to from here?
Well, what would normally be happening at this stage of the business cycle? With unemployment almost 1% lower than NAIRU, the Fed would be applying the brakes. The economy needs to slow down. If they are correct about NAIRU, it needs to slow enough to bring unemployment back to 4.5%. How would they do that? They would work out what is a “neutral” cash rate, a rate where they would expect rates to neither stimulate growth nor slow growth, and they would then set the cash rate a little higher so it slows growth. “Restrictive” monetary policy, rather than “accommodative” in central bank parlance. Are they doing that?
Not by a long shot. The chart below shows where the cash rate is in the US relative to the current best calculation of neutral(4). Policy today is 1% accommodative (orange line).
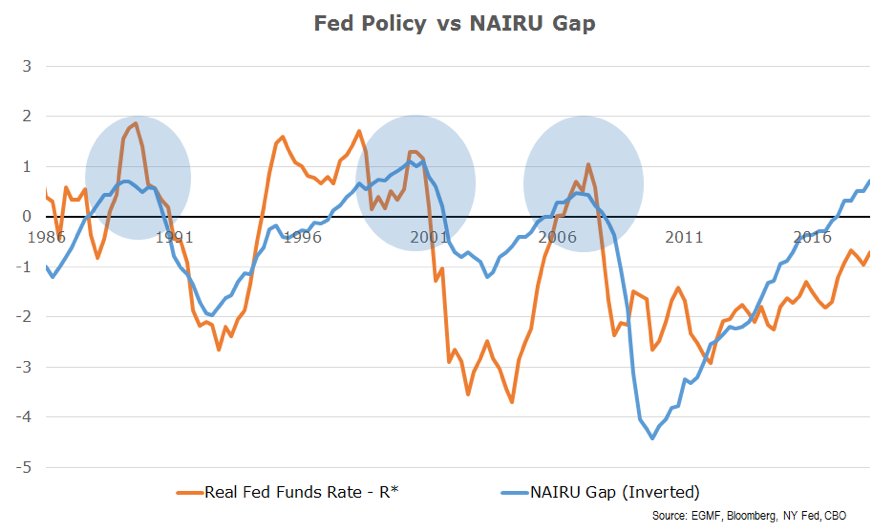
The blue line shows the gap between NAIRU and the current unemployment rate. Today the unemployment is 3.8%, some 0.7% below NAIRU (chart shows NAIRU-unemployment).
Now here is what I want you to really take away from this chart.
In the last 35 years, when unemployment was this far below NAIRU (shaded circles) the Fed had policy 1% restrictive. They were “leaning against” growth. Today they have policy 1% accommodative. They are still a “tailwind” to growth. What’s more? They expect to be a tailwind for another year. And they don’t expect to lean against growth for another year after that. Might one say they are two years behind where they would normally be at this stage of the cycle?
A few other observations: look at 1994. Look how quickly Greenspan took policy restrictive as the unemployment rate approached NAIRU. He hikes 300 basis points in 12 months. And no recession. In fact the only mid-cycle slowdown the Fed has ever engineered. Why? Because he stabilised the NAIRU gap near zero.
And when we consider the easing Greenspan did in 1998 to protect against the Asian crisis, note where he was coming from. Policy was already restrictive. Much harder to justify easing this time with policy this accommodative.
And finally, note the 2004-6 hiking cycle. The move too restrictive looks sharp by today’s standards. Yet it was widely criticised in hindsight as being too slow and a key contributor to the housing bubble in the US and…well... Credit bond bubble anyone?
But wait. Don’t forget the steak knives. Trump’s tax cuts are boosting growth at exactly the same time fiscal policy would normally be leaning against growth.
It’s not an understatement to say this is unprecedented in post WW2 history.
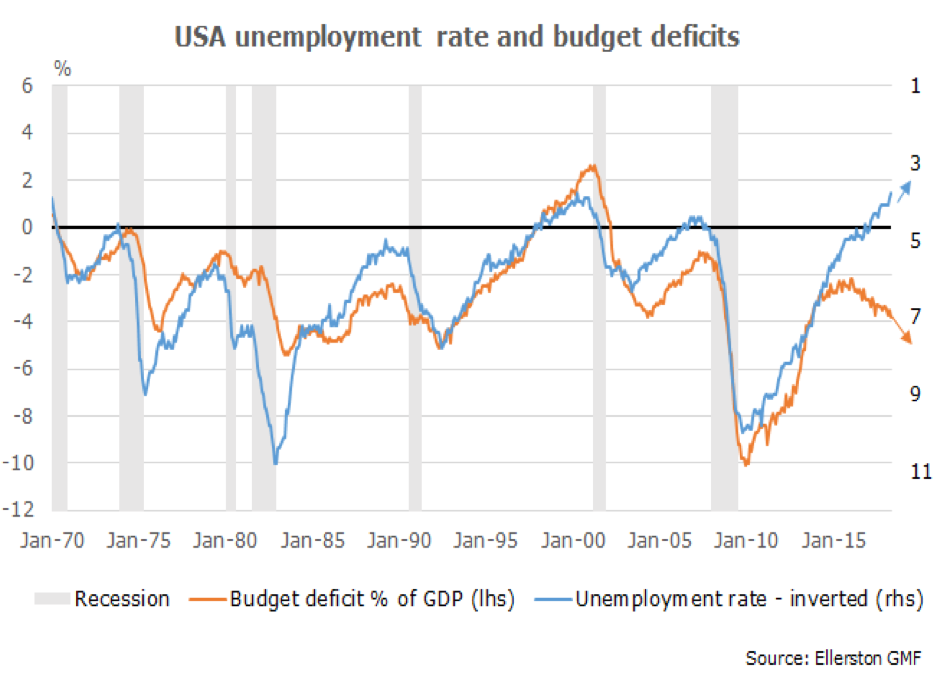 It really is like watching a slow motion train crash!

Incidentally, the last time the Fed was this far behind being restrictive was the late 1960’s. That’s the last time the Fed lost control of inflation. For two decades…

Powell was at pains to dismiss this analogue in his July speech as I noted last month.(5) But to me it was very unconvincing, for the simple reason they also thought inflation expectations were well anchored in the 60’s.
The other point Powell made was it is very difficult to estimate NAIRU in real time. With the benefit of hindsight, they underestimated the negative NAIRU gap in the 60’s, and overestimated it in the 90’s.
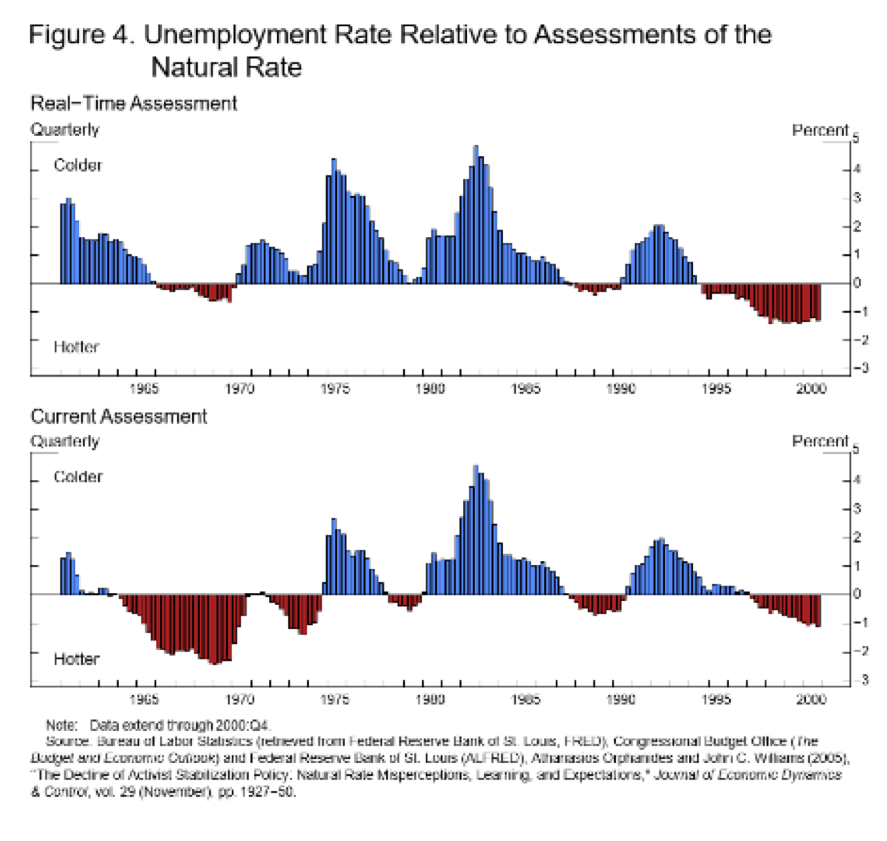
Thus he argues if one can’t be sure of the estimate of NAIRU, one must move cautiously, as Greenspan did in 96/97. Perhaps though, it also depends on whether wrong is too high or too low. In the 90’s, Greenspan made the right call. In the 60’s, Martin didn’t. Recent Fed work(6) suggests if you can’t be sure, pay attention to the rate of change of unemployment. That would strongly suggest they should push on with rate hikes.
We are very convinced that if the tariff war de-escalates, the Fed will have to deal with an over-heating economy.
So how do we play it? We play the odds. We look for good risk/rewards for escalation, and good risk/rewards for de-escalation.
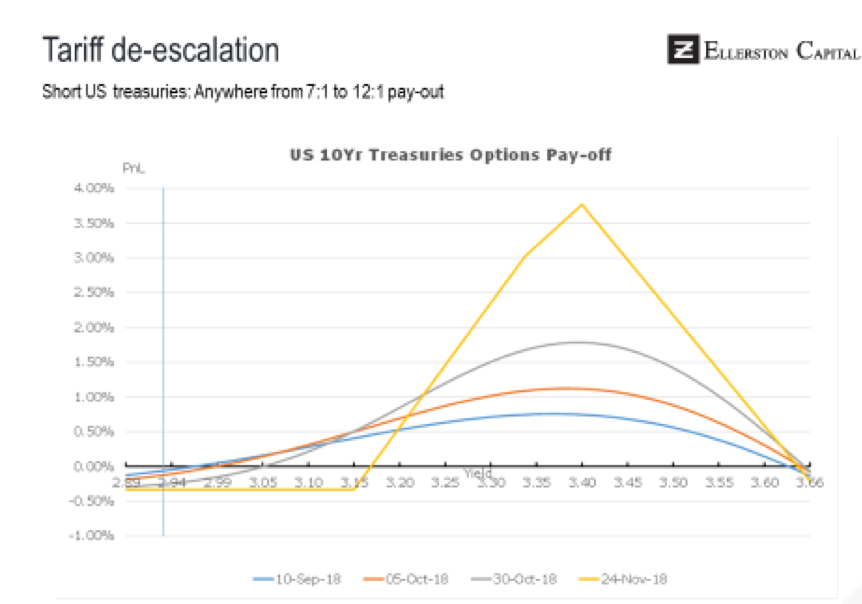
For de-escalation. We are;
- Positioned in options for 4 to 5 Fed hikes to be priced through the end of 2019. Risk reward 4:1
- Positioned in options for 10 year yields to move to 3.25-3.5 by year end. Risk reward 8:1 (chart below)
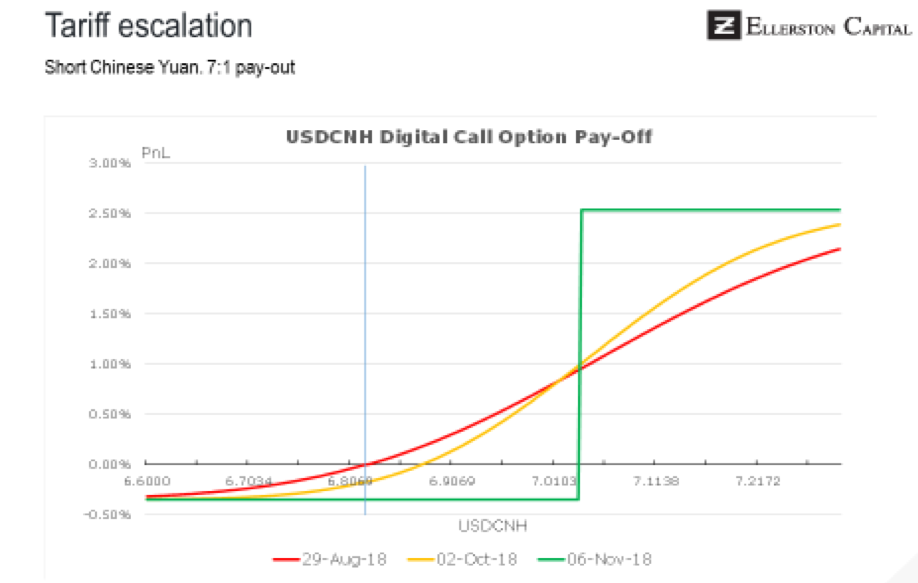
For escalation, we are;
- Short Chinese Yuan in options. Risk reward 7:1 (chart below)
- Long USD basket of currencies in options(7)
Note we hold option positions for both scenarios. Our risk is neither happens, and we lose the option premium. Our best scenario is a sustained (2 months) escalation in tariffs, or a sustained de-escalation. Then the options we have will do their best work.
We also are playing relative growth.
We expect the Australian and Canadian economies to out-perform the New Zealand economy, and we have positioned in the rate and currency markets to reflect that view.
Perhaps more on that next month. It is going to be a very interesting end to the year in financial markets…
Further Insight
Investing with a macro view, will take advantage of themes that do not rely upon positive market performance. Find out more here
-------------------------------------------------------------------------------------
(1) In response to the US placing nuclear missiles in Turkey three months earlier
(2) (VIEW LINK)
(3) Law, Economics and Game Theory. John Cirace p120
(4) (VIEW LINK)
(5) (VIEW LINK)
(6) (VIEW LINK)
(7) USD v Singapore dollar, Australian dollar and Indonesian Rupiah
Never miss an update
Enjoy this wire? Hit the ‘like’ button to let us know.
Stay up to date with my current content by
following me below and you’ll be notified every time I post a wire
Brett has worked in the financial services industry for over 28 years. Most recently he was Head of Global Macro at Ellerston Capital. Prior to that he spent over 10 years as Senior Portfolio Manager at Tudor Investment Corporation.

Brett Gillespie
Investor
Global Macro
Brett has worked in the financial services industry for over 28 years. Most recently he was Head of Global Macro at Ellerston Capital. Prior to that he spent over 10 years as Senior Portfolio Manager at Tudor Investment Corporation.
Expertise
Brett Gillespie
Investor
Global Macro
Brett has worked in the financial services industry for over 28 years. Most recently he was Head of Global Macro at Ellerston Capital. Prior to that he spent over 10 years as Senior Portfolio Manager at Tudor Investment Corporation.
Expertise
Comments
Comments
Sign In or Join Free to comment