No second COVID-19 wave, but first waves in some US states and developing countries are long and strong...
We've always argued that while sporadic outbreaks are likely, bona fide "second waves" in regions that have embraced a proper containment strategy are very unlikely. All the data to date supports this hypothesis. Nonetheless, with equity markets in free-fall on the back of second wave concerns, it is worth revisiting Coolabah Capital's proprietary COVID-19 tracking systems. This analysis reveals a few insights:
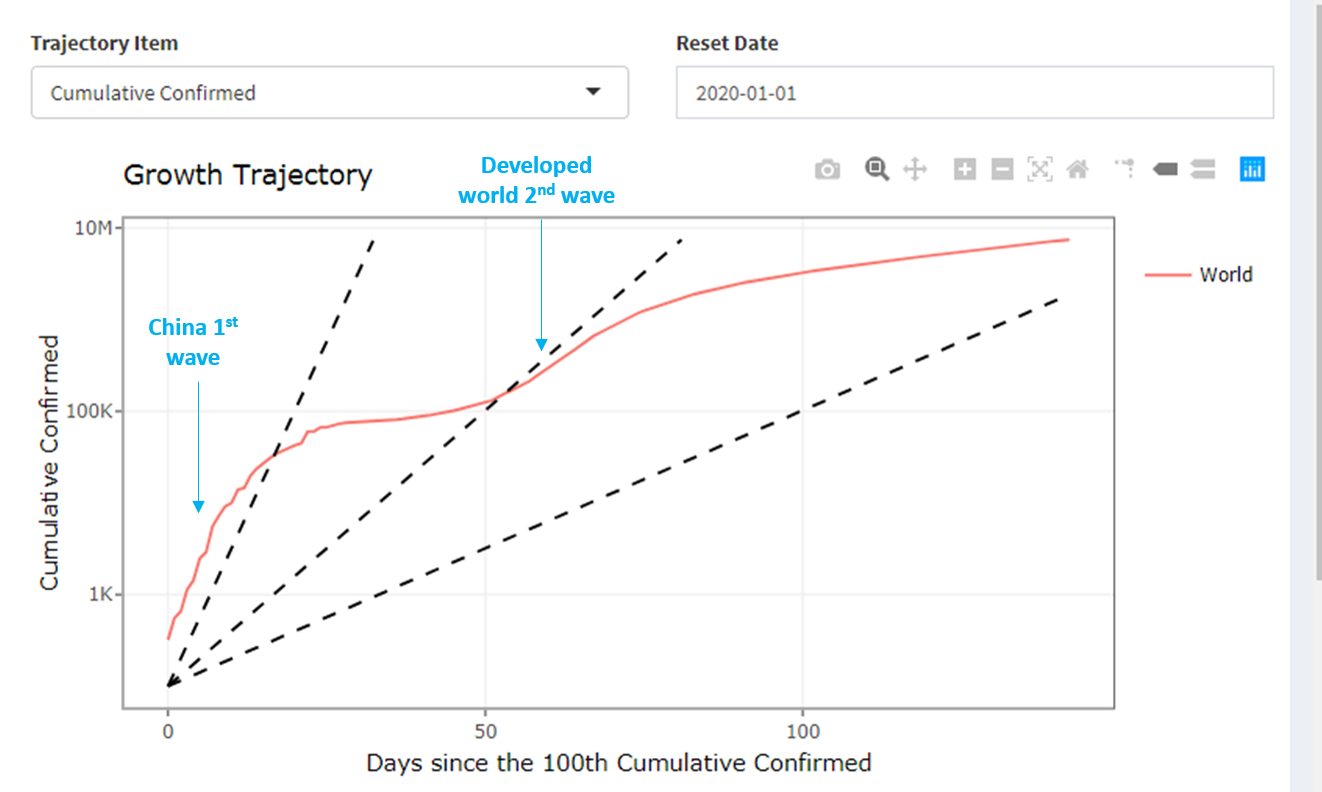
- There is no evidence of secular second-waves within any entire country, but there is clear evidence of second and third waves at a global level simply because COVID-19 takes time to propagate from nation to nation. In Coolabah's global curve you can see the first wave as China comes online and then flattens her curve followed by a second wave as the developed world catches COVID-19. We are now probably experiencing a third global wave as developing countries struggle to contain it. I will return to the developing world later.
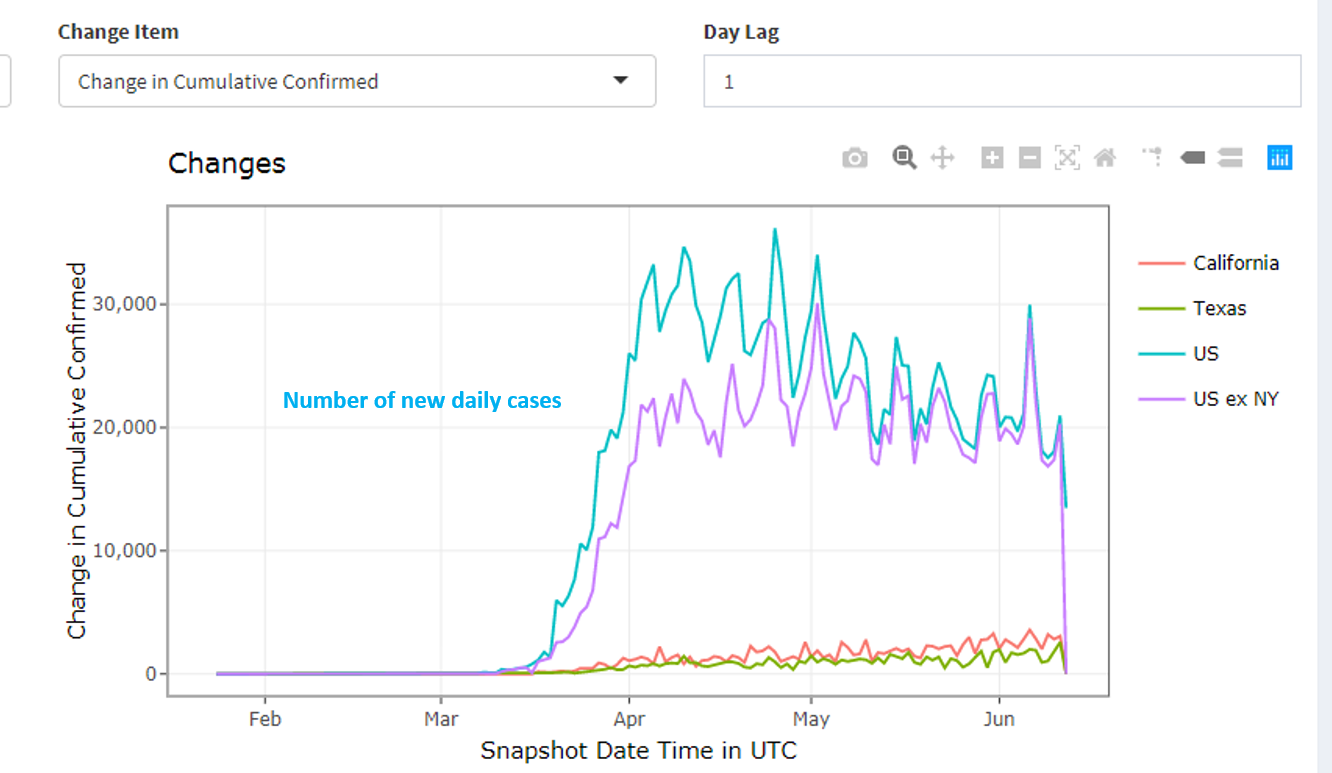
- While US infections peaked in early April as Coolabah originally forecast---and the US national and US ex-New York curves have since been flattening (top two lines in chart below)---they have not flattened like the curves of many other advanced economies such as Australia, New Zealand, South Korea, China, Germany, France, Italy, Taiwan, and the UK, to name a few. This appears to be a function of the much larger and federated structure of the US whereby early outbreaks in one state like New York have been subsequently followed by other states on a lagged basis, which means that the overall US infection numbers have been slower to decline over time.
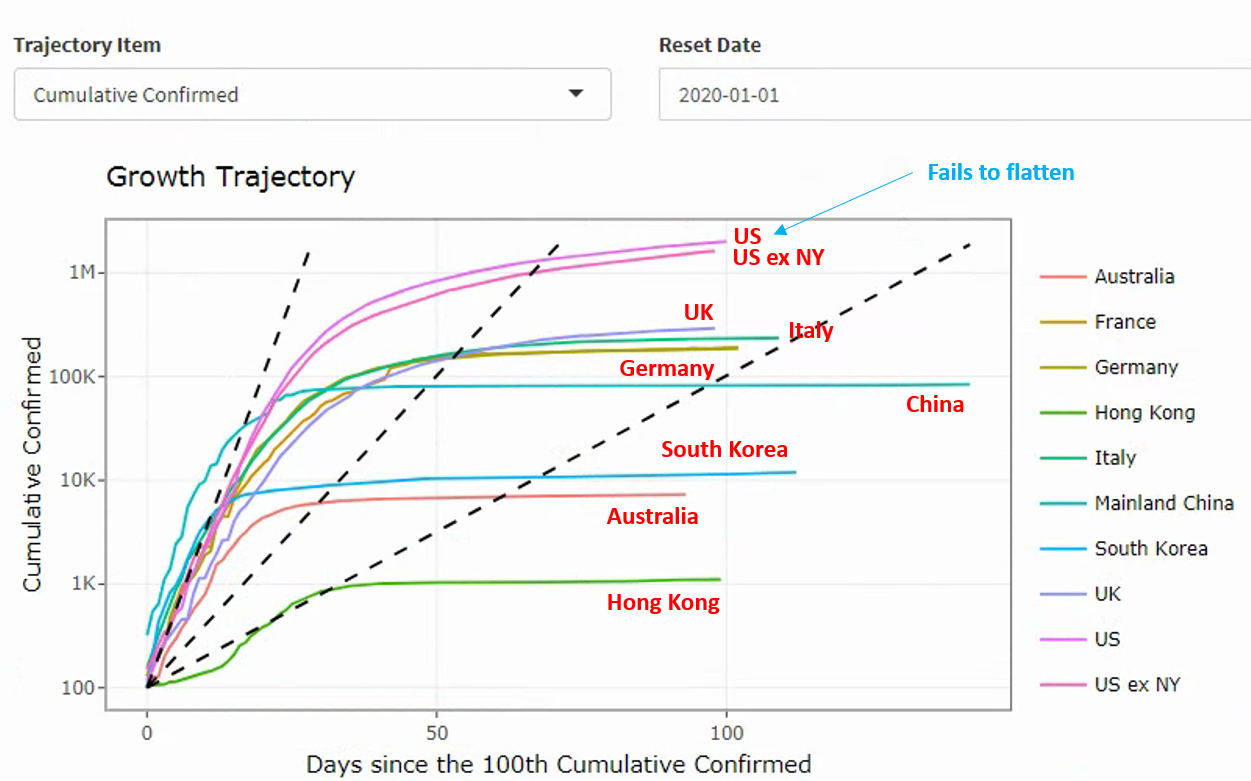
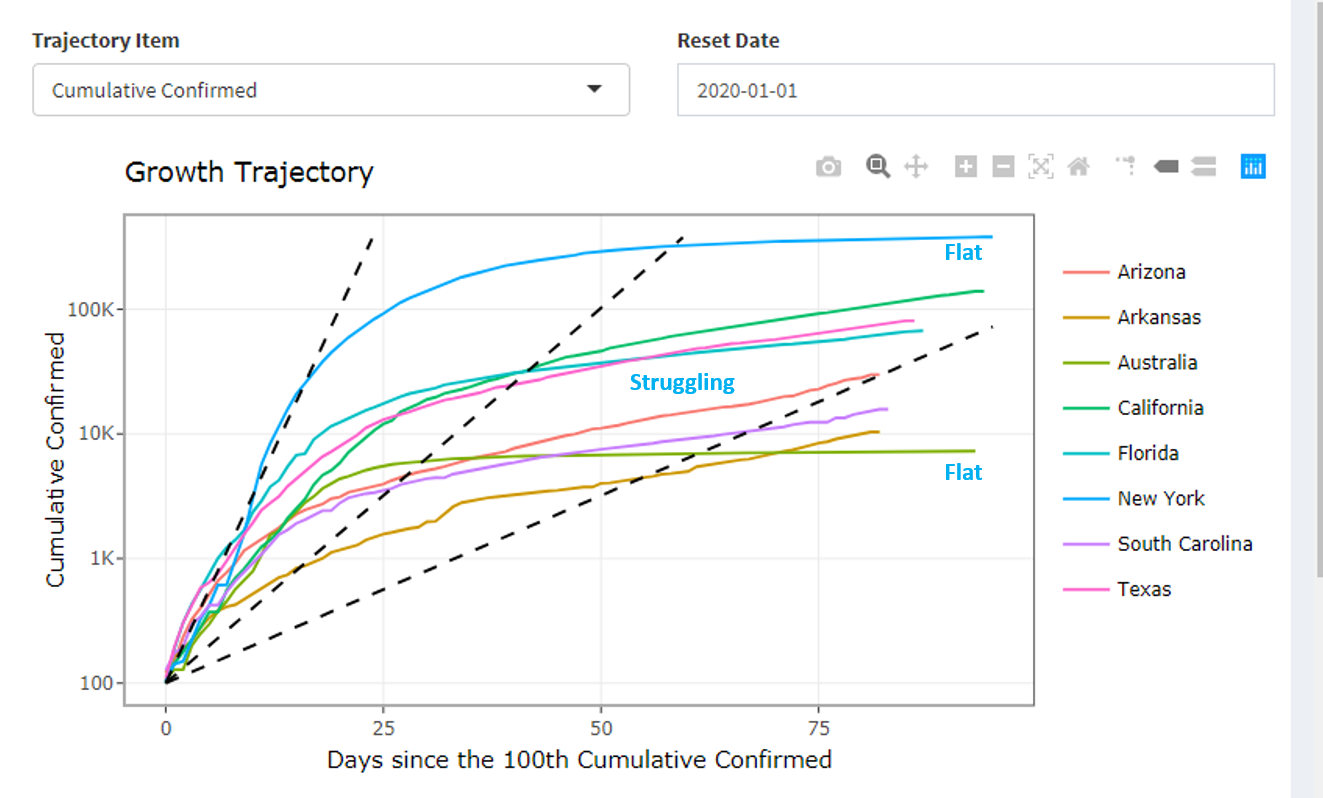
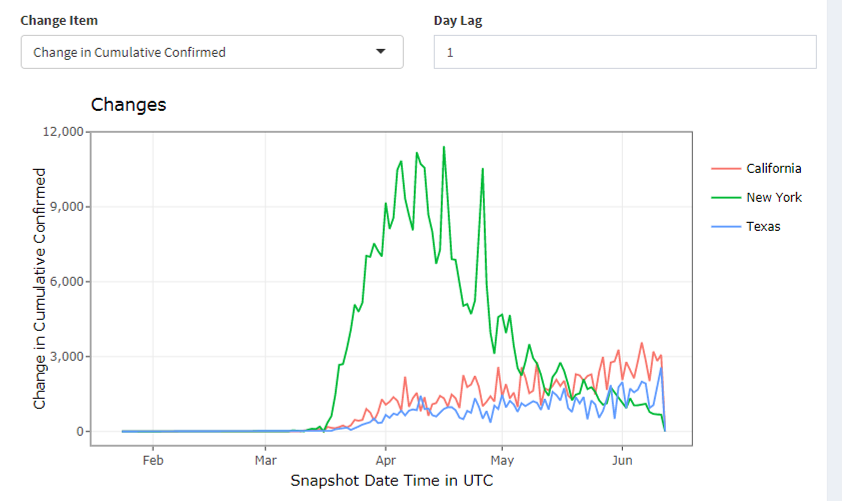
- It is also very clear in the US that some states have wittingly or unwittingly done a poor job of containment, which again is not that surprising: it was always likely that there would be patchy state-by-state containment results depending on the policies (and politics) of the individual state governors. For example, whereas New York (top blue line in chart below) appears to have done a very good job flattening its curve, others such as California (really poor), Texas (really poor), Florida, Arizona, Arkansas, and South Carolina have not. It should be noted, however, that the early outbreak in New York was much worse than these other states, which means New York has only done better after a far more severe initial crisis.
-
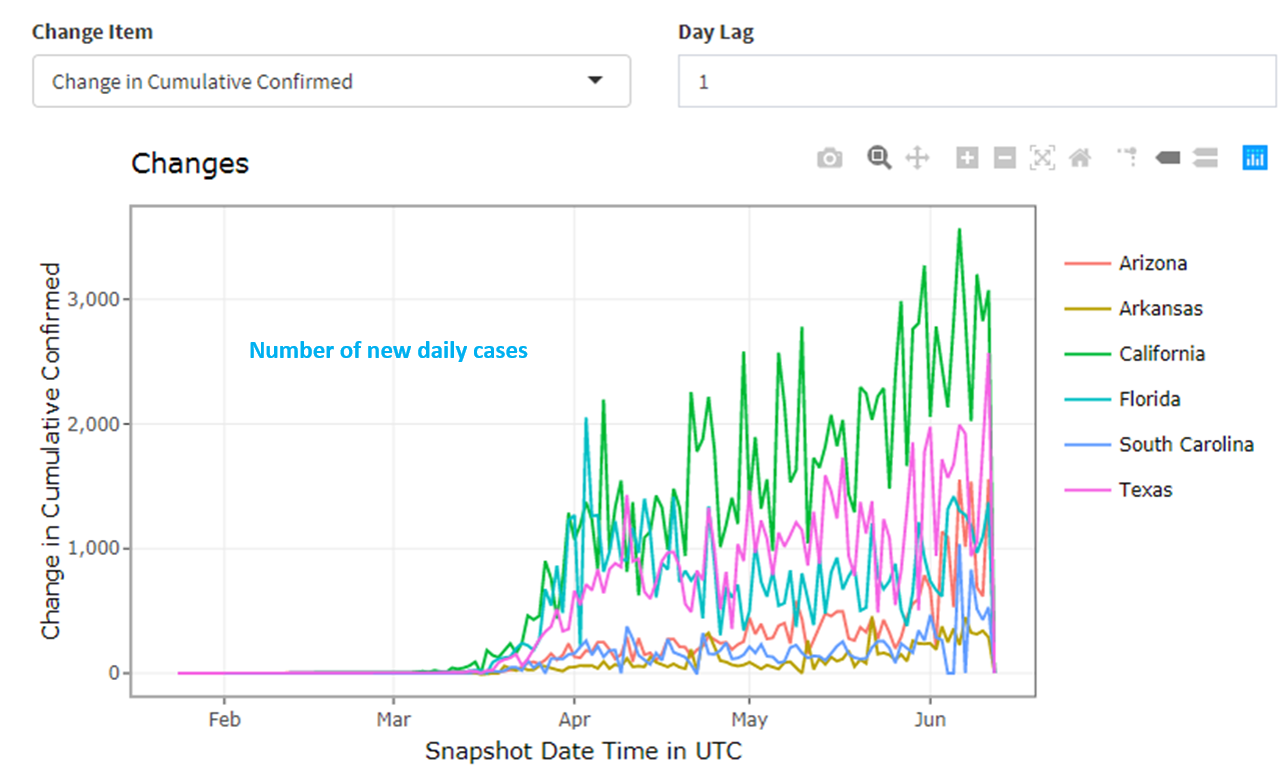
It is not really a case of second waves in these states, but rather an outright failure to contain COVID-19 in the first place and properly flatten their curves, which has led to either consistent increases in the number of new cases and/or recent surges. Put differently, the first wave has been longer and stronger. (And there may be some impact from the George Floyd protest movements, which has junked social distancing measures.) This is evidenced in the daily number of new infections across different states, which is highlighted in the first chart below. In the second chart we juxtapose the number of new infections across the US in its entirety (and the US excluding New York) against California and Texas. This demonstrates that while the number of new infections in the US overall is slowly trending down (even excluding New York), there are state-by-state exceptions.
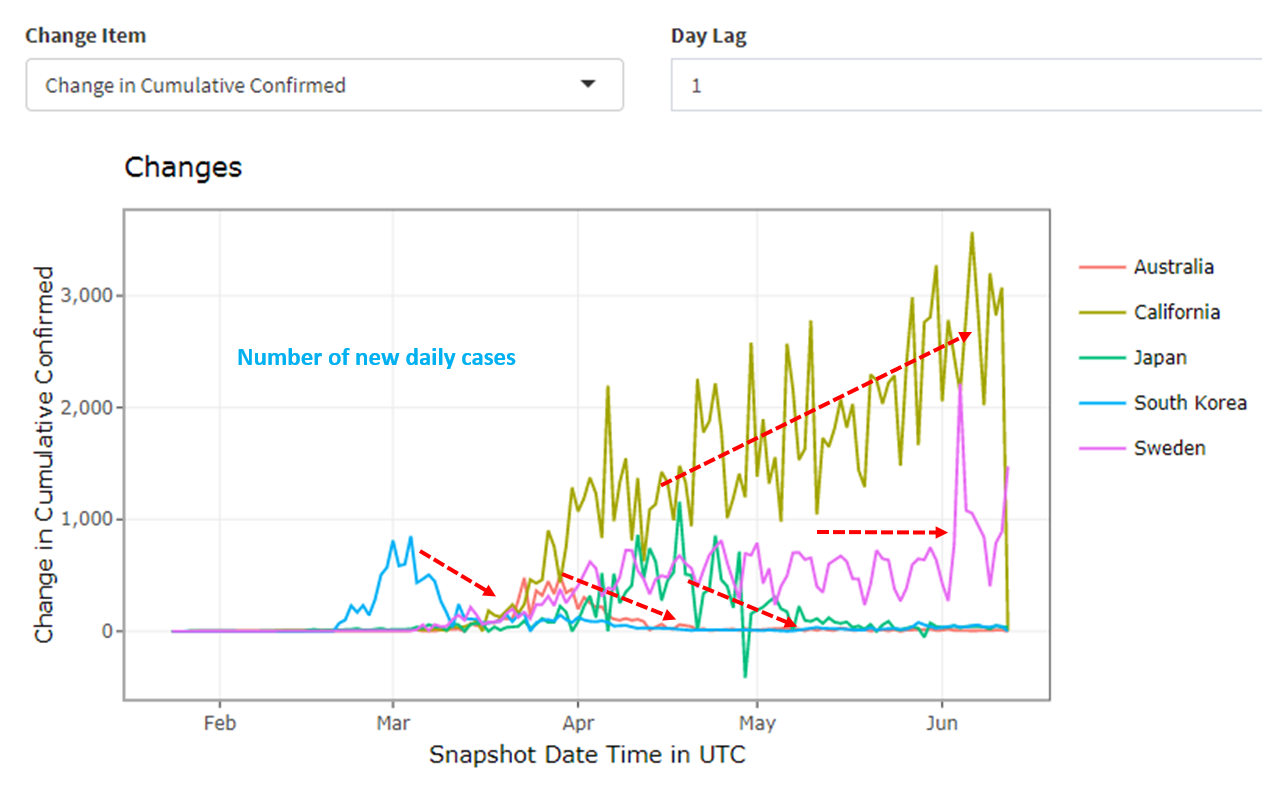
- Indeed, there are parallels between some US states, and the US more broadly, and Sweden, which has never tried to really suppress COVID-19 (or eradicate it). If we compare the number of new infections in Sweden to other countries like South Korea, Japan, and Australia (first chart below), you can see how COVID-19 has effectively disappeared after an initial spike in these nations whereas in Sweden (pink line) it has been tolerated with a consistent number of fresh cases over time (rather than a declining number of new infections as we see elsewhere). In fact, there is evidence of a recent spike in Sweden. If we then overlay California (top brown line), it looks like a very bad version of Sweden. One silver lining is that California and Texas are nowhere near as bad as New York was initially (see second chart below), albeit that New York's subsequent containment strategy has been much more effective in crushing new infections since its early spike.
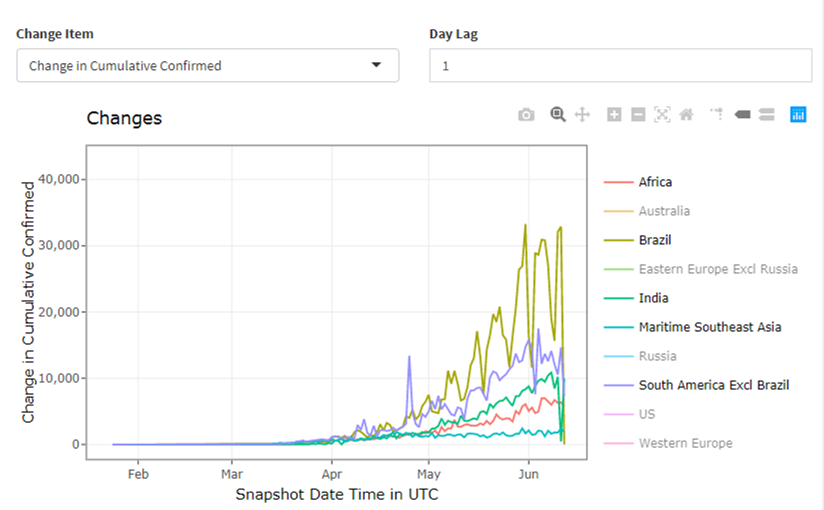
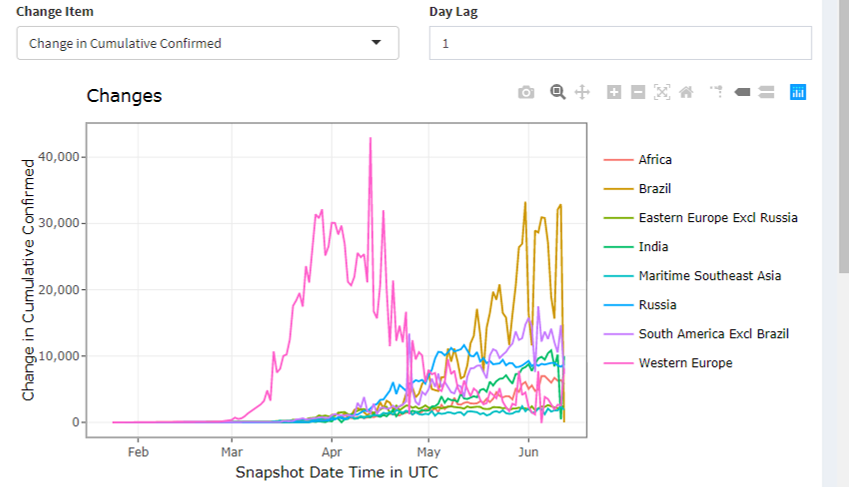
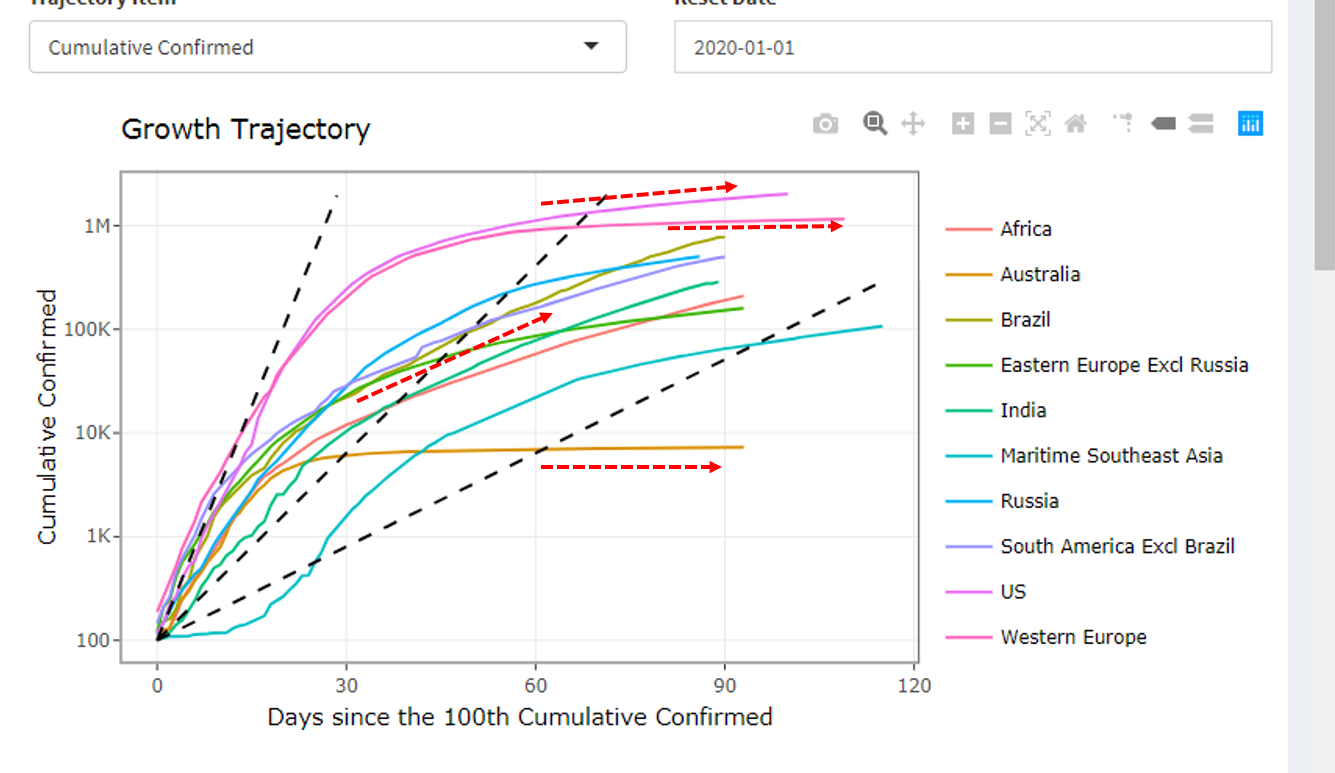
- Finally, we do observe a similar pattern in the developing world where new infection numbers are increasing in Africa, Brazil, India and South America (first chart) with no signs yet of a Western European-style crushing of new cases (second chart) or Russian-like stability (blue line in second chart). This means that cumulative infection curves are continuing to increase (third chart) rather than flattening hard as Australia (brown line in third chart) or Western Europe (second pink line from top in third chart) have done.
Building these real-time infection/fatality tracking and forecasting systems is no easy task, and I want to thank the 23 folks in my team, and the 11 analysts and five portfolio managers (including four PhDs) who have collectively contributed to this cause.
Get investment ideas from industry insiders
Liked this wire? Hit the follow button below to get notified every time I post a wire. Not a Livewire Member? Sign up for free today to get inside access to investment ideas and strategies from Australia’s leading investors.
Never miss an update
Enjoy this wire? Hit the ‘like’ button to let us know.
Stay up to date with my current content by
following me below and you’ll be notified every time I post a wire
Chris co-founded Coolabah in 2011, which today runs over $8 billion with a team of 40 executives focussed on generating credit alpha from mispricings across fixed-income markets. In 2019, Chris was selected as one of FE fundinfo’s Top 10 “Alpha Managers” based on his risk-adjusted performance throughout his career across. He previously worked for Goldman Sachs in London and Sydney, the Reserve Bank of Australia, and founded the award‐winning research/investment group, Rismark. He has regularly advised governments, developing unique policy proposals. Chris graduated with the University Medal (Economics & Finance) from Sydney University. He studied in the PhD program at Cambridge University in 2002/03, leaving to set up his funds business.
........
General Disclaimer:
Past performance does not assure future returns. All investments carry risks, including that the value of investments may vary, future returns may differ from past returns, and that your capital is not guaranteed. This information has been prepared by Coolabah Capital Investments Pty Ltd (ACN 153 327 872). It is general information only and is not intended to provide you with financial advice. You should not rely on any information herein in making any investment decisions. To the extent permitted by law, no liability is accepted for any loss or damage as a result of any reliance on this information. The Product Disclosure Statement (PDS) for the funds should be considered before deciding whether to acquire or hold units in it. A PDS for these products can be obtained by visiting www.coolabahcapital.com. Neither Coolabah Capital Investments Pty Ltd, EQT Responsible Entity Services Ltd (ACN 101 103 011), Equity Trustees Ltd (ACN 004 031 298) nor their respective shareholders, directors and associated businesses assume any liability to investors in connection with any investment in the funds, or guarantees the performance of any obligations to investors, the performance of the funds or any particular rate of return. The repayment of capital is not guaranteed. Investments in the funds are not deposits or liabilities of any of the above-mentioned parties, nor of any Authorised Deposit-taking Institution. The funds are subject to investment risks, which could include delays in repayment and/or loss of income and capital invested. Past performance is not an indicator of nor assures any future returns or risks. Coolabah Capital Institutional Investments Pty Ltd holds Australian Financial Services Licence No. 482238 and is an authorised representative #001277030 of EQT Responsible Entity Services Ltd that holds Australian Financial Services Licence No. 223271. Equity Trustees Ltd that holds Australian Financial Services Licence No. 240975.
Forward-Looking Disclaimer:
This information may contain some forward-looking statements. These statements are not guarantees of future performance and undue reliance should not be placed on them. Such forward-looking statements necessarily involve known and unknown risks and uncertainties, which may cause actual performance and financial results in future periods to differ materially from any projections of future performance or result expressed or implied by such forward-looking statements. Coolabah Capital Investments Pty Ltd undertakes no obligation to update forward-looking statements if circumstances or management’s estimates or opinions should change except as required by applicable securities laws. The reader is cautioned not to rely on forward-looking statements.

2 topics
Chris co-founded Coolabah in 2011, which today runs over $8 billion with a team of 40 executives focussed on generating credit alpha from mispricings across fixed-income markets. In 2019, Chris was selected as one of FE fundinfo’s Top 10 “Alpha...
Expertise
Chris co-founded Coolabah in 2011, which today runs over $8 billion with a team of 40 executives focussed on generating credit alpha from mispricings across fixed-income markets. In 2019, Chris was selected as one of FE fundinfo’s Top 10 “Alpha...
Expertise
Comments
Comments
Sign In or Join Free to comment
most popular
Investment Theme
If 24 LICs ran the Melbourne Cup, which ones would we back?
Affluence Funds Management
Equities
Buy Hold Sell: 5 ASX stayers built to go the distance
Livewire Markets