Reading The Tea Leaves With Big Data
Market corrections tend to follow a familiar pattern, and the current sell off is no exception. The first phase is the initial shock and sell off. In this case the shock was caused by a health crisis. The selling was indiscriminate across most asset classes and stocks. At one point the S&P500 was 32% below its peak. The second phase is a sharp recovery, as investors realise stocks have been oversold, but uncertainty remains. The third phase, and the one we are in now, is reality. Corporates are getting a better grip on how their earnings will be impacted, and are providing guidance. Poor economic data is being released. Expectations are being downgraded and rebased. The fourth phase, which we haven’t reached yet, is the establishment of a positive trend. The global economy starts to recover, albeit of a lower base. Companies start delivering on earnings guidance and can be more confident in their forecasts. Economic data starts to improve and markets start a sustained climb upwards.
The natural question is when will phase three be over, that is, when will expectations be fully rebased? First, the bad news. Poor economic data continues. In April, the US private sector cut 20.2 million jobs, which is 25 times the previous record. It points to an unemployment level of 16%. Retail sales in Europe fell by 11.2% between February and March, the fastest decline ever. European manufacturing activity expectations are the lowest ever. Chinese GDP fell 9.8% in the March quarter. Australian unemployment has risen from 5.2% to 6.2%, a good result you might say. However, it conceals the fact that the participation rate fell sharply. If so many people hadn’t given up looking for a job, unemployment would be 9.6%. But we knew this poor data was coming. It is not a surprise. If anything the data has been a little better than expected. In fact, this data is backward looking and there are signs the worst is behind us. Discussion around easing restrictions and reopening economies is now commonplace. Credit card data across developed economies shows spending is starting to pick up. 91% of Chinese businesses are back to work and pollution levels are returning to normal. It is not often we consider increased pollution as a positive. Australia just reported its largest monthly trade surplus ever due to exports of iron ore, gas, coal and rural exports making a welcome return.
Big data can be used to determine if the economy has reached the bottom. An analysis of data collected from the Apple devices of drivers, points to signs of renewed activity. Below are the graphs for South Korea, Germany, the US and Australia starting from January, as Covid 19 engulfed the world.
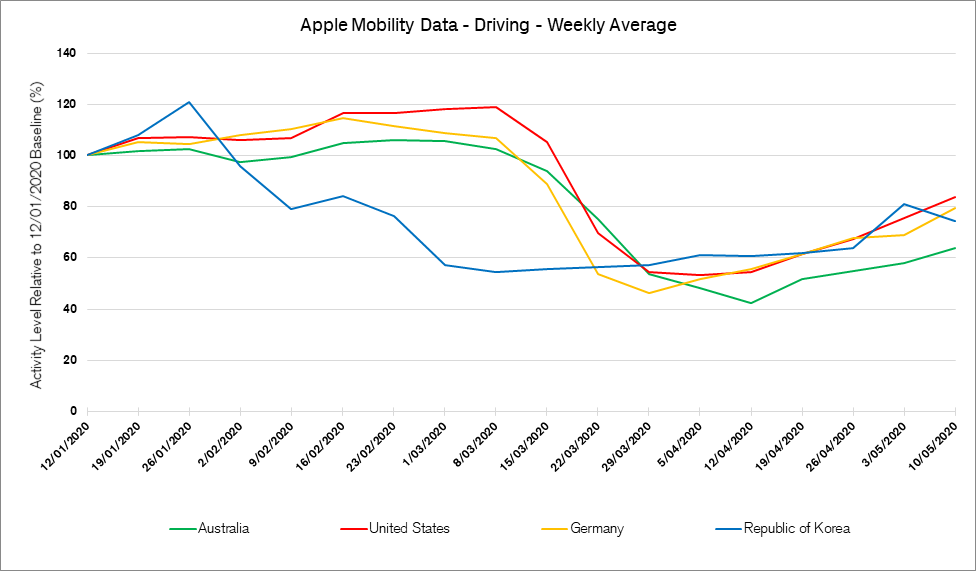
Source: Apple, Credit Suisse
From a steep decline in early March, the chart shows the world started travelling more from the weeks beginning the 23rd and 29th of March. This is a good indicator of people becoming less fearful of Covid 19. If consumers are on the move they are likely to be spending more and getting back to work.
Another way to measure fear of Covid 19, is how much attention it is receiving. Below is a graph of Google searches on the topic of Covid 19 and related words. It shows that searches peaked on 23rd March in Australia and the world, and in the US a week earlier. That date, the 23rd of March, appears to be an important day. It coincided exactly with the bottom in the US and Australian share markets.
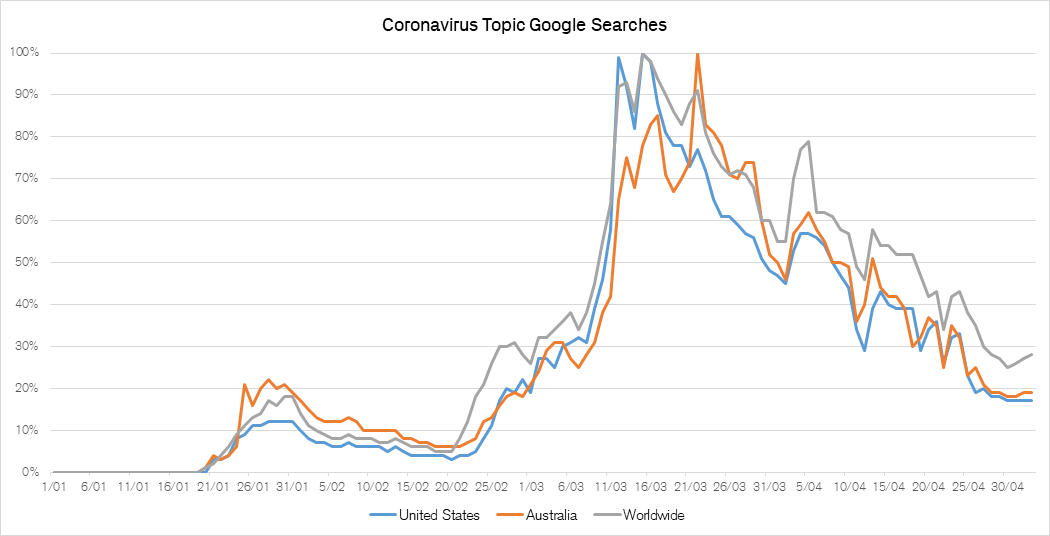
Source: Google, Credit Suisse
Our expectation is that as we progress through
June, the process of rebasing expectations will largely be done, and the global
economy and company earnings will be on the improve. A normalised positive
trajectory should be established in investment markets. That said, it would be
no surprise to see a short-term retracement of some of the share market gains
before we get to that point. Of course, the assumption we make is that the
Covid 19 curve keeps flattening in developed markets and remains flat in China.
Either that, or if a second wave of infection does come, the affected countries
are willing to accept the consequences of not going into a nation-wide lock
down. As a result we have been increasing portfolio exposures to equities and
Australian equities in particular. The ASX has not recovered to the same extent
as the US and shows better valuation support, particularly as our success in
controlling the virus means we can move forward with confidence. We still like
the global technology stocks which were already benefitting from the long term move to
automation, cloud computing and on line transacting, and benefit even more in a
post Covid 19 world. We balance our reasonably optimistic view on stocks with a
more than full allocation to bonds, particularly state government debt. Gold
also features in our portfolios as store of value in these uncertain times.
Never miss an update
Enjoy this wire? Hit the ‘like’ button to let us know.
Stay up to date with my current content by
following me below and you’ll be notified every time I post a wire
Andrew McAuley is a Managing Director of Credit Suisse Wealth Management Australia. As Chief Investment Officer, he is responsible for developing discretionary and advisory investment strategies across multi asset class portfolios for clients in Australia. He is also Head of Investment Solutions and Products.
Andrew has been investing on behalf of clients for over 24 years and was the founder of the Credit Suisse Discretionary Portfolio Management service in Australia. He has managed single and multi asset class portfolios for major superannuation funds, institutions, ultra-high net worth individuals, not for profits and private clients and is Chairman of the Australian Investment Committee.


Andrew McAuley is a Managing Director of Credit Suisse Wealth Management Australia. As Chief Investment Officer, he is responsible for developing discretionary and advisory investment strategies across multi asset class portfolios for clients in...
Expertise
Andrew McAuley is a Managing Director of Credit Suisse Wealth Management Australia. As Chief Investment Officer, he is responsible for developing discretionary and advisory investment strategies across multi asset class portfolios for clients in...
Expertise
Comments
Comments
Sign In or Join Free to comment