Telstra Revisited
When Merlon was established in 2010 and we first formally reviewed Telstra, the stock was trading at $2.64. The top down (and perhaps consensus) view at that time was that the company faced enormous structural challenges stemming from the ongoing decline in fixed line voice services, intense competition in mobile and broadband, and the loss of its monopoly position as provider of last mile access to 9 million homes and small businesses. At that time, we valued Telstra at between $3.20 and $4.35 per share.
Fast forward to 2017 and not a lot has changed, least of all our valuation of Telstra shares which currently stands at between $2.70 and $4.35 per share. Taking into account the stock’s high dividend yield over the intervening period the shares have delivered a total return on our initial valuation in line with our standardised equity discount rate of 12 percent.
Nonetheless, the poor performance of the stock in more recent years has prompted questions from many of our clients and stakeholders so we thought it might be worthwhile outlining our current thinking.
Case study: US railroad industry
By the mid-1950s the US railroad industry was already in decline before being hit with its own equivalent of the National Broadband Network (NBN) in the completion of the interstate highway system creating severe competition from the trucking industry and reduced passenger travel. At the same time, airlines were taking almost all long haul passengers away from the railroads.
Nevertheless, since 1957 railroad stocks have outperformed not only the airlines and trucking industries but also the S&P 500 index itself. This occurred simply because the “top down” issues facing the industry were well and truly factored into investor expectations and only small improvement was necessary for these companies to beat such a dim outlook.
And better times were coming. In 1980 there was a major deregulation of the railroads that spurred consolidation and greatly increased their efficiency. Despite falling revenues, rail productivity has tripled since 1980, generating healthy profits for the carriers.
The lesson: An industry in decline can offer good returns if investor expectations are sufficiently low. If such a firm can halt its decline – and pay dividends – its shares can deliver excellent returns.
The question with Telstra is whether expectations are sufficiently low.
Gauging market expectations
Comparing a company’s share price with some measure of intrinsic value can give some indication as to whether market expectations are optimistic or pessimistic. Merlon’s preferred measure of intrinsic value is to compare a company’s enterprise (or unleveraged) value with its sustainable enterprise-free-cash-flow.
To give a guide to management’s expectation of Telstra’s “sustainable free-cash-flow”, Telstra’s most recent result presentation noted:
- Telstra generated “recurring core” EBITDA in the 2017 financial year of $10,068m;
- The recurring impact on 2017 EBITDA from the NBN is likely to be around $2.5 billion;
- The company is targeting a capital expenditure (capex) to sales ratio of around 14% from 2020.
Putting these pieces together one might conclude that the Telstra’s board and management expect the company’s enterprise-free-cash-flow to settle at around $2.5 billion.
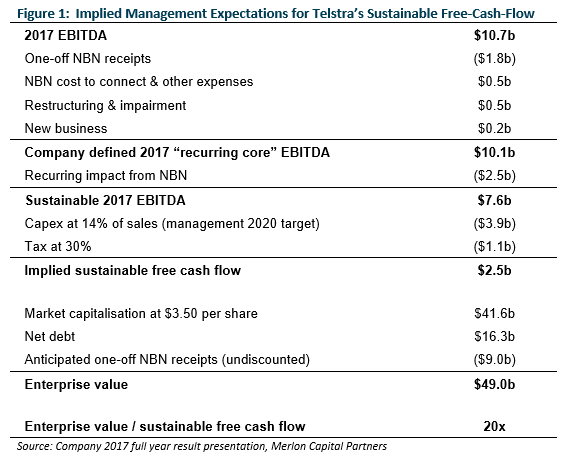
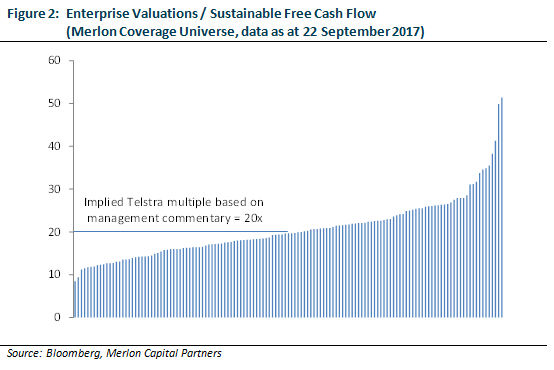
Taking into account anticipated one-off NBN receipts this would imply the company is trading on approximately 20x sustainable-free-cash-flow. This is hardly a bargain but in line with the median multiple for ASX200 companies under our coverage. This suggests to us that the market has largely taken management estimates of profitability and cash flow at face value.
Ignore the cash flow statement at your peril
As we persistently highlight, management teams and boards are becoming ever increasingly creative about how they define profitability. Some of the measures in Figure 1 are examples of this. “Recurring core Earnings Before Interest, Taxes, Depreciation and Amortisation (EBITDA)” is not a measure of profitability defined in any accounting textbook and guidance about the “recurring impact from the NBN” is an estimate at best and a guess at worst. We discuss this further below.
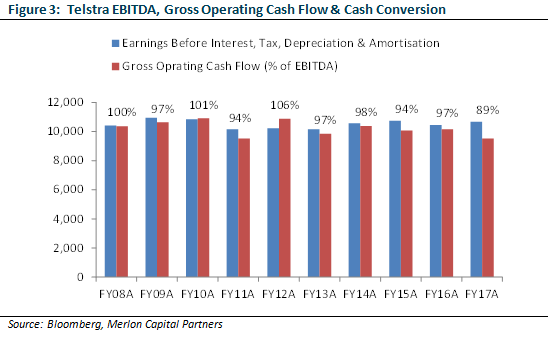
The bottom line is that management teams can define profitability however they choose but can’t as easily hide from the realities of the cash flow statement. Eventually these realities come home to roost and when this happens stocks with low earnings quality tend to underperform.
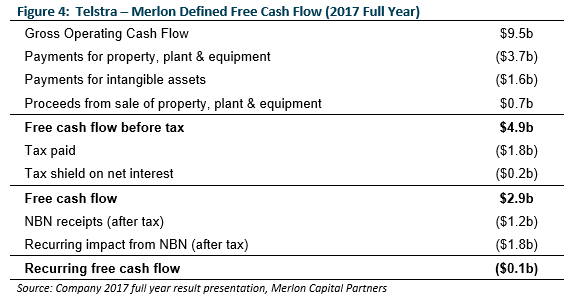
Along these lines it is important to note that Telstra’s earnings quality is poor. The company’s gross operating cash flow (“GOCF”) of $9.5 billion (which can be found on page 74 of the company’s annual report) bears little resemblance to the EBITDA figure of $10.7 billion quoted in Figure 1.
At Merlon, our focus is on the cash flow statement rather than measures of “advertised” earnings. Typically listed companies do a good job singing the virtues of such advertised metrics often with advisers, brokers, analysts, journalists and other commentators cheering on from the sidelines. Often these advertised metrics form the basis for variable remuneration prompting board members to join the chorus.
Focusing on the cash flow statement reveals a vastly different picture of Telstra’s continuing businesses. Had it not been for non-recurring NBN receipts and the network cost holiday being enjoyed ahead of NBN rollout, Telstra would have been in cash flow deficit during the 2017 financial year.
If nothing else, the above analysis highlights the significant work ahead of Telstra management to meet market expectations.
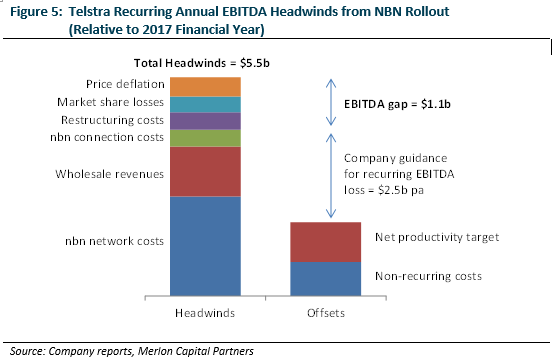
The NBN earnings gap
As highlighted in the tables above, management have indicated that “the recurring impact from the rollout of the NBN” is likely to be around $2.5b per year. Our analysis suggests that the ultimate outcome could be much worse than this. Key headwinds we highlight are as follows:
- Incremental NBN costs of approximately $2.5 billion per annum: The NBN’s corporate plan has the company achieving revenue of $5 billion in the 2020 financial year. We think it is reasonable to assume Telstra will account for 60 percent of this amount, or $3 billion. About $500m of this amount is already reflected in Telstra’s 2017 accounts so the incremental cost from here is likely to be about $2.5b.
- Loss of wholesale revenues amounting to approximately $1.3 billion per annum: Telstra currently generates revenues from wholesaling its products and renting out its network to other retailers such as TPG/iiNet, Vocus, and Optus. These revenues will not continue following the rollout of the NBN.
- Potential recurrence of NBN connection costs of around $0.4 billion per annum: Telstra has incurred significant costs in connecting customers to the NBN. While the company has excluded these costs from recurring earnings it is possible that a component these costs will prove to be ongoing due to normal customer churn.
- Potential recurrence of restructuring costs of around $0.4 billion per annum: Given the scale of cost reductions required to deal with the above items and the company’s history of incurring restructuring costs, it is likely that at least some component of restructuring will prove to be ongoing.
- Potential market share loss due to structural separation of network: Prior to the rollout of the NBN, Telstra enjoyed a monopoly position with regard to its ownership of the fixed line network. It is likely that the progressive levelling of the playing field as the NBN rolls out will see heightened competition and some market share loss for Telstra.
- Potential repricing of fixed line services: Telstra currently enjoys average monthly revenues per user of around $95 compared to more competitive offers in the market ranging from $55 to $75. It is likely that Telstra will see progressive price deflation with regard to its products.
Offsetting these factors Telstra has targeted annualised productivity gains of $1 billion by 2020 and is adamant that restructuring and cost to connect costs will not persist. Our analysis suggests that these aspects may not be enough to offset headwinds with an additional $1.1 billion of cost savings or additional revenues required to achieve the company’s ambition of limiting the recurring impact of the NBN to $2.5 billion.
Mobile pricing
The mobile division delivered a strong result in 2017, ahead of both our own internal and market expectations. A key driver of continued strong performance within this division has been Telstra’s capacity to maintain a meaningful price premium to its major competitors.
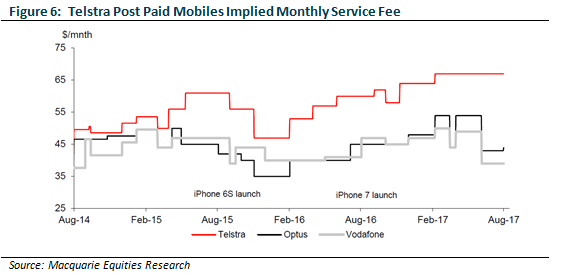
It would appear that the company has further increased its pricing premium since the result which may represent an earnings tailwind for the current period. We are cautious about the sustainability of this pricing premium and cautious about the sustainability of margins within Telstra’s mobile division. We believe Telstra’s network advantage is not as material as it was 5 years ago, particularly for metro areas. We note the entry of TPG into the market and we note the likely emergence of no-SIM mobile devices in coming years.
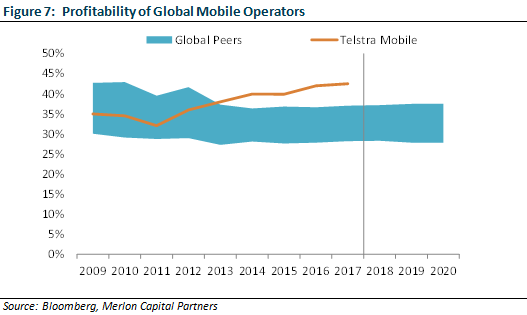
As we have discussed in previous commentaries, our investment process explicitly deals with industry structure and competitive advantage through our qualitative scorecard. We do not screen companies in or out of the portfolio based on these scores but believe deeply that returns on capital are ultimately determined by the qualitative characteristics of the industry and each player’s competitive positioning. High returns on capital support high cash conversion and hence have a direct impact on our assessments of sustainable free-cash-flow and valuations.
It follows that we have built some price deflation into our assessment of sustainable free-cash-flow for Telstra’s mobile division, although we accept that it is difficult to be too scientific about the quantum but directionally we feel that Telstra’s mobile returns will deteriorate over the next three to five years.
Capital intensity
At Merlon we apply a standardised approach to valuation for all investments based on our assessment of sustainable free-cash-flow. It follows that our valuations are highly sensitive to assumed levels of sustainable capital expenditure.
Our analysis of global network operators and telco resellers has consistently led us to conclude that Telstra’s capital expenditure should be significantly lower as a reseller of fixed line services rather than vertically integrated network operator and that Telstra spends an unusually high amount on capital expenditure.
It follows that we were shocked by the company’s announcement that it would be spending $15 billion in capex over the three years to June 2019. The company’s capex agenda is strikingly high when we consider that 27% of the company’s recurring revenue will come from fixed line services utilising third party infrastructure (i.e. the NBN).
Telstra have indicated to the market that it expects capex to reduce to approximately 14% of sales in 2020. Since the NBN was announced Telstra has had little incentive to invest in its fixed line network. It is also the case that Telstra’s Network Application Services (“NAS”) and Media divisions are much less capital intensive (and lower margin) than the rest of its businesses. As such, it is probably more appropriate to compare Telstra’s capex to its non-fixed line, non-NAS and non-Media businesses over this period.
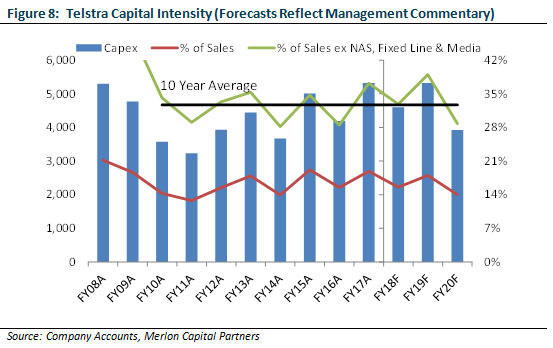
From this perspective, the company’s current capex budget appears historically high, although the 2020 guidance of 14% of sales is slightly lower than the experience over the past decade when excluding “capital light” segments.
What is clear to us is that Telstra is and will remain a highly capital intensive business with its core mobile and corporate/wholesale businesses historically absorbing between 30 and 40% of revenues in capital expenditure.
Fund positioning
It is clear to us that despite the recent share price fall Telstra is no bargain, even if management achieve what we believe are potentially optimistic targets. Poor earnings quality, headwinds related to the NBN, potentially unsustainable mobile margins and high capital intensity lead us to conclude there is probably downside to these targets and our base case valuation. As such, Telstra is not a core holding in the Merlon Australian Share Income Fund.
For more insights from Merlon Capital Partners please visit our website (VIEW LINK)
Never miss an update
Enjoy this wire? Hit the ‘like’ button to let us know.
Stay up to date with my current content by
following me below and you’ll be notified every time I post a wire
Hamish joined Merlon Capital Partners as a Principal in July 2010. He was previously Head of Research, Asia Pacific Equities at AMP Capital Investors. Hamish holds a MBA with honours from The Wharton School, University of Pennsylvania.

1 stock mentioned

Hamish joined Merlon Capital Partners as a Principal in July 2010. He was previously Head of Research, Asia Pacific Equities at AMP Capital Investors. Hamish holds a MBA with honours from The Wharton School, University of Pennsylvania.
Expertise
Hamish joined Merlon Capital Partners as a Principal in July 2010. He was previously Head of Research, Asia Pacific Equities at AMP Capital Investors. Hamish holds a MBA with honours from The Wharton School, University of Pennsylvania.
Expertise
Comments
Comments
Sign In or Join Free to comment