Trade Wars and the Peak of the Chinese Growth Model
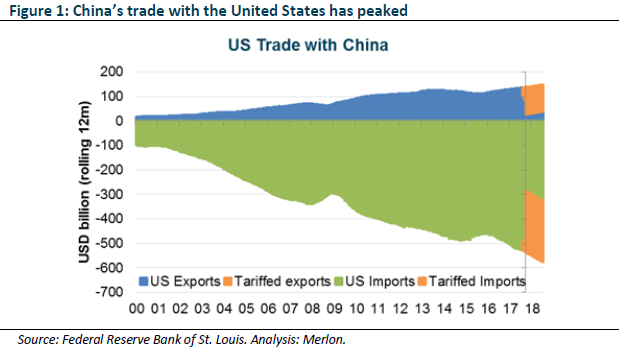
Snapshot: China’s export-led growth model is reaching its limits. While China’s exports grew rapidly from admission to the WTO in 2001, declining competitiveness saw China’s share of global exports peak in 2015. Now, tariffs imposed by the United States on around half of China’s exports, see further impediments to the continuation of the current model. China needs to transform to avoid the middle-income trap. But the rapid development of high tech industry is at growing risk of western world pushback. As such, a quick resolution to the current trade dispute appears increasingly unlikely, which is likely to weigh on commodity prices.
Clash of the titans
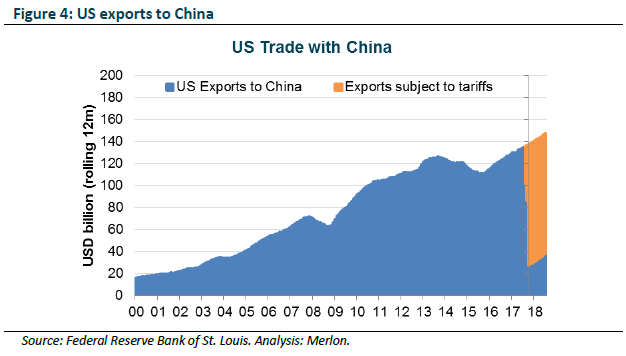
The United States and China are the world’s two largest economies. They are linked heavily by trade, with the US being China’s largest export customer. In contrast, China’s imports of US goods are modest in comparison, and have triggered a backlash in the form of tariffs, applied to around half of China’s US exports. In the latest round of tariffs applied, President Trump has threated to escalate further, applying tariffs of up to 25% on 100% of imports from China.
To understand how we got to this point, we need to understand China’s growth model and how it is becoming an economic and strategic threat to the US as well as other developed and emerging nations.
China’s Growth Model
China’s admission to the World Trade Organisation (WTO) in 2001 enabled China to transform its economy, which was mired in the aftermath of the Asian Financial Crisis and the end of a property boom. China’s abundant and cheap agricultural labour force migrated to the coast and manufactured low end textiles and clothing, as well as cheap assembly of electronic equipment. The Chinese economy saw a rapid increase in productivity, while lifting a large proportion of its population out of poverty. The development of a world leading export hub facilitated significant fixed asset investment, in the form of manufacturing plants, infrastructure and real estate.
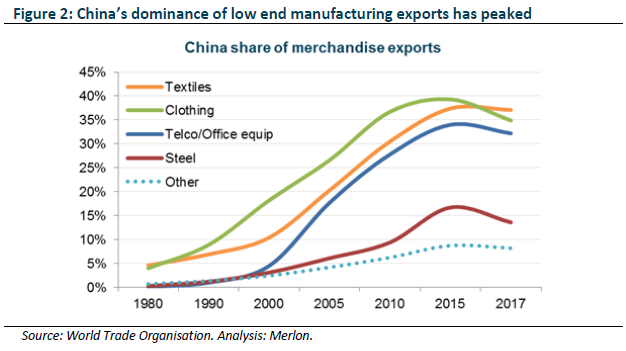
This phase peaked in 2015 as China’s cheap labour advantage was eroded by rising wages and ‘cheaper’ neighbours such as Bangladesh, Vietnam and Malaysia. Multinational corporations also sought to increase diversification given the concentration of activity that had built up in China since 2001. And now, we see the Trump administration applying tariffs to imports from China, a further impediment to the China growth model.
Leaping the divide
In light of China’s peaking export market share coupled with tariffs, how does the leader in low value-added manufactured exports move up the value-added chain? The answer is in the form of President Xi Jinping’s signature ‘Made in China 2025’ policy. The policy seeks to invest more than a quarter of a trillion US dollars into the development of industries including robotics, artificial intelligence, and biotechnology. These sectors will receive subsidies, preferential loans, free land and tax incentives. The policy targets 70% self-sufficiency across these segments, forcing Chinese buyers of the technology to purchase components domestically.
Foreign firms wishing to operate within China have been required to form joint ventures with domestic Chinese companies, and then share their intellectual property. It is through this mechanism that technology is acquired, enabling modernisation of industry and supporting China’s movement up the value chain. Local companies also receive government subsidies that create an un-level playing field for foreign competitors.
What Trump wants
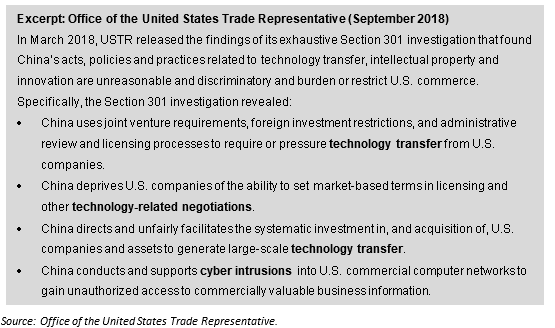
The United States Trade Representative’s 2018 investigation into China provides the justification for tariffs (see box below). Rather than trade deficits, each of the four points references the transfer of technology from the US to China.
As outlined above, the Made in China 2025 policy facilitates technology transfer and forced use of local company products. On a long-term view, this would be catastrophic to economies relying on heavy investment in technology to export globally, such as the United States, Japan, South Korea and Germany.
From this investigation, we can see how attacking China’s significant trade surplus with the US, through the implementation of tariffs, Trump is applying pressure on China to change its current forced technology transfer practices, as well as the uncompetitive aspects of its Made in China 2025 plan. It is also relevant to note an unintended consequence of this pressure, which has been to disrupt China’s more immediate goals of deleveraging, rebalancing and reducing pollution.
China – rebalance interrupted
More than 40% of China’s GDP is fixed asset investment, around double global averages. Much of this investment has been via debt funding, resulting in rapidly escalating leverage.
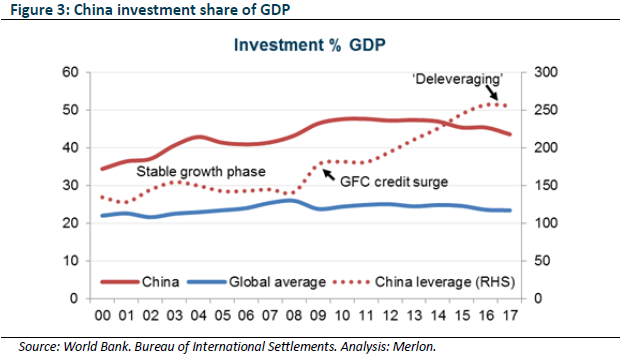
China’s 2017 effort to reduce this credit-fuelled fixed asset investment dependency, via rebalancing and deleveraging, was supported by growth in exports and rising domestic consumption. In 2018, however, China’s policy objectives have been disrupted by Trump’s trade policy, which is reducing the ability for exports to support a deleveraging economy. China’s response to these trade risks may see its rebalancing efforts thwarted and potentially reverse, exacerbating imbalances authorities are keen to address.
China – how to respond
The trade war launched by Trump occurred at a time when China was beginning its transition from debt-driven investment to a more sustainable path. Now, however, the pressure on exports will likely see a reversal of prior policy objectives. Following are the key options for addressing Trump’s tariffs.
Retaliate?
China’s like-for-like retaliation options are limited by the significantly lower volume of imports it purchases from the US and the fact that retaliation to date is already close to the maximum available.
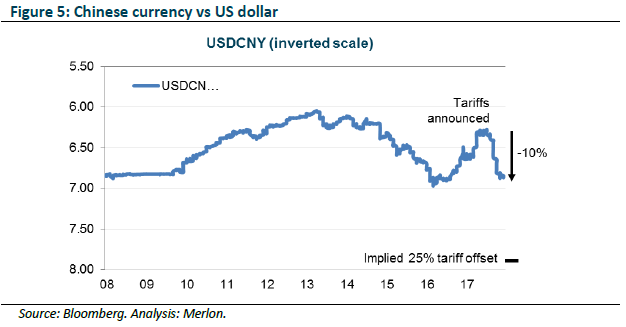
Depreciate?
The Chinese yuan has depreciated by around 10% since tariffs were announced by Trump, largely offsetting the tariff. Using the currency to offset any escalation by the US to the full 25% tariff rate would require the currency to depreciate by a further 15% to USDCNY8, an unprecedented level in recent history. Beijing would be reticent to allow the currency to fall to these levels given the risk of capital outflows and further currency instability. Further, the cost impact on imports, such as oil, would see politically unpalatable inflationary pressures domestically.
Stimulate?
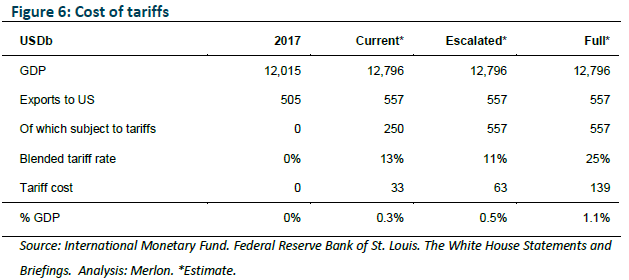
China’s 2017 deleveraging policy has been upended by Trump’s tariffs. But what is the real cost of tariffs and how significant is this relative to the scale of the Chinese economy? The table below shows that current tariffs cost USD33b, 0.3% of China’s economy. It is perhaps no coincidence that China’s National Development and Reform Commission (NDRC) approved this level of new fixed asset investment in September.
This cost increases to USD139b if the full 25% tariff rate is applied to the entirety of imports from China, or 1.1% of China’s economy if exports decline by an equivalent amount to the tariffs.
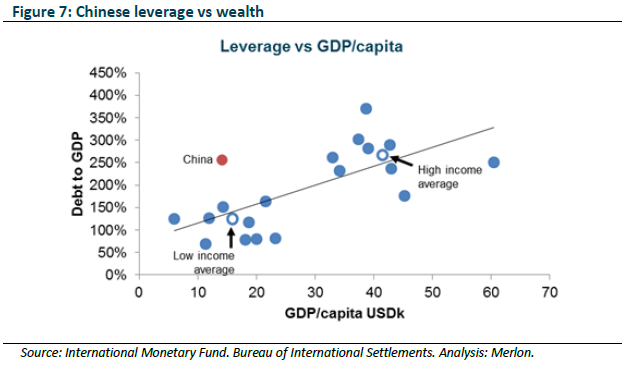
Constraining China’s ability to fully offset a full tariff scenario is that it doesn’t have the per capita income to support the current levels of debt, even before adding an additional USD100b-plus required to offset a full tariff scenario. Further, as China’s leverage ratio is already on par with high income economies, using further expansion of leverage to achieve high income status is constrained.
The likely strategy is a combination of the above three options, with maximum retaliatory tariffs, limited further currency depreciation and a potentially risky ~USD100b stimulus package.
Outlook: whatever happens, it’s unlikely to be quick
The multi-faceted objectives of Trump’s administration, coupled with the political differences between the US and China are unlikely to result in a quick resolution. The longer a resolution takes to achieve, the less confidence businesses will be in making investment decisions, impacting capital spending and demand for commodities.
Given the broader concerns around forced technology transfer, any trade-related concessions offered by China are unlikely be sufficient to achieve a resolution. Trump is more likely to be driven by changes to industrial policy, seeking provisions made to remove the forced hand-over of intellectual property of US businesses operating in China. This may be enhanced via pressure on strategically important US firms ‘reshoring’ Chinese operations back to the US.
Given how important technology is for China’s ability to maintain growth and grow per capita incomes, as well as continuing to develop its military capabilities, this is a concession that may be hard to achieve. As the world’s largest consumer of commodities, the trade war will remain an overhang on commodity prices throughout its duration. However, longer term trends will remain driven by China’s need to rebalance from investment to domestic consumption.
Australia: trade exposed, but diversified
How exposed is Australia to a trade war between the US and China? Australia is a large exporter of resources and energy products, with China the largest buyer of these products.
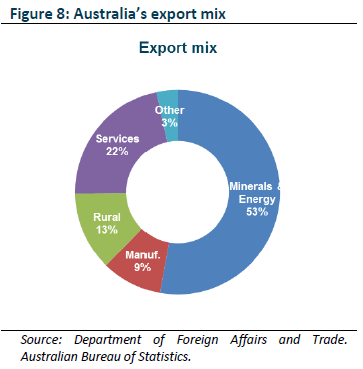
Yet the diversified nature of Australia’s economy means that the resources and energy sectors directly account for less than 10% of Australia’s GDP.
The chart below isolates the direct commodity exposures of the Australian economy potentially impacted by a trade war. There are also indirect exposures as commodity related industries generate economic activity across other sectors.
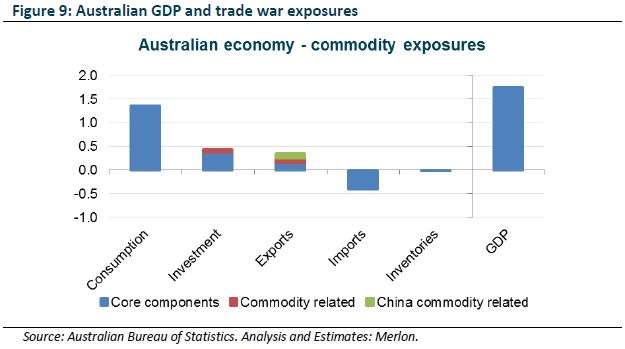
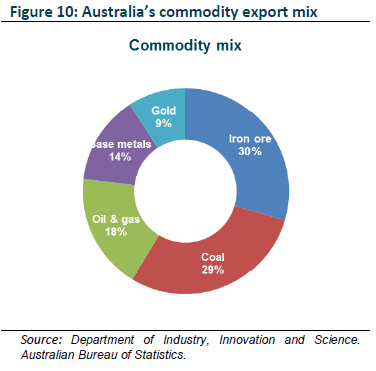
Again, we expect the rebalancing, deleveraging and maturing of the Chinese economy to be a more significant influence over time than the trade war. Of the specific commodities exported by Australia, the declining investment intensity of China’s economy, coupled with a focus on less carbon-intensive steel recycling, will likely see declining demand for iron ore. Conversely, this focus on cleaner energy will see increased demand for gas, exported by Australia as LNG.
This dynamic will likely see Australia remain the world’s largest exporter of iron ore, albeit at lower levels, and potentially become the largest exporter of liquefied natural gas.
Again, while Australia is a large commodity exporter, its diversified economy means volatility in these markets has less of an impact than in other commodity exporting nations.
Impact on commodities
The surge in commodity prices over the past decade has been a direct result of the effects of China’s admission to the WTO and associated rapid growth of its export sector. Industrial commodities are direct inputs to the infrastructure constructed to support this sector. The next phase of economic development is unlikely to be as commodity intensive. While we expect the trade war to be an overhang on commodity pricing for the duration of the dispute, there is divergence across the major markets.
Fund positioning
Merlon’s investment approach values companies on the basis of sustainable free cash flow as opposed to current cash flow. For mining and energy companies, the key drivers of sustainable free cash-flow are price, margin and capital expenditure. While the trade war is seeing pressure on some commodities, over the longer term we expect more fundamental supply and demand factors to dominate prices as outlined previously. We will now analyse how these factors affect energy and resources companies, using BHP, the world’s largest miner, with a diversified set of high quality assets, as our example.
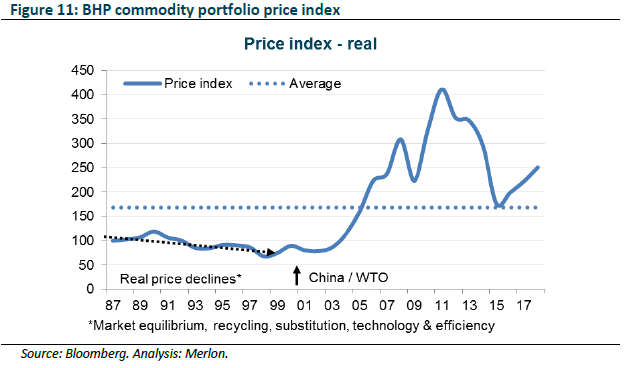
Cash-flow driver 1: price
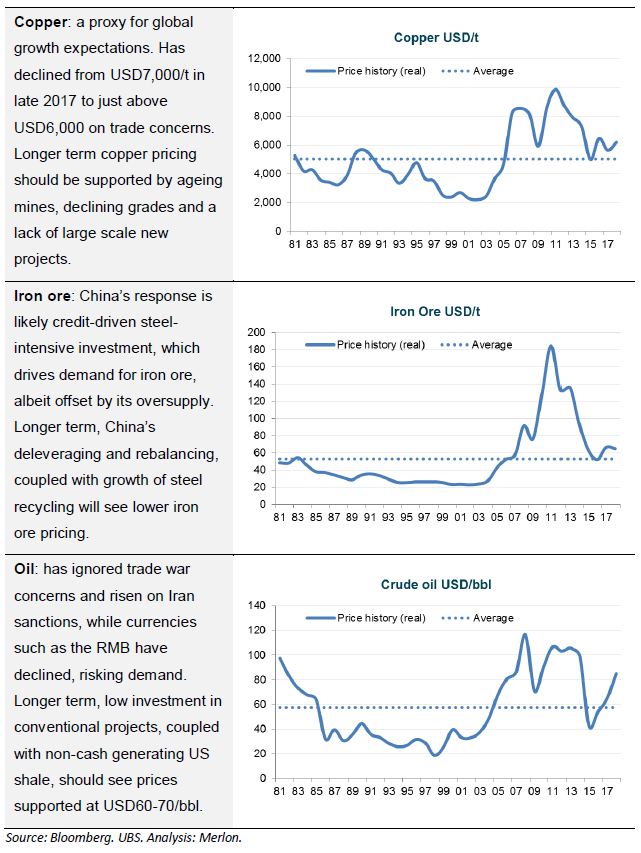
Using BHP’s portfolio of iron ore, crude oil and copper to create a price index we can discern two clear periods: firstly a phase of price declines as a result of recycling, substitution, technology and efficiency in response to high prices; and secondly, the impact of the scale of China’s WTO-led growth. Despite prices having declined significantly from their peak, they remain well above normal levels.
The expectation is for lower iron ore prices as China’s steel consumption has peaked and recycling rates remain well below international levels. While the timing of this demand decline is difficult to predict, iron ore pricing will also come under pressure as new known high grade supply comes on stream at a low cost of production. In contrast, oil prices are expected to remain supported longer term as unprofitable US onshore oil production exits, and underinvestment in conventional projects sees supply constraints. Copper is also subject to supply constraints given the lack of large scale new projects to replace aging existing mines and declining grades.
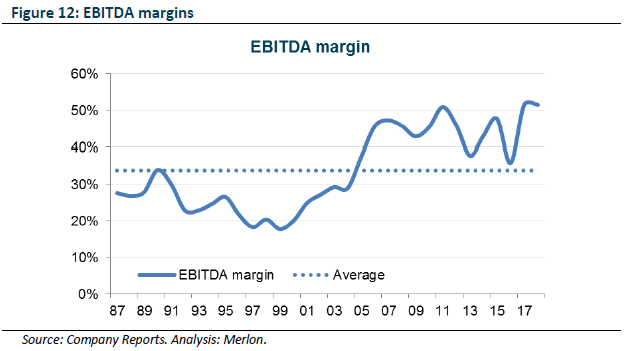
Cash-flow driver 2: margins
Margins continue to reflect incentive pricing, which is likely to end as China’s investment heavy phase of growth normalises. As commodity markets move into oversupply, particularly in the case of iron ore, margins will contract and incentivise production cuts.
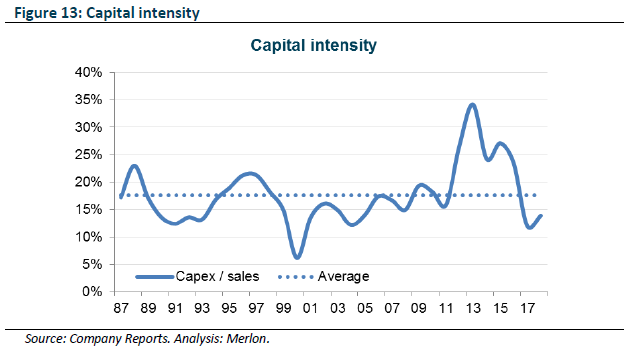
Cash-flow driver 3: Capital expenditure
Capital investment is currently unsustainably low, which will need to rise in order for production levels to be supported. Alternatively, capital spending can be withheld, leading to lower volumes, both of which will impact cash-flows.
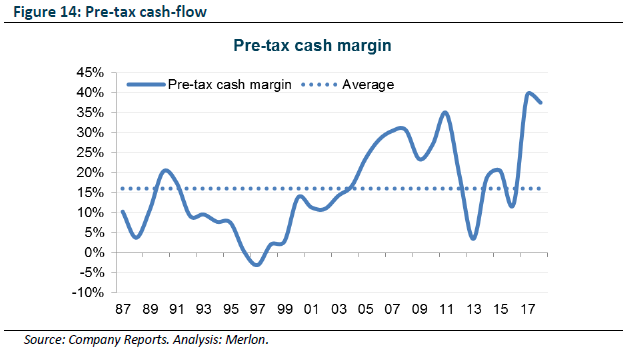
Putting it all together
From the chart below, we can clearly see how resource company cash-flows are extremely volatile and are currently over-earning on the basis of unsustainably high prices and margins, coupled with unsustainably low levels of capital expenditure.
In applying the above themes to valuing BHP, we can see in the following table the effects of a normalised operating environment across the key drivers of free cash-flow:
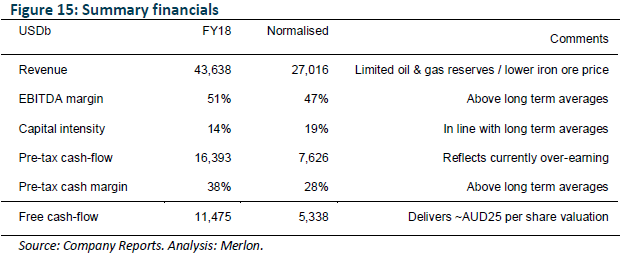
The effects of normalisation demonstrate the degree to which the company is over-earning in terms of cash-flows, particularly in terms of prices, the relatively short term nature of the oil & gas division, and under-spending on capex. The majority of the cash-flow decline comes from the run-off of the oil & gas business, coupled with lower iron ore earnings. The modelled pre-tax cash-margin per tonne of iron ore is above USD10/t, which is in line with pre-boom averages and delivers an attractive (for a commodity producer) 14% return on net assets.
Conclusions
There are clear risks to the global economy, and in turn, commodities and commodity producers, from the trade war. However, the more dominant factor driving commodities in the long term is China’s outdated growth model. Australia’s diversified economy is likely to prove resilient, with less than 10% GDP growth derived from the resources and energy sector. For resource companies, however, there are growing downside risks to free cash-flow from the anticipated normalisation of prices, margins and capital intensity, supporting an underweight portfolio exposure.
For more insights from Merlon Capital Partners please visit our website (VIEW LINK)
Never miss an update
Enjoy this wire? Hit the ‘like’ button to let us know.
Stay up to date with my current content by
following me below and you’ll be notified every time I post a wire
Ben joined Merlon Capital Partners as a Principal upon its inception in May 2010. Prior to joining Merlon, Ben was Head of Research and Information at Challenger Limited, managing the risk and quantitative research processes across all portfolios, as well as conducting tailored fundamental research, macro and commodity based research. Ben has held similar roles at First State Investments (UK), Colonial First State (Australia), and BT Funds Management.


Ben joined Merlon Capital Partners as a Principal upon its inception in May 2010. Prior to joining Merlon, Ben was Head of Research and Information at Challenger Limited, managing the risk and quantitative research processes across all portfolios,...
Expertise
Ben joined Merlon Capital Partners as a Principal upon its inception in May 2010. Prior to joining Merlon, Ben was Head of Research and Information at Challenger Limited, managing the risk and quantitative research processes across all portfolios,...
Expertise
Comments
Comments
Sign In or Join Free to comment
most popular
Equities
Buy Hold Sell: 2 standout ASX names for FY26
Livewire Markets
Equities
Fundie vs AI - 10 ASX income generators
Livewire Markets