Why Banks Fail: The Definitive Guide to Solvency, Liquidity and Ratios
As Basel III changes to bank capital levels are being announced and implemented there’s been a surge in articles on bank capital levels. How much capital is required, what type of capital is required and how minimum capital levels should be measured and set are all hot topics. Banks complain that having to hold more equity will reduce their returns and thus means they have to charge customers more. Governments want strong banks, so that they and their voting taxpayers don’t have to pay the bill whenever a bank strikes trouble. Every proposal comes with a cost, but which give the most bang for buck?
Why Banks Fail
In trying to figure out how to stop banks failing it helps to start with an understanding of why they fail. There’s two basic risks that banks need to watch out for, solvency and liquidity.
Solvency is having meaningful positive equity on the balance sheet, that is assets exceed liabilities. Solvency can be improved by raising more equity (stock offerings or dividend reinvestment plans) or by retaining profits. Solvency is reduced by bad loans and investments, which become bad debt expenses on the profit and loss statement and write-downs in the value of assets on the balance sheet. For banks, negative equity almost always comes about from lending to borrowers who can’t repay their loans and thus the bank incurs losses on those loans. It is typically the corporate and institutional departments that do the most damage with personal lending lower risk.
In Spain and Ireland in the lead up to the financial crisis lending for property development skyrocketed. Developers often contributed limited equity and when property markets crashed the developers were left with property they couldn’t sell and thus defaulted on their loans. Banks were caught with large amounts of failed loans, and for many banks the losses on these loans overwhelmed their equity. This experience is fairly common, Sweden and Australia both experienced a property and banking crash in the early 1990’s.
Another practical example of solvency issues was the US subprime lending crisis. Whilst this involved residential loans, it was mostly losses in the corporate and institutional departments on securitisation structures containing subprime loans that caused some large US and European banks to fail or to require bailouts.
The second key risk for banks is liquidity. Liquidity issues arise as a result of banks undertaking maturity transformation, which is taking short term deposits and lending out them out for longer terms. Customers want to deposits funds with banks and earn a positive interest rate whilst being able to withdraw the funds at short notice. Borrowers need long term loans to purchase property and equipment for their personal or corporate uses. Banks provide a service to the economy by bridging the gap between the two.
Experience has shown that maturity transformation is a dangerous business. Rumours of a bank having solvency issues are enough to start a rush for the exits by depositors, which can snowball once pictures of people lined up outside bank branches hits the news. The financial crisis showed panics can quickly spread globally, with all banks being considered suspect once a few failed. Once one government offered deposit guarantees, others were obliged to do the same or risk seeing a rush for the exits on the banks in their country.
What are the main capital ratios and how do they work?
The complexities of bank capital requirements can quickly overwhelm even seasoned investors, analysts and commentators. As a result, much of what is written about capital ratios is wrong or misleading and the debate about capital levels becomes a convoluted mess. It doesn’t help that there’s little evidence based modelling on the costs and benefits of higher capital ratios. Banks often fill the void with alarmist statements that the cost of lending will soar and economic growth will collapse if they are required to hold even a little more equity.
However, out of this quagmire came a recent article by Mike Konczal that summarises what the capital ratios are trying to fix. He explains that there are three areas to focus on; leverage, risk weighted assets and liquidity. These align with the balance sheet components of equity, assets and liabilities respectively. His neat summary chart is below. In the following paragraphs there’s an explanation on what each capital ratio is and what potential problem it is trying solve.
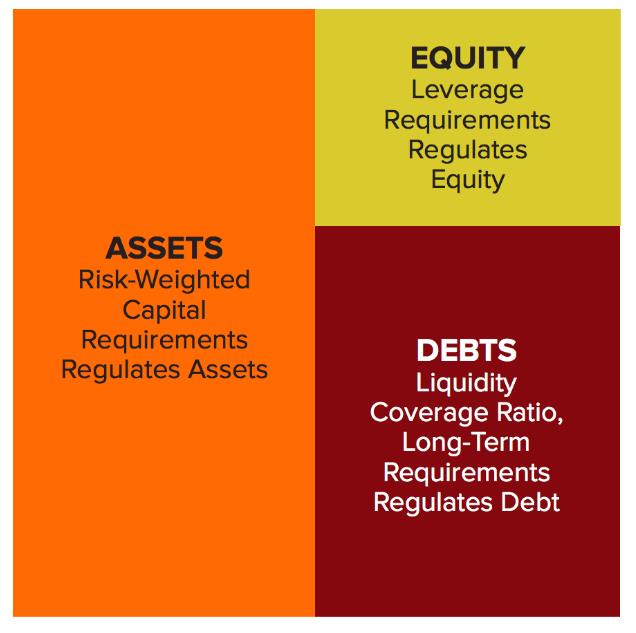
Source: Roosevelt Institute
Leverage Ratio: The leverage ratio is the simplest and most transparent of the three key ratios. It is the amount of equity relative to total assets, expressed as a percentage. For instance, a bank with $5 of equity and $100 of assets would have a leverage ratio of 5%. The standard leverage ratio includes just the ordinary equity capital of a bank, ignoring preference shares (additional tier 1 or AT1) and subordinated debt (tier 2). An extended version of the leverage ratio includes these items and is used for calculating total loss absorbing capital (TLAC) ratios.
The leverage ratio is trying to solve the problem of banks not having enough capital to cover potential losses on their loans and investments. Prior to the financial crisis, some banks had leverage ratios of only 2-3%. With so little equity, it wasn’t going to take much of a financial storm to wash away a bank’s solvency. In the case of Lehman Brothers, it combined a very low leverage ratio with high levels of risk taking in its lending and investments, including leveraged loans, mezzanine debt and equity investments in property and Lehman Brothers funds.
Risk Weighted Assets Ratio: The risk weighted assets ratio is similar to the leverage ratio in that it measures the percentage of non-senior capital relative to assets. However, the denominator (the bank’s assets) are adjusted for the perceived risk. Government debt is often (wrongly) considered to be risk free and usually attracts a 0% risk weight. Home loans are considered low risk and can adjusted down to 15-50% of their actual exposure. Business loans are seen as medium risk and typically marked at 100% of their exposure. Equity investments are considered very high risk and usually attract a 300-1250% risk weighting, which at the high end implies that they are to be fully funded by bank equity. Risk weighted assets also includes calculations for market risk and operational risk in the denominator.
Risk weighting is trying to solve the problem of comparing banks that are taking varying levels of risk with their lending and investment activities. Let’s consider a hypothetical comparison of “Boring Bank” and “Risky Bank”. Boring Bank lends its $100 in home loans and to companies with investment grade credit ratings. As a result, its exposures are adjusted down to $50 by risk weighting. Risky Bank lends its $100 to sub-investment grade companies and also invests in equity. Its exposures are adjusted up to $200 by risk weighting. If both want to have a risk weighted assets ratio of 16%, Boring Banks needs $8 of equity and subordinated capital and Risky Bank needs $32. The leverage ratio would ignore the different risk profiles and treat them the same, but the risk weighted asset ratios adjust for the different risk profiles.
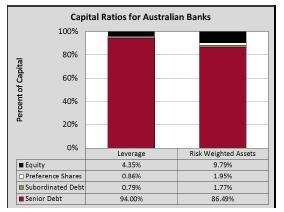
The table below shows the break-down of a bank’s capital structure into the different capital types. These ratios have been created by using the average of the four major Australian banks as at their annual reporting date in 2015. Note that the ratios for risk weighted assets are much higher than the leverage ratios, which is largely due to these banks having significant exposures to residential home loans, which attract risk weights of around 25%.
Liquidity Coverage Ratio: This ratio measures the amount of highly liquid assets relative to liabilities coming due over the next 30 days. There are adjustments to both the numerator and the denominator for the perceived quality of the assets (cash, central bank deposits, bonds) and liabilities (at call deposits, wholesale funding). Banks need to maintain the ratio above 100%, which theoretically implies that they are able to meet their maturity liabilities. Banks can increase their liquidity coverage ratio by increasing the proportion of highly liquid assets they hold (less loans and more cash) or by increasing the length of the funding they receive from retail depositors (term deposits instead of at-call accounts) and wholesale providers (medium term bonds instead of bank bills).
Whilst the leverage and risk weighted assets ratios are dealing with the solvency of the bank, the liquidity coverage ratio is dealing with the liquidity risk. In theory, if a bank run begins the bank is able to sell highly liquid assets to meet the withdrawals by depositors and maturing wholesale funding. During the financial crisis Northern Rock and Dexia both suffered substantial runs on their wholesale funding and required liquidity support from their governments. The liquidity coverage ratio tries to address this risk by assuming that short term wholesale funding is unreliable and thus banks need to fund their activities with “stickier” retail deposits and long term wholesale funding.
Limitations of each ratio
The simplicity of the leverage ratio is also its greatest limitation. By assuming that all lending and investment activities are equally risky it encourages banks to undertake higher risk and potentially higher return activities. On its own the leverage ratio would see banks increase risk taking, thus offsetting the required increases in their equity levels.
The complexity of the adjustments in the risk weighted assets ratio is its greatest limitation. Whilst there are some floors on risk weighting and a level of regulatory oversight, the Basel III framework often allows for banks to set their risk weights artificially low in some segments. It also treats some assets within segments as equal, which like the leverage ratio can skew lending towards the riskier borrowers within those segments.
The liquidity ratio relies on heroic assumptions around what percentage of liabilities will be redeemed in the next 30 days. At call retail and small business deposits are assumed to see a 3-10% redemption rate. If a bank run begins, this redemption rate could be hit within days, which would see a bank quickly exhaust its liquid assets.
The limitations of each ratio on its own mean that all three ratios have a role to play. Some recent proposals on reforming banks fail to recognise this. The Hensarling plan, named after US House of Representatives Financial Services Committee Chairman Jeb Hensarling, suggests that banks be exempt from most regulations if they hold at least 10% equity relative to their total assets. A report by Kroll Bond Rating Agency suggested that liquidity not capital is the major issue for large banks. Each of these proposals is flawed by failing to understand the problems that the other ratios are seeking to solve.
The different types of capital that are included in the ratios
Within bank capital structures there are four main types of capital: equity, preference shares, subordinated debt and senior debt. In a small number of countries, the regulators have allowed for a fifth layer sitting between senior and subordinated debt, which is commonly called bail-in senior debt. Most regulators haven’t approved bail-in senior, as it is essentially a weaker form of subordinated debt. It adds additional complexity to bank capital structures without adding material value. The table below shows the names and features of the different types of capital.
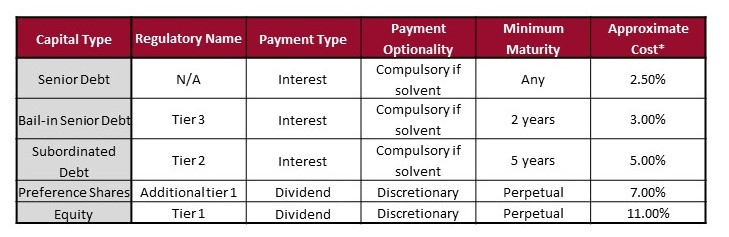
*Based on current base rate and margins in Australia, with international comparisons used for tier 3
The two arguments between banks and regulators are (i) how much total subordinated capital (everything other than senior debt) is required and (ii) how much of each type of capital is required. Banks will obviously prefer less capital and more of the cheap types of capital, bail-in senior and subordinated debt. Regulators prefer more capital and more of the longer tenor capital items, equity and preference shares. The next section explores these arguments further.
The costs and benefits of lifting ratios
Everybody agrees that increasing the amount of subordinated capital and liquid assets will come at a cost. How much that cost is and what benefit is obtained from doing that is hotly debated. The major benefit from banks holding more capital is a reduced likelihood of taxpayers ever needing to bail out an insolvent bank. This is not an insignificant risk, many banks both large and small were bankrupted or bailed out following the onset of the financial crisis. A secondary benefit is a reduction in debt fuelled boom and bust cycles.
Prior to the financial crisis, Ireland and Spain both had low levels of government debt and above average levels of economic growth. However, the growth was not sustainable as it was driven by excessive credit growth. The banks in both countries were making high risk loans without holding adequate capital. At the onset of the financial crisis, the economies of Ireland and Spain suffered substantial recessions. Government debt to GDP ratios have skyrocketed following government recapitalisations of failing banks. Both countries are now left with a mountain of debt that will take decades to repay (in an optimistic scenario) and will be a substantial burden on future generations. This extraordinary cost is well worth taking out some insurance against.
The gold standard in lifting capital ratios is Switzerland. Its experience during the financial crisis, which included having to use taxpayer money to recapitalise UBS and establish a “bad bank” for its toxic assets, means the Swiss are keenly aware of the risks banks can create for taxpayers. The table below shows the minimum capital levels that Swiss banks are required to have in place by the end of 2019.
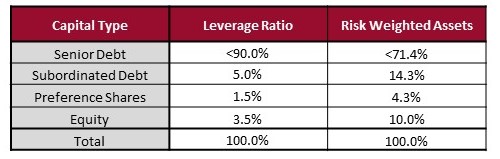
What the Swiss have done is substantially increase the amount of subordinated capital required but have done this primarily with subordinated debt. On the leverage ratio, Swiss banks aren’t far away from being at these levels already. Based on current estimates, the leverage ratio is slightly higher than what the international benchmarks are expected to be. For risk weighted assets, the Swiss ratio is well above where international benchmarks are expected to be set. Swiss banks do have a decent gap between their current capitals levels and the 2019 minimums for risk weighted assets. However, it is the relatively cheaper subordinated debt that needs to increase most with smaller increases required for preference shares and equity.
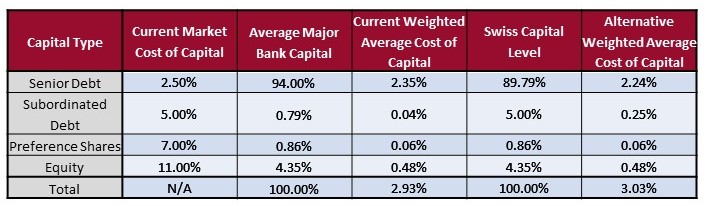
Below is an estimate of the cost of increasing bank capital to the Swiss levels for the four major Australian banks. The leverage ratio is shown first. Note that as the major banks already meet the equity and preference share requirements these levels are not adjusted.
Next are the calculations for the risk weighted capital levels. Here the Australian major banks do not meet the capital levels required for any of the three levels of subordinated capital.
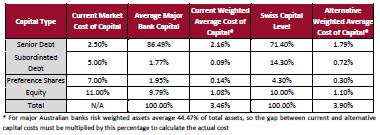
* For major Australian banks risk weighted assets average 44.47% of total assets, so the gap between current and alternative capital costs must be multiplied by this percentage to calculate the actual cost
Based on adopting the Swiss leverage ratio, Australian major banks would see an increase of 0.10% in their cost of capital. For risk weighted assets, the increase of 0.44% is multiplied by 44.47% (the risk weighted assets to total assets proportion) for a cost of capital increase of 0.19%. Assuming this was completely passed onto borrowers, this would have minimal impact on the demand for credit. These higher capital levels will not make banks bulletproof from solvency risks, but it will substantially reduce the likelihood of a taxpayer bailout.
Unlike increasing leverage and risk weighted asset ratios, increasing liquidity ratios is of limited benefit. The liquidity lesson from the financial crisis was that bank runs can quickly become a global phenomenon and only government guarantees and central bank funding can stabilise the situation. In 2008 interbank lending collapsed as banks were unsure whether any of their peers would be capable of repaying their debts. Excess deposits were parked with central banks, as banks were unwilling to take the risk of lending to other banks. Increasing the amount of liquid assets might cover a bank for additional days or weeks, but in a full scale bank run only long term capital is reliable.
To meaningfully address bank liquidity risk would require banks to cease their maturity transformation function. Banks would need to match long term loans with long term funding. This would be a combination of deposits and wholesale funding of at least 3 years for on-balance sheet activities and a substantial increase in off-balance sheet securitisation. It not simply an issue of how much it might cost, it is also an issue of whether banks will turn away short term deposits and whether there is enough long term capital available to fund such a dramatic shift in capital markets.
Retaining the status quo on liquidity comes with an acknowledgement that this means relying on central banks to provide liquidity in times of crisis. Providing a bank is appropriately capitalised, central banks should provide liquidity at a cost higher than markets would charge in normal times but less than the market cost in times of crisis. Central banks should require collateral with appropriate discounts applied in order to protect their position.
The role of regulators
There are two main roles for regulators in bank solvency, liquidity and ratios. Firstly, regulators need to set appropriate ratio levels and police compliance with those levels. Thus far this paper has concentrated on this aspect. Secondly, regulators need to monitor credit conditions within the wider economy as well as within the banks they regulate. This section explores this second role further.
Hyman Minsky highlighted that if credit is easily available within an economy, the potential for asset price bubbles to emerge is elevated. Even if a bank is lending conservatively, the actions of other lenders within an economy can increase the risk of a bank becoming insolvent. This can happen both directly and indirectly.
The direct lending risk is when banks lend to other banks, non-banks or structures that are facilitating high risk lending. As was seen in the US in the financial crisis, many banks weren’t making material amounts of subprime residential loans directly. However, they were caught up in the collapse by their warehousing facilities with subprime originators, mortgage backed securities and CDOs. Banks also had trading limits with other banks and may have suffered losses as Lehman Brothers and other financial institutions failed.
The indirect risks mean what would otherwise be reasonable levels of gearing become aggressive levels due to inflated asset prices. For instance, a 50% gearing ratio on prime commercial property might be considered reasonable, but this can quickly become a 75% gearing ratio if asset prices fall by one-third. This indirect risk increases both the probability of default and the severity of loss. As speculative asset prices fall, gearing covenants are sprung which creates a cycle of distressed sellers. Whilst a bank’s borrowers may not be distressed, the fact that the borrower’s peers are distressed will see whole investment sectors repriced. It may also reduce a borrower’s income levels as excess supply increases competition and reduces the margins earned by all participants within an industry.
Whilst it obvious that regulators should be concerned about the direct risks to banks, they must also monitor the indirect risks. This means being aware of asset prices and credit availability across the whole economy, not just at the regulated banks. It may require the use of macro-prudential measures, such as capping the maximum loan to valuation ratio as New Zealand has done, or capping leveraged lending to corporate borrowers as the US has. Regulators should regularly visit banks and review a sample of their loan books to ensure that lending standard are not slipping. In crisis after crisis, banks have proven they cannot be trusted to maintain conservative lending standards on their own.
The best example of a regulator reviewing loan quality is the US Shared National Credit program, run by the Office of the Comptroller of the Currency (OCC). This program focusses on corporate and institutional lending, the area that most frequently causes banks to fail. Each year the OCC inspectors review these large loans and assign a risk grade. For higher risk and defaulted credits, the regulator specifies the amount of capital the bank must hold against the loan. By reviewing the same loans and lenders year after year, the OCC gains an enormous insight into whether lending standards are improving or deteriorating. When they are deteriorating, the regulator can take action include increasing the amount of capital held against high risk loans or stopping banks from lending to high risk borrowers altogether.
When put together, the two roles of a banking regulator form a very strong barrier to banks ever needing a taxpayer bailout. By setting and policing capital ratios, and reviewing credit quality across the economy bank regulators can dramatically lower the risk of bank failure. Regulators need to be experts in both roles to properly set counter-cyclical capital buffers and to understand when and how to implement macro-prudential measures.
Conclusion
Banks are complex, but understanding why banks fail and what can be done about it doesn’t have to be. Banks fail because they have suffered losses on lending and investments that outweigh their equity or cause concern that their equity might be inadequate to cover future losses. This solvency problem is typically due to losses in the corporate and institutional lending segments. Solvency concerns fuel liquidity problems, rather than the other way around.
The leverage and risk weighted capital ratios measure the amount of subordinated capital a bank has relative to its assets. The liquidity coverage ratio measures the amount of short term assets relative to short term liabilities. Increasing subordinated capital greatly decreases the likelihood that a taxpayer bailout will ever be required, but increasing long term funding does not. Governments and regulators should prioritise the building of subordinated capital over long term funding. Using the gold standard Swiss model, increasing subordinated capital for the Australia four major banks would increase funding costs by 0.19%. This is a relatively small cost for an enormously valuable insurance policy that will greatly reduce the likelihood and cost of bank bailouts.
As well as setting and monitoring capital levels, regulators should also conduct sampling exercises to measure the risk of bank’s lending activities. If done well, these two actions form a very strong barrier to banks ever needing a taxpayer bailout. If there is one lesson that governments and regulators must learn from the financial crisis it is that taxpayers should not be a backstop for bank shareholders in a “heads I win, tails you lose” game.
Written by Jonathan Rochford for Narrow Road Capital on August 16, 2016. Comments and criticisms are welcomed and can be sent to info@narrowroadcapital.com
Never miss an update
Enjoy this wire? Hit the ‘like’ button to let us know.
Stay up to date with my current content by
following me below and you’ll be notified every time I post a wire
Narrow Road Capital is a credit manager with a track record of higher returns and lower fees on Australian credit investments. Clients include institutions, not for profits and family offices.

1 topic

Narrow Road Capital is a credit manager with a track record of higher returns and lower fees on Australian credit investments. Clients include institutions, not for profits and family offices.
Expertise
Narrow Road Capital is a credit manager with a track record of higher returns and lower fees on Australian credit investments. Clients include institutions, not for profits and family offices.
Expertise
Comments
Comments
Sign In or Join Free to comment