Why this market is 33-50% overvalued
Are Australian stocks overvalued, fairly valued or undervalued? Leithner & Company, a value investor based in Brisbane, regularly analyses data that shed light upon this vital – and perennial – question. This article outlines some of the argument and analysis that supports my conclusion that the All Ordinaries Index is presently overvalued by at least one-third and perhaps as much as two-thirds. I’m not saying that it will certainly – and soon – crash; bold and precise predictions almost always fail miserably. Caution, however, is clearly warranted: if the past is prologue, then the odds are that during the next several years the Index’s long-term returns will be paltry. Investors should take seriously the possibility that it either sags gradually or relapses suddenly, and incorporate such risks into their plans.
The All Ords, Its Earnings and PE Ratio
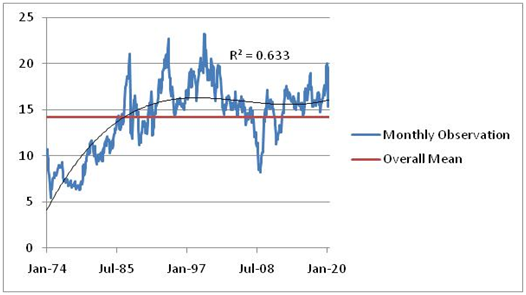
Two series of monthly observations – the All Ordinaries Index and its earnings – provide the raw material that underpins this conclusion. The Index’s ratio of price to earnings (“PE”) underpins mycase. As a rough rule, the lower (higher) is the PE, the cheaper (dearer) is the market. Why do I analyse the All Ords rather than the S&P/ASX 200 or other index? Earlier this year, stock markets around the world experienced unprecedented volatility (such as the fastest-ever appearance of a bear market) and many agree that economic conditions are presently among the worst – if not the worst – since the Great Depression. Australian investors therefore need as much historical context as possible, and the All Ords provides it: established in 1980, it’s been backdated to the 1870s and reliable estimates of its earnings date from 1974; in contrast, the S&P/ASX 200 dates from 2000. Figure 1 plots the Ords’ PE from January 1974 to June 2020. Its mean is 14.3 and its median is 15.1. A simple (polynomial) model shows that from the mid-1970s until the mid-1990s its trend rose steadily; since then it’s plateaued; in June it was 19.6.
Figure 1: Price-to-Earnings (“PE”) Ratio, All Ordinaries Index, January 1974-June 2020
Bullish or Bearish?
From the All Ords’ PE’s central tendencies and trend, both bulls and bears claim support. Bears note that at the Index’s all-time peak (7,289 on 20 February), its PE (20.1) was higher than at any time since the Dot Com Bubble; indeed, only then and on the eve of the Crash of 1987 and GFC – and in just 3% of the months since January 1974 – has the ratio exceeded 20. At the height of the panic in March of this year (15.5), it remained above-average. By bears’ standards, the PE has exceeded its long-term mean (and thus the Index has been pricey) almost all of the time since the mid-1990s. By bulls’ reckoning, over the past quarter-century a new reality has prevailed and the PE’s trend reflects it. This, bulls allege, is a blessing of ever-lower rates of interest. Thanks to central banks, they add, rates will be “lower for longer” – and thereby underpin stocks.
Bears counter by affirming what bulls typically ignore or deny: central banks suppress rates in order to stimulate borrowing; debt-fuelled spending, in turn, ignites booms, and upswings lift PE ratios. Yet excessive borrowing has repeatedly triggered crises – which crush PEs. At the nadir of the Global Financial Crisis (October 2008-February 2009), the Index’s sank below 9 – its lowest level in 30 years. Hence the key question: are economic conditions today as tough as they were during the GFC? Since March, buyers of shares have been acting as if they aren’t; if they did, then – even assuming that the Index’s earnings won’t fall (see below) – the PE (and thus the All Ords) would plunge.
The Ten-Year (and Counting) “Earnings Recession”
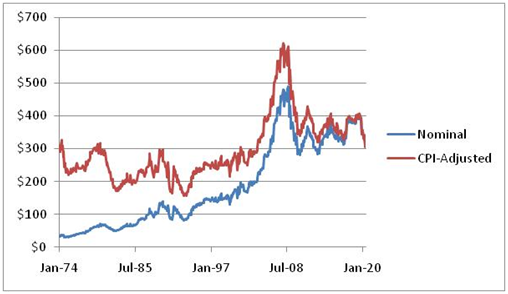
Most ASX-listed companies’ financial year ends on 31 December or 30 June. Hence most companies’ results to 31 December 2019, which they reported in February, didn’t include the effects upon their earnings of the COVID-19 pandemic and economic shutdown. They’ve recently reported their results to 30 June – which include these effects. Once buyers and sellers of shares digest them, will they more reasonably price the deepening “earnings recession” that’s been underway since the GFC? To understand this crucial point, let’s do some elementary arithmetic. The All Ords closed at 6,001 on 30 June; on that date its PE ratio was 19.6; hence its earnings were $306 (that is, 6,001 ÷ 306 = 19.6).
Earnings (and attitudes towards them that PEs reflect) are a key driver of indexes. It’s therefore vital to emphasise three points that bullish analysts, strategists, etc., have long ignored or denied. First, the All Ords’ earnings are much lower today than they were on the eve of the GFC (Figure 2). Nominally, they were 36% lower in June 2020 than the summit ($479) they scaled in January 2008. Adjusted for the Consumer Price Index, since January 2008 they’ve plummeted exactly one-half. Accordingly, and secondly, at its all-time peak earlier this year the Index “recovered” from the GFC despite the fact that its earnings had sharply deteriorated. Since the GFC, how has the Index generated returns? Its PE has more than doubled – from well below its historical average (8.8 in February 2009) to greatly above it (20.1 in January 2020). When the Index’s earnings decrease, its PE must rise disproportionately in order to generate a positive return. Thirdly, during 2019 – that is, well before the Global Viral Crisis (GVC) – the Index’s earnings were already declining. They sagged 9% (from $378 in January to $344 in December); they also fell another 11% (to $306) in the half-year to June 2020.
Figure 2: All Ordinaries Index’s Earnings, January 1974-June 2020
The GFC Clobbered Earnings – and Surely the GVC Will, Too
Two additional points should – but don’t – temper bulls’ enthusiasm. First, on 3 June the Treasurer conceded and on 2 September the national accounts confirmed that, by the conventional definition (two consecutive quarters during which “headline” GDP decreases) and for the first time in almost thirty years, Australia’s economy had entered into recession. On 30 June, the RBA’s Deputy Governor added that the slump would “likely” be “long-lasting.” How and to what extent might today’s recession affect the All Ords’ earnings? Its predecessor of the early-1990s is instructive. Australia’s GDP peaked at $200.1 billion in the April-June quarter of 1990. The recession occurred in January-June 1991. By mid-year, GDP sagged to $197.5 billion. It shrunk 1.4% from its peak: that’s less than one-quarter the percentage – 6% – that the RBA has posited as its “base case” of contraction during 2020. A year later, in mid-1992, GDP rebounded to $201.4 billion and thereby exceeded its pre-recession maximum. The Index’s earnings, on the other hand, crested at $139 in September 1989 and troughed at $81 in December of 1992. That’s a decrease of 42% over more than two years. Not until January 1996 did they exceed their pre-recession peak. In the early-1990s, a six-month recession produced an “earnings recession” that lasted approximately four years.
The second point: as a result of the GFC – which didn’t trigger a recession – the All Ords’ earnings sank from $476 in February 2008 to $282 in March 2010. That’s a fall of almost 40% and a duration of approximately two years; moreover, and as already noted, a decade later the Index’s earnings remain far below their pre-GFC peak. In that critical sense, the GFC unleashed an “earnings recession” that began savagely and still hasn’t ended. Given that Australia is now in recession – that is, the GVC has triggered conditions worse than the GFC – will during the next several years the All Ords’ earnings slump as much in percentae terms as they did in 1989-1992 and 2008-2010? Bear in mind that between the GFC and GVC the Index’searnings mostly stagnated; and a year before the GVC erupted they were falling. So which is more likely: (1) the GVC will intensify what the GFC has done to the All Ords’ earnings; (2) despite the GVC, something will cause them to hold steady or even increase?
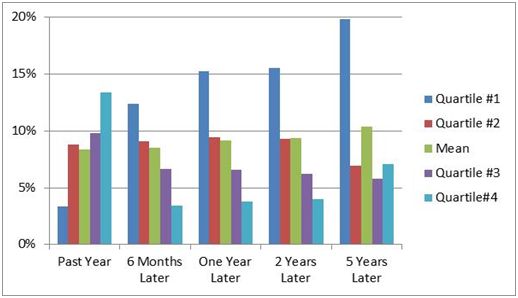
Figure 3: All Ords’ Annualised Returns, Ranked by Previous 12 Months’ PE Ratio, 1974-2020
High Current PEs Crimp Future Returns
The vast majority of market participants seem to ignore two final and fundamental points. First, the greater is the All Ords’ pecentage return at the end of a 12-month period, the higher its PE ratio tended to be at its start. On a “retrospective” basis, in other words, the relationship between ratio and return is positive (see “Past Year” in Figure 3). PEs in the bottom quartile (#1) of observations generate the lowest (3.4%) average return; those in the top (#4) produce the highest (13.4%). Secondly, however, and on a “prospective” basis, this relationship is negative: high current PEs tend in the future to generate low returns. PEs in the bottom quartile spawn the highest (12.4% annualised) returns six months hence; those in the top one produce the lowest (3.5%). Further, returns from the bottom quartile improve as time passes. In sharp contrast, high current PEs (top quartile) subsequently generate low and stagnant returns.
Where Will the All Ords Be in a Year?
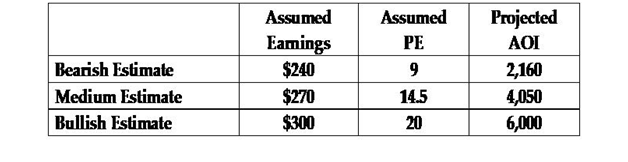
We’re now in a position to address some critical questions. Given current conditions and considered as a whole, are Australian stocks overvalued, fairly valued or undervalued? What will the All Ordinaries Index be in a year’s time? The short, easy – and wise – answer to the second question is “nobody knows.” The longer, harder – and possibly foolish – response to both questions depends upon the reliability of two sets of assumptions about the future: the Index’s earnings and its PE. Table 1 details mine; you can supply yours. Given its course of earnings since the GFC (and their likely negative direction during the next 6-18 months or more), it’s hard to be bullish: the bearish estimate assumes that earnings fall 20% from their current level; the bullish one assumes that they remain unchanged; the medium estimate is their halfway point. Similarly, given the market’s PE since 1974, it’s not easy to suppose that it can long exceed 20 – but the bullish estimate does. The bearish one assumes that it returns to the level that it plumbed during the GFC; and the medium one approximates its mean since 1974. Even the most bullish combination of assumption produces an All Ordinaries Index below its current level; the bearish combination implies a plunge of ca. two-thirds, and the mid-range is a fall of one-third. Events in February-March of this year forcibly reminded us that the words “inconceivable” and “impossible” aren’t synonyms; so who can credibly guarantee that the Index can’t or won’t plummet 70% from its peak?
Table 1: What Will Be the All Ords’ Level in June 2021?
That’s why I conclude that the All Ordinaries Index is grossly overvalued. We’re currently navigating what I believe is a lull in the third economic-financial-market crisis that’s occurred since Leithner & Company’s establishment in 1999. Bulls will surely disagree – that’s their right – and in fairness they have one strong card to play. I’m saying, in effect, that there’s a significant risk that the Index will crash. Bulls might rightly retort that crashes occur very infrequently: in just 5% of the 12-month periods since 1875 has the (reconstituted) All Ordinaries Index sagged 20% or more. But these long odds hardly absolve the bulls: if they reject my dour conclusion, then they must clearly state their (or counter my) data and reasoning; they must also justify their assumptions. If you’re bullish – for example, you think that during the next year the Index is going to rise (say) 7.5% – then you must say something like
- “Never mind the GVC: during the next year I expect earnings to increase 16%, to $356, and the PE to be 18.5, so that $356 × 18.5 = 6,586;” or
- “GVC be damned: earnings will decrease just 5%, to $291, and the PE will rise to 22.6, almost as large as its all-time high (23.2 in December 1999), which gives us $291 × 22.6 = 6,586.”
“Or,” as Warren Buffett wrote in a seminal article (“Mr. Buffett on the Stock Market,” Forbes, 22 November 1979), “you’ve got to rearrange these key variables in some other manner. The Tinker Bell approach – clap if you believe – just won’t cut it.”
Want More Analyses Like This?
This is the first of a four-part series. Hit FOLLOW on my below profile for notification when parts 2-4 appear. If you enjoyed the article please give it a like!
Not already a Livewire member?
Sign up today to get free access to investment ideas and strategies from Australia’s leading investors.
Never miss an update
Enjoy this wire? Hit the ‘like’ button to let us know.
Stay up to date with my current content by
following me below and you’ll be notified every time I post a wire
After concluding an academic career, Chris founded Leithner & Co. in 1999. He is also the author of The Bourgeois Manifesto: The Robinson Crusoe Ethic versus the Distemper of Our Times (2017); The Evil Princes of Martin Place: The Reserve Bank of Australia, the Global Financial Crisis and the Threat to Australians' Liberty and Prosperity (2011); and Intelligent Australian Investor: Timeless Principles and Fresh Applications (2005; out of print).


After concluding an academic career, Chris founded Leithner & Co. in 1999. He is also the author of The Bourgeois Manifesto: The Robinson Crusoe Ethic versus the Distemper of Our Times (2017); The Evil Princes of Martin Place: The Reserve Bank of...
Expertise
After concluding an academic career, Chris founded Leithner & Co. in 1999. He is also the author of The Bourgeois Manifesto: The Robinson Crusoe Ethic versus the Distemper of Our Times (2017); The Evil Princes of Martin Place: The Reserve Bank of...
Expertise
Comments
Comments
Sign In or Join Free to comment