August Reporting Season: The Good, The Bad and The Oddly
Confession season was eerily quiet leading into reporting season, unlike the noise from the Royal Commission and the incredible events out of Canberra, where another Prime Minister didn’t reach their full term. The global equity backdrop was in a state of flux with the ongoing Trump-induced trade debate/war raging, mixed signals from Beijing regarding a policy/stimulus response, and the incredible divergence of performance between growth over value was surely due a retracement.
Result day volatility was remarkable for some, and the median stock deviation of 3.5% was much larger then we have seen over the past five years. High growth, high PE names were squeezed higher, often on poor results and outlooks. The heavily shorted stocks outperformed during the month driven by better than feared results and M&A activity (TPG Telecom and Santos).
The AUD weakness, retracing some 11.4% from year highs and down 7.7% since mid-April 18, creates an earnings tailwind for the many stocks that are leveraged to a falling AUD. Nikko AM has been overweight offshore earners for a while given the attractive valuation to a number of the companies. The lower AUD is positive for the economy and increases the competitiveness of export industries such as education, agriculture and tourism.
According to Deutsche Bank, 52% of companies beat their forecasts, which is in line with the 5-year average (Chart 1), whereas only 39% of companies upgraded, which is below the 5-year average. Morgan Stanley calculated that earnings beats were rewarded by a day 1 move of +2.7% and misses fell by -1.9%.
Chart 1: Changes to Deutsche Bank earnings during reporting season
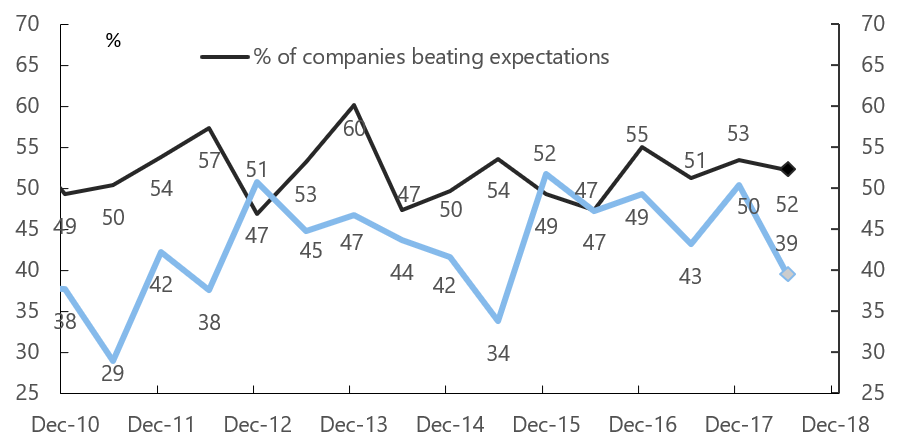
Source: Deutsche Bank, company data
This reporting season has been slightly more volatile over the month on average. Annualised return dispersions were 30.4% compared to an average of 24.8%, indicating there has been more surprises. However, looking at the average price move on the day of a result versus their normal daily volatility confirms the share price moves were extreme.
During August the share price moves on result days were 4.6x greater than average daily movements outside of reporting seasons.
This compares to the historic average move during reporting seasons of 2.5x. (Chart 2)
Chart 2: Share Price reactions on earnings day
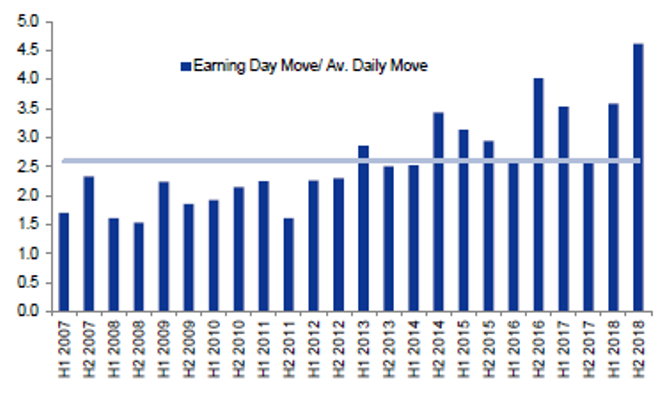
Source: Goldman Sachs
O value, value, wherefore art thou value?
With apologies to the 'Bard of Avon', but the market is becoming lost in its desire to chase growth with little or no attention to the value they are paying. The divergence between value and growth has been widening over the past five years and certainly picked up over the past 12 months (as discussed in Nikko AM Portfolio and Senior Analyst, Jason Kim’s August 2018 article ‘Value vs Growth and the Divergence to the Extreme’). This is well illustrated in Chart 3, which shows the growth vs value ratio, and Chart 4, which shows the enormous variance between the PE ratios of value and growth stocks.
Chart 3: Total returns by style
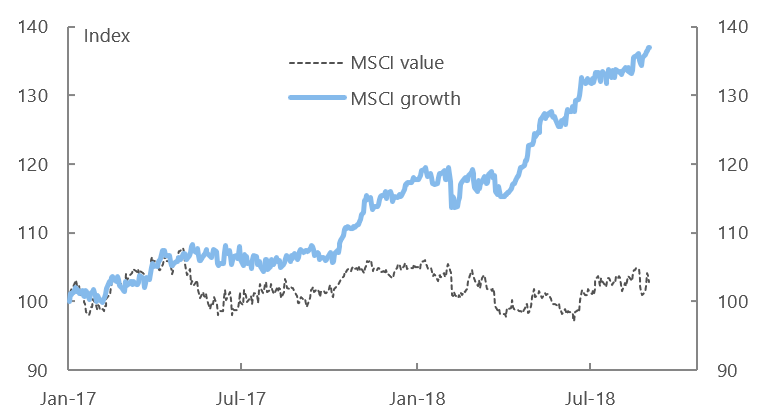
Source: Datastream, Deutsche Bank
Chart 4: MSCI Australia forward PE ratios
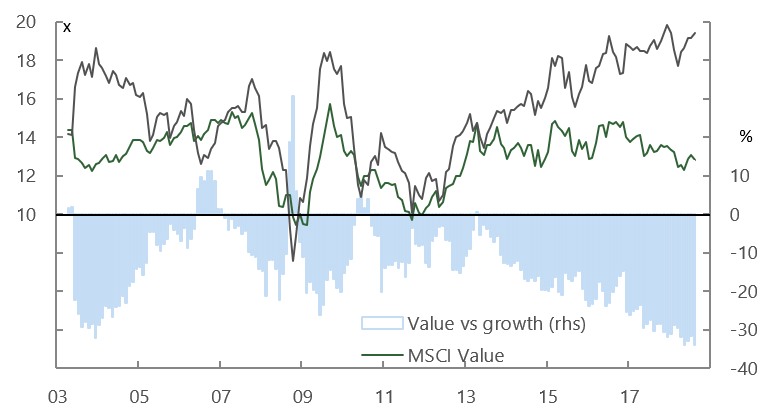
Source: Datastream, Deutsche Bank
The 2018 fiscal reporting season has seen this take a further incredible step up with the top PE quintile stocks expanding their 1-year forward PE by a further 4.2pts (or 10%), despite earnings falling by 2 – 3%. This contrasted with the bottom two P/E quintiles that were largely flat over the month (Chart 5). One of the poster children of this move is Domino’s Pizza, which released a result that was materially below guidance and market expectations. After initially falling 13% it finished the month 5% (including dividends) above the price it was prior to the result.
Chart 5: P/E expansion by quintile
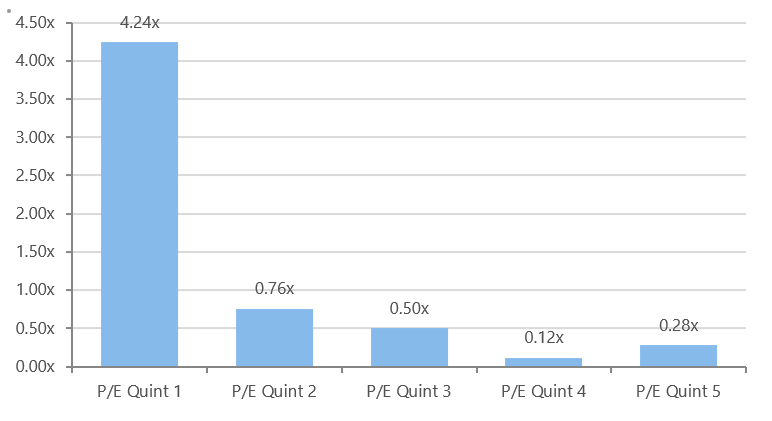
Source: JP Morgan
Chart 6: 1-month and 3-month P/E expansion by quartile
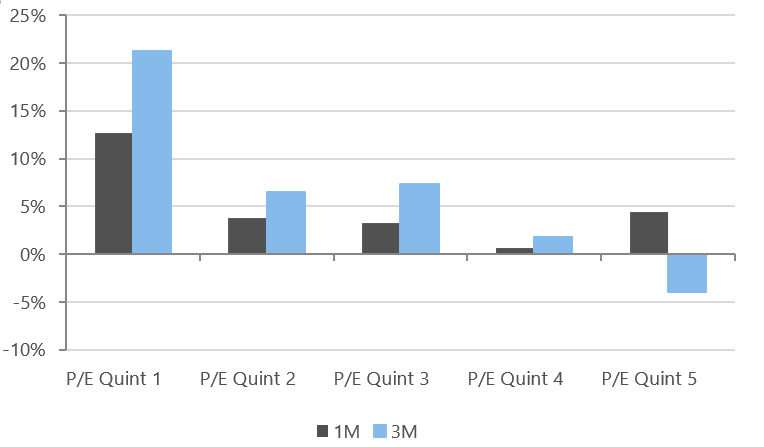
Source: JP Morgan
A retracement of this bubble-like trend must be a high probability given the extreme levels.
Some takeaways from reporting season
- Cost inflation within the US has impacted a number of Australian companies, including James Hardie Industries (JHX), Brambles Limited (BXB), Amcor Limited (AMC) and Ansell Limited (ANN). Some of the companies have the ability to pass on the costs via pass-through arrangements, but often with a lag. These ongoing cost pressures warrant a close eye given some are stock-specific raw material costs whereas others, such as rising freight and energy costs, are market-wide.
- Cost pressures are emerging within Australia after years of cost out initiatives. Electricity prices, labour costs (particularly in the resources space in Western Australia) were called out. However, in aggregate they still remain quite benign with little evidence of domestic wage pressure outside of construction and mining.
- The bank results and trading updates showed little sign of deteriorating asset quality and bad debts remain at extremely low levels. Mortgage loan growth continues to slow, as expected, with little sign of life in business lending. Net interest margins are under pressure, but recent out-of-cycle rate rises alleviate this concern. Given the Royal Commission, the ongoing increase in compliance costs shows no sign of abating.
- The earnings outlook remains strong at 9.8% NPAT growth for FY19 despite a moderation during reporting season (-1.9%). The modest downward revision is not surprising given the high expectations going into results season. The breath of the positive earnings growth is surprisingly high with only mining, transport and telcos in negative territory (Chart 7)
- Capital management is an ongoing theme driven by the combination of strong balance sheets and modest capex plans together with management being acutely aware of shareholder claims on profit. The capital has been delivered by a combination of on-market buybacks and special dividends. Payout ratios were a little higher than expected during the results, albeit continue to moderate after breaching historic highs. The higher likelihood of a Labor government may incentivise companies to accelerate the distribution of excess franking credits.
Chart 7: FY19 NPAT vs PCP
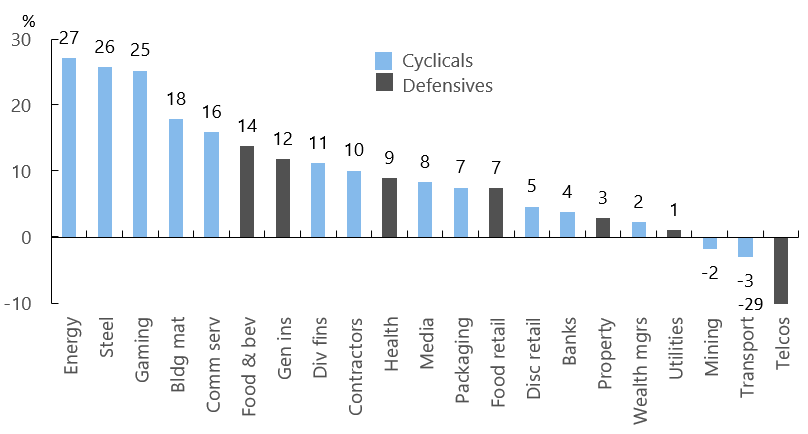
Source: Company data, Deutsche Bank
The Banks and Financials continue to get a Royal Commission thrashing
The ongoing Royal Commission sessions have been brutal for those financial services companies pulled into its vortex. It is worth noting that the Royal Commission was not a comprehensive review of systemic lending practices, but rather an exercise in shedding light on the very worst cases of poor lending practice and outcomes. That is, the banks were asked to present to the Royal Commission their very worst case of bad practice.
From this we learnt that a large part of the problem is third party distribution, i.e. mortgage brokers, who in some instances were gaming the banks’ internal processes. We also learnt that APRA has been tightening bank lending practices for a few years. From this information, we do not expect significant changes to banking practices, with the exception of increased scrutiny and reduced reliance on third party distribution.
Nevertheless, increased compliance costs will continue, and credit availability to consumers will be less in quantum and more difficult to obtain as the banks become more disciplined. Exiting of the wealth management arms has accelerated, leaving only Westpac in a decent position. Given most of the conduct issues have been around the wealth part of the businesses, the simplification of the bank operations can only be viewed positively.
Higher funding costs, accelerated interest-only loan switching and front-to-back-book discounting have all adversely impacted retail banking. The recent Westpac mortgage re-pricing and further non-major bank repricing will help alleviate some of the pressures. We expect the other major banks to follow.
Despite operating conditions not being as rosy as in the past, with credit growth likely to be low for some time, bank valuations look extremely attractive with little short- to medium-term risk around a systemic bad debt cycle.
Banks are currently trading at a 30 – 40% PE discount to All Industrials and the very attractive and sustainable 6.3% fully franked (9% gross) dividend also appeals. The dividend is around 50bps over the long-term average and is at a dividend spread of 230bps over the industrials, which is well above normal levels (Chart 8).
Chart 8: Bank yields vs All Industrials (ex-banks)
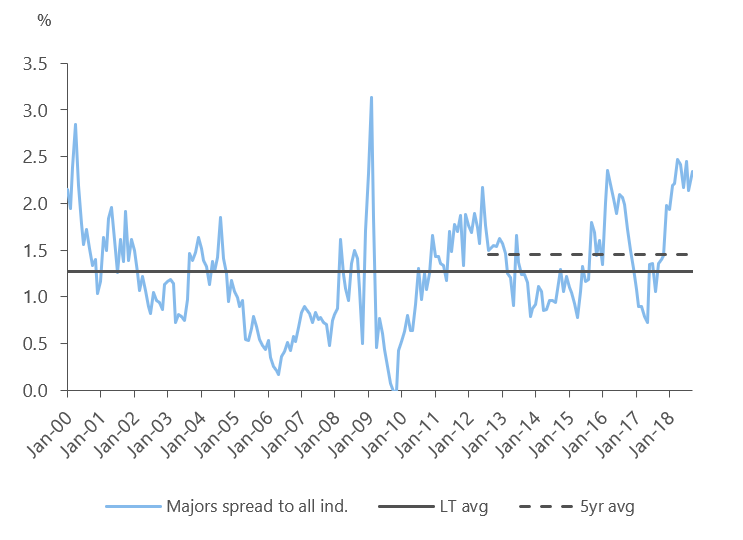
Source: Macquarie
A disciplined approach to Resources
The reporting season validated what long term market observers witness every resource cycle – capex and operating expenses cannot stay low forever as reinvestment is required to sustain the longevity of the assets and production levels. All three major iron ore producers in Western Australia are in the process of spending significant capital for replacement mines. Over the medium to long term we expect iron ore prices to move lower due to the combination of increased low-cost iron ore, and decreased steel consumption out of China. The move will be driven by the government’s desire to transition away from a heavy fixed asset investment to a more balanced economy and a conversion away from iron ore feed blast furnaces to environmentally-friendly scrap feed electric arc furnaces. In the short term, changes in China’s stimulatory policy in isolation and/or in response to the ongoing trade dispute with the USA has the potential to impact prices.
Strong cash flows, balance sheets and likely ongoing capital management are supportive for the major miners. Memories of the inappropriate and costly acquisitions during the mining boom still bare scars in the memories of both shareholders and management. Capital discipline is therefore expected to be maintained.
The fragility within the OPEC nations, strong global oil demand and the operational issues stymieing the USA onshore oil producers to grow production has kept oil prices high. The surprise increase in demand for gas in China that became evident in 2017, has changed the dynamics of the global LNG industry. This is positive for the Australian companies developing new LNG projects and/or which have excess un-contracted production that can be sold into the buoyant spot market. Nikko AM remains overweight energy names given the value we still see.
It’s accounting, stoopid!
Upcoming changes to accounting standards that apply from January 2018 and January 2019 have been called out by a number of companies. In virtually all cases they adversely impact the bottom line in some way. It is, however, worth noting that it is unlikely that any of the changes materially impact cash flows or valuations.
The standards include AASB 9 regarding hedge accounting; AASB 15 addresses the need to recognise revenue when control of the goods or services transfers to the customer, and AASB 16 revolves around recognising leases on the balance sheet, but doesn't take effect until January 2019. Lease recognition is unlikely to make a material impact given banks and debt issuers already include leases when calculating debt serviceability, despite them not currently being on the balance sheet.
Origin Energy was the company hit hardest in this reporting season from accounting changes as they had previously hidden hedge premium costs below the line when calculating the underlying EBITDA. This was a severe hit to both the share price and management credibility, both past and present, as hedge cash costs should always be above the line when calculating underlying earnings.
What changed as a result of reporting season?
Reporting season was largely a non-event from the perspective of the actual underlying earnings with few actual material surprises in either the results or outlook. The surprises came from the market reactions, which at times were just plain inexplicable. Expensive, high PE stocks re-rated further on modest outcomes taking the divergence between the top and bottom PE quintile to levels not seen since the tech bubble of 1999/2000.
The top quartile PE stocks now trade on 30x earnings on average versus the 20-year average of 19.7x.
Nikko AM Australia values companies based on their sustainable earnings capacity. That is, we determine the intrinsic value by capitalising the sustainable or mid-cycle earnings of every stock under coverage. Using these valuations in conjunction with our forecast dividends and franking credits for each stock, we can then compute an expected return for each company under coverage. This provides us with strong signals as to where the best opportunities are in the market.
It is apparent that some of the price moves preceding and during reporting season are not supported by fundamentals. Historically, such periods of irrationality have not been sustained and stock prices have ultimately reverted to valuations supported by fundamentals.
Further insights
For additional analysis and views from the Australian equity team, please visit our website
Never miss an update
Enjoy this wire? Hit the ‘like’ button to let us know.
Stay up to date with my current content by
following me below and you’ll be notified every time I post a wire
Brad joined the business in 2002. He has 28 years’ experience primarily in the funds management and stockbroking industry, and has overall responsibility for managing the Australian equities team, process and portfolios. Prior to joining, Brad was Director, Corporate Finance with Westpac, a Senior Resource Analyst with Ord Minnett and in his early career, a geologist working with a number of resource companies. Brad has portfolio management responsibilities for the Tyndall Australian Share Wholesale Fund and Tyndall CVA Plus Strategy. He has analyst responsibilities for Banks.

1 topic
6 stocks mentioned

Tyndall AM
Brad joined the business in 2002. He has 28 years’ experience primarily in the funds management and stockbroking industry, and has overall responsibility for managing the Australian equities team, process and portfolios. Prior to joining, Brad was...
Expertise
Tyndall AM
Brad joined the business in 2002. He has 28 years’ experience primarily in the funds management and stockbroking industry, and has overall responsibility for managing the Australian equities team, process and portfolios. Prior to joining, Brad was...
Expertise
Comments
Comments
Sign In or Join Free to comment