Value vs Growth and the Divergence to the Extreme
All major value equity indices show that the last five years, and in particular the last 12 months, have been a challenge for value as a style. If we look at any relative valuations or relative performance between value and growth in Australia, globally or the US, we see that we are at relative record divergence levels (see Chart 1). Being at such extreme levels would suggest we are closer to reversion back to the norm.
Looking to the indexes
- S&P 500 growth stocks have been in a bull market -- in relative terms -- for an even longer period than the broader index, which surpassed nine years of gains in March.
- The ratio between the S&P 500's growth and value indexes shows as much. It's been rising for more than 11 years. Along the way, the ratio has come within 3% of a record set in March 2000, the peak of an Internet-driven bull market.
Chart 1: Gorging on growth: S&P growth/value ratio
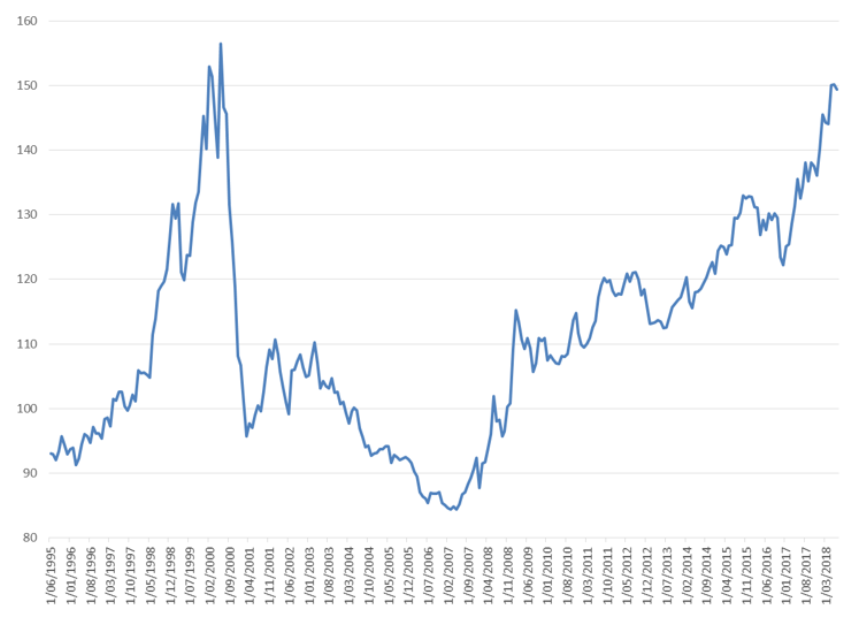
Source: Bloomberg
In the Australian context, using MSCI Australia Value/Growth, we can see similar extremes (refer Table 1).
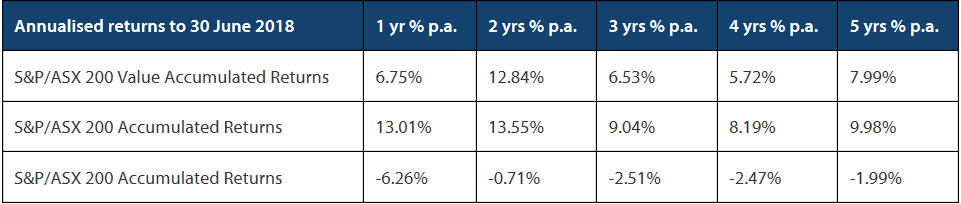
Table 1: Performance of value vs growth in Australia over the last 12 months (to 30 June 2018)

Source: Standard & Poors, MSCI
Style over substance: the Australian market performance
Whichever style index we use, we can see that value as a style in Australia has significantly underperformed over the last 12 months. Arguably, the underperformance is more marked in Australia in the last year. The ongoing Royal Commission into Misconduct in the Banking, Superannuation and Financial Services Industry exacerbated the underperformance of Financials in Australia, which feature prominently in the value bucket right now.
Chart 2: Total returns by style
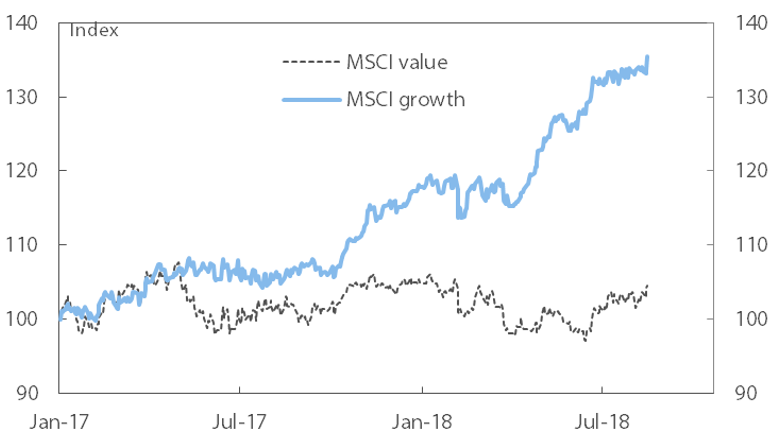
Source: Datastream, Deutsche Bank
Chart 3: MSCI Australia forward PE ratios
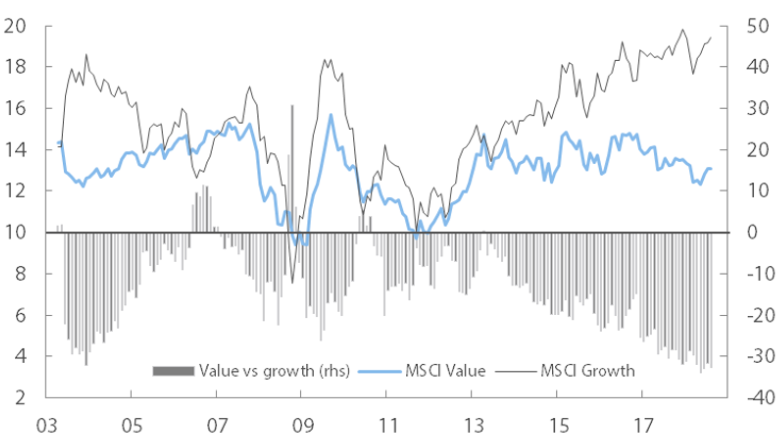
Source: Datastream, Deutsche Bank
Chart 4: Standard deviation of sector forward PE ratios
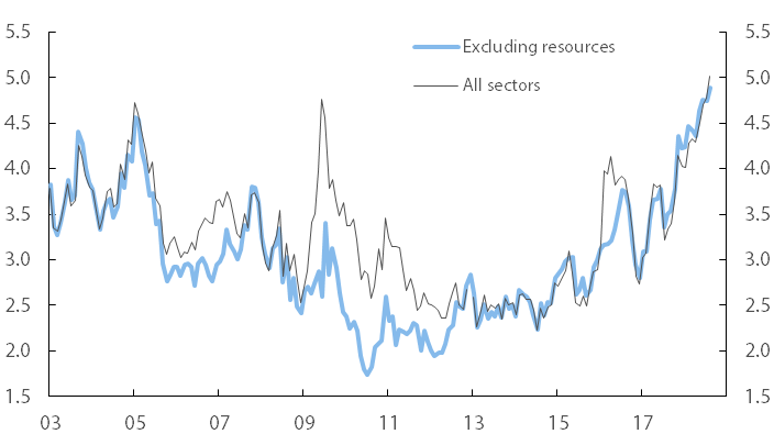
Source: Datastream, Deutsche Bank
The Australian share market has lifted nicely over the last 12 months with a solid double-digit return. Arguably, the Australian share market is not particularly cheap at ~16 times earnings, but, within the context of a low bond yield environment, it looks reasonably priced.
What this market PE does not distinguish, however, are the extreme valuation divergences within it. The market is being led by a small group of growth stocks trading at even higher multiples. In the US, it is the ‘FAANG’ stocks — a select group of high profile tech stocks — that are driving the US share market up.
In Australia, as our tech sector is relatively small, it has been a select group of healthcare stocks (namely CSL, Cochlear), and a bunch of stocks linked to China — particularly Chinese consumers (e.g. A2 Milk, Treasury Wine) — that have performed strongly. Meanwhile, the rest of the market, in particular the ‘value’ stocks, have languished.
Chart 2 shows the divergence in performance between value and growth in Australia, and Chart 3 shows the PEs of these two styles. What these charts show is that from around April 2017, growth’s performance relative to value has been quite extreme, while the PE charts show the performance of the growth style was predominantly driven by PE multiple expansion rather than earnings. This PE divergence is at extreme levels within the context of recent history, as Chart 3 shows, and is more than double the historic average.
So what are the possible explanations for this growth bubble?
The key driver of this is largely due to concerns around economic growth around the world and, as such, the market is paying virtually any price for stocks that offer interesting growth stories, and shunning stocks that are sensitive to the economic cycle. This only accelerated during this calendar year due to concerns about a global trade war, which has the potential to meaningfully impact economic growth in a negative manner. In the case of Australia, we also had the added impact from the Royal Commission, which negatively impacted the share prices of many financial stocks in the value bucket.
An economic perspective
One interesting point about the Australian economy is that we are still at record low official cash rates at 1.5%, and it remains highly expansionary.
While business conditions and confidence remains strong in Australia, we are yet to see the consumer step up. One reason for this is the fact we have not seen any decent wages growth despite low unemployment levels. In the US, we have seen reasonable wages growth and rising cash rates, as the US economy continues to perform well. We are of the view that Australia’s turn has just been delayed and we are at the relative beginnings of a multi-year profit cycle upswing, which will benefit the economically-sensitive stocks. These economically sensitive (or cyclical and financial) stocks are the dominant stocks in the value bucket right now, and where we are currently overweight.
Chart 5: Average of EPS and ASX 200 Price Index during previous four Australian profit cycles
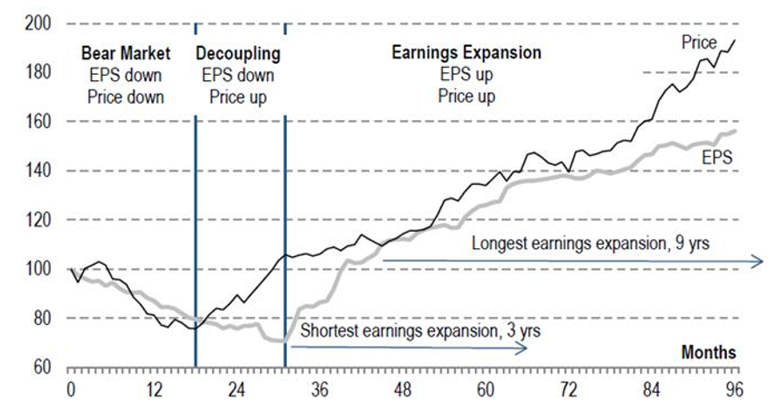
Source: Company data, Credit Suisse estimates
The risks to this view include Australia’s economy continuing to remain subdued. This could occur if there is a substantial and sustained credit squeeze in our economy. While we have seen some credit growth slowing, due to the macro prudential regulations from the regulators as well as the impact of the Royal Commission, at this stage it seems limited and targeted at the more risky end of the lending spectrum.
A global perspective
Global macro shocks are another key risk, including the potential ramifications from a heightening of trade wars between the US and China, as well as the rest of the world. This could create an environment of major risk aversion globally. Other risks include geo-political tensions that could arise due to the many conflicts that are occurring in the Middle East, in China with its posturing over the South China Sea and Taiwan, and in Russia where it continues to create tension on multiple fronts. There is also the potential for a recommencement of verbal threats between North Korea and US/South Korea/Japan if their de-nuclearisation talks falter.
A major headwind to performance
So, while it has been a challenging 2018FY, much of this can be attributed to value style being deeply out of favour as per below.
Table 2
Source: Standard & Poors, MSCI
The moderate snap back to value during the 2017FY turned out to be fleeting, with a quick reversal from around April 2017 back to the prior trend. Value has been punished relentlessly since then.
Given where we currently are in the economic cycle in Australia, and the fact that we have not really seen the valuation differentials at such extreme levels since the GFC and the Tech Boom,
we believe that it is only a matter of time for this growth bubble to deflate and for our value approach to come back into favour.
Nikko AM: Commentary on positioning
We value companies based on their sustainable earning capacity, i.e. we determine the intrinsic value by capitalising the sustainable or mid-cycle earnings of every stock under coverage. While we are bottom-up stock pickers, when markets are increasingly dislocated whole sectors can get cheap or expensive together, as we have witnessed in recent years. As such, our undervalued stock picks can tell us which sectors are cheap or expensive during these time periods.
Over the last few years, we have been overweight the Financials Sector, Industrial Cyclicals, Consumer Discretionary, and, the Energy Sector. We have also been underweight Mining, Health Care, and expensive Bond Proxies such as Utilities, Infrastucture, and REITS. This is all based on our valuations of individual stocks.
If we look at individual stocks, the two largest detractors over the 2018FY were stocks which we do not hold or are extremely underweight, namely BHP and CSL. We note that these two stocks are also the two largest constituents of the S&P/ASX 200 Growth Index.
As a value manager, we are well positioned to benefit when the market normalises and these bubbles deflate. Given the extremes we are seeing right now, history would suggest that this point is getting closer.
The catalyst for this to occur can sometimes just be the fact the market recognises these extreme valuation differences, as it did in early March 2009 when the market turned on a dime at the low point during the GFC.
Further insights
You can access more analysis from the team at Nikko Asset Management here
Never miss an update
Enjoy this wire? Hit the ‘like’ button to let us know.
Stay up to date with my current content by
following me below and you’ll be notified every time I post a wire
Jason has over 28 years’ experience in investment management. Prior to joining Tyndall, Jason worked with ASSIRT and Deutsche Funds Management as an analyst and portfolio manager focusing on strategic asset allocation, managed funds research and risk control.

5 topics

Jason has over 28 years’ experience in investment management. Prior to joining Tyndall, Jason worked with ASSIRT and Deutsche Funds Management as an analyst and portfolio manager focusing on strategic asset allocation, managed funds research and...
Expertise
Jason has over 28 years’ experience in investment management. Prior to joining Tyndall, Jason worked with ASSIRT and Deutsche Funds Management as an analyst and portfolio manager focusing on strategic asset allocation, managed funds research and...
Expertise
Comments
Comments
Sign In or Join Free to comment