One chart property investors won't want to see

Chad Slater
Ellerston Capital
Two years ago this month, Morphic made a rare foray into the “battleground” that is Australian property views. We say battleground because, a bit like schooling, everyone has an opinion as everyone has an experience and that opinion is directly shaped by their personal experiences. Hence an area where emotions run high and sadly logic, low.
What happened since our blog?
Without recapping the whole article, we pointed out that a lot of the bull cases can be applicable to other scenarios, some of which didn’t work out so well for the bulls. Our conclusion was that we were witnessing something more prosaic:
"Whilst we await the comments about how it’s different here in Australia, we would posit it’s something a bit more prosaic. The country is at the back end of a 25-year credit fuelled expansion (Figure 4). The gearing up of Australia to buy property just means that an “accident” when it occurs will have much larger ramifications than expected".
The below chart shows Sydney house prices indexed to 100 for when we wrote the article (dotted yellow line) overlaying the Miami house prices chart from the original article. In October 2016, our thesis was that Sydney property prices were the following Miami/USA house price cycle of the early 2000’s, perhaps not in magnitude, but the stages of euphoria.
Figure 1 – Miami house price chart (January 2001 – July 2016) vs Sydney house price (March 2011 – October 2018)
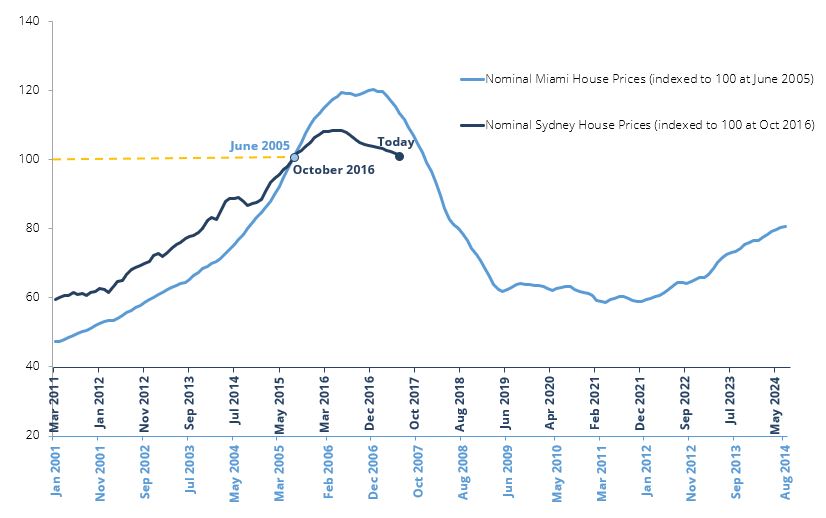
Source: Bloomberg, Team Analysis
Hindsight says that in both cases, the plethora of newspaper articles about “not building any new land” occurred about 18 months before the peak. Notably, Sydney peaked out at lower levels than the euphoric sentiment would have suggested and began the decline faster, rather than a usual “topping” process of going sideways whilst bulls and bears reach a new equilibrium.
With retrospection, it seems now that the “accident” event which could accelerate a sharper fall in prices is looking like the Hayne royal commission and the resultant collapse of credit availability coupled with Trump’s fiscal largesse. The latter has pushed interest rates up globally which leads to lower expected property prices given the duration of property as an asset as we’ve written before about.
This accident came into a market that had seen an expansion of supply, making it easier for the “ground to give”.
Credit determines house prices, wages determine rent
This was and still is the least understood part of property prices: credit determines house prices, wages determine rent. How so? Think of it this way – if you had to pay cash for a house, what price would the market clear at (i.e. buyers and sellers meet)? It would clear, but I would suggest a low number, as the number of people who can pay cash is limited.
Conversely, if the bank offered you a $100m, non-recourse loan, what would most people do? They’d avail themselves of it and buy a place in Point Piper! Banks determine house prices in the short to medium term (of course over the very long-term income still does).
For rents, on the other hand, people can’t afford to pay more than a certain percentage of income. There is simply no way for them to pay more in most cases, so wages determine rent.
Once banks started to ration credit, using the above framework, it’s clear that housing prices are the things that “give”.
Where to now?
Investing in crudest terms involves evaluating multiple paths, choosing the most likely and assessing whether one is adequately compensated for those risks. So, let’s start with the most likely and arguably best case for property and focusing on Sydney here:
Benign Outcome: As both Morgan Stanley and AMP have written, they now see a 15-20% fall in prices for Sydney. Given the market is already down nearly 7% from the peak, and the most recent month saw annualised falls of 6% – which would take the number to 13% if just the status quo continues – that’s got to be a base case. Auction clearance rates in the 40% range suggest this as well.
Figure 2 – Capital city prices & auction clearance rate
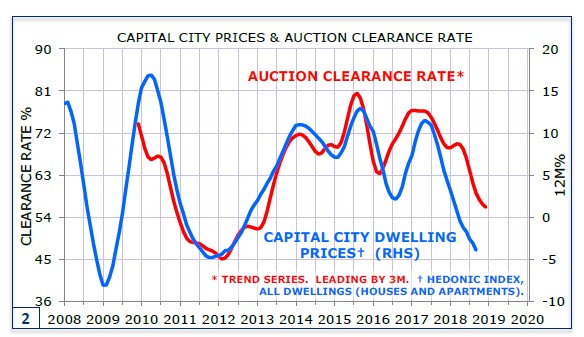
Source: Minack Advisors, Team Analysis
Current run rates would see that peak to trough fall hit in late 2019 or early 2020. Our analysis of the duration effect of higher interest rates pushing through is consistent with this date. The simple extrapolation in Figure 1 comes to a similar timeframe for bottoming.
On the positive side, with unemployment falling towards 5%, wage growth is likely to be less anaemic over the coming year. Quite simply, people who have jobs don’t default on their mortgage. By 2020, that would see house prices where they were in 2015 in nominal terms, meaning they were even cheaper in real, inflation-adjusted terms.
Malevolent Outcome: There is a worse outcome, the odds of which continues to rise in our opinion. If we look back at the US situation of 2007-09, the economy was on track for a “standard recession” led by the aforementioned housing slowdown and rising interest rates. The collapse of the banking system was precipitated not mainly by Collateralized Debt Obligations (CDOs), rather the decision to let Lehman go bankrupt. This caused the machinery of credit and banking to seize up, almost fatally wounding the world. It is not our belief that housing was the cause of the outcome, but rather it began the fire to which an accelerant was added. Australia largely escaped that, thanks to fiscal expansion both here and in China. Today, if we look at 2019/20, there is a risk that US monetary policy is forced to tighten much harder coupled with the aftereffects of a US/China trade war and of rising oil prices. Global growth indicators continue to slow into the end of 2018. The risk is that this time Australia goes into a global recession with a decelerating housing backdrop.Under this scenario, with only 150bps of “ammunition” to 0% interest rates, the RBA doesn’t have much to support house prices.A fall of 20-30% peak to trough is more likely. We doubt it will be much more, because we have a flexible exchange rate which could soften the blow, but losses in US dollar terms would be substantially higher.
What to do?
In our original piece, we said that Foreign exchange and bond markets were offering you a gift to swap out Australian dollars to protect your wealth in global purchasing terms. The exchange rate was 78c/USD then; now it is 71c/USD. So, some of the “gift” is gone, but the above scenarios both see Australian interest rates going a different direction to US ones, putting consistent downward pressure on the AUD. Oh, and you get a higher interest rate paid as well!
With a base case of making zero nominal return over 5 years, a downside skew and therefore a negative expected return, Sydney property strikes us as a trade where one is not adequately compensated for the risks.
Want to learn more?
For more information and additional insights from Morphic Asset Management, please click here
Never miss an update
Enjoy this wire? Hit the ‘like’ button to let us know.
Stay up to date with my current content by
following me below and you’ll be notified every time I post a wire
Chad co-founded Morphic Asset Management in 2012. As a stock picker Chad is also a generalist but has strong regional knowledge of Europe and the Americas. He has also been awarded the CFA Charter.

1 topic
Chad Slater
Co Head Global Equities (ex-Asia)
Ellerston Capital
Chad co-founded Morphic Asset Management in 2012. As a stock picker Chad is also a generalist but has strong regional knowledge of Europe and the Americas. He has also been awarded the CFA Charter.
Expertise
Chad Slater
Co Head Global Equities (ex-Asia)
Ellerston Capital
Chad co-founded Morphic Asset Management in 2012. As a stock picker Chad is also a generalist but has strong regional knowledge of Europe and the Americas. He has also been awarded the CFA Charter.
Expertise
Comments
Comments
Sign In or Join Free to comment