Australia’s GDP Release: New forecasts and reactions were based off almost nothing
The reactions following the release of Australia’s most recent GDP figures provide an opportunity to consider whether such announcements provide useful information for forecasting purposes. It turns out that we hardly know where we were last quarter, which makes forecasting a rather wild activity.
The Announcement
The Australian Bureau of Statistics released the GDP report for the December 2018 quarter on Wednesday 6 March 2019. The headline figure was 0.2% seasonally adjusted. The market consensus was 0.3%.
The Reaction
The markets reacted as might be expected. Over the day, yields on one-year government bonds declined by 4bps. The 10-year bond yield fell by a similar amount. The AUD declined against the USD by close to 0.6%. These moves were material in the context of their general character.
It may be an indication of an upcoming federal election when the admittedly catchy phrase “Per Capita Recession” reaches the headlines. Along with this came the reports from respectable and knowledgeable economists who commented on the future path of the RBA cash rate.
Inevitably, consideration was given to the wealth effect pursuant to weaker housing prices. Consumers were becoming more reluctant to spend as their wealth declined. On the other hand, the prospect of long awaited real wage rises remained a focus. The RBA’s bias had shifted to a more balanced perspective between these two alternatives in recent times, having previously favoured the re-emergence of real wage growth as labour conditions tightened.
The markets, as implied by the pricing of near-term financial instruments, assigned a greater probability to the prospect of weakening housing prices weighing on consumer demand. A view favouring a tightening bias, which had been in place as recently as November of 2018, has now become distinctly bearish. The market is confident that the RBA Cash Rate will be a notch lower in a year, with the GDP announcement (highlighted in red) contributing substantially to that perspective:
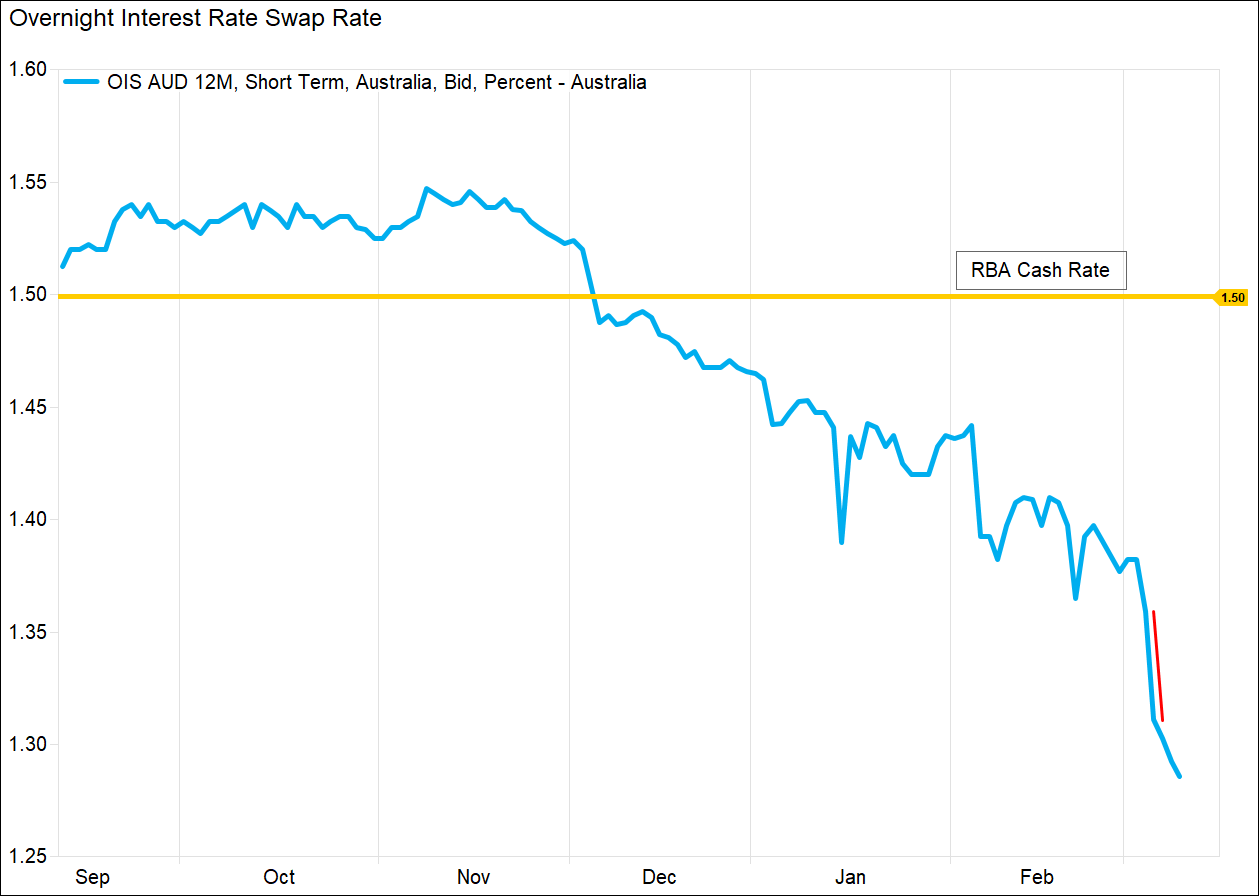 Source: FactSet
The announcement has prompted some well-known and highly-seasoned economists to forecast a second rate cut this calendar year. In general, they believe that the RBA’s existing forecast for growth in the near term will have to be downgraded. This would contribute to a decline in expectations for employment and wage inflation. A quick sequence of rate cuts naturally follows.
In at least some of these cases, consideration was given to finer details. A small rise in the household savings rate indicated lower consumer confidence. Observations relating to dwelling construction and the outlook for exports were also offered.
What was Australia’s GDP Growth Rate in December Quarter 2018?
No one really knows.
The figure reported by the ABS was 0.2% but this figure is revised for more than four years. This occurs because there are many technical challenges encountered when preparing these figures. For example, some measures are based off sample surveys in the first instance and more accurate estimates are received over time. Over relatively short periods like a quarter, there can be mismatches between the timing of revenue received and expenses for the production of an item.
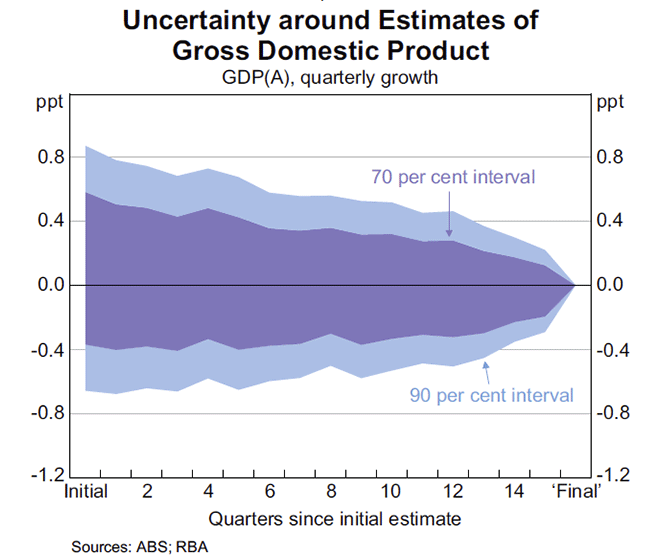
In 2013, the RBA examined how large these revisions were. When examined over a 15 year period, over 90% of quarterly GDP figures were revised by up to +/- 0.7% over the subsequent 4 years. In other words, if past revisions are any guide, the December quarter might turn out to be anything from one of the strongest we’ve seen in recent years (around 0.9%) to one of the worst (around -0.5%).
The following fan chart shows how the initial reports gradually converge towards a ‘final’ figure nearly four years later:
What was any country’s GDP Growth Rate in the December Quarter 2018?
Once again, no one really knows.
The uncertainty around the GDP estimates is not restricted to Australia. In 2015, the OECD examined the issue across a range of countries looking at data relating to the first publications and their subsequent revisions over the following three years:
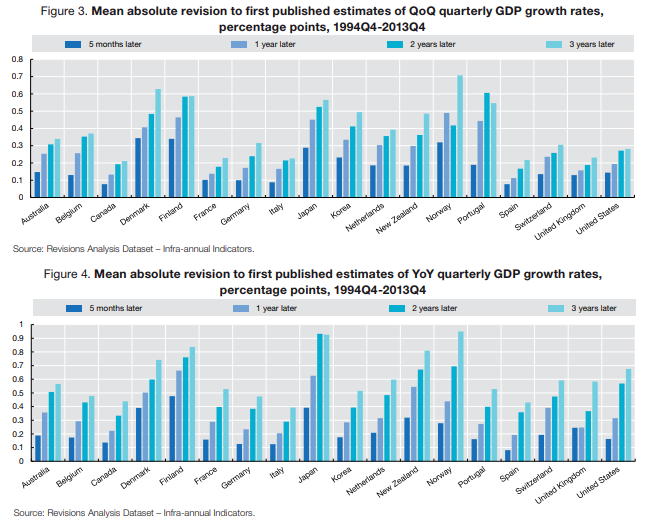
The uncertainty around the Australian figures is around the average for the OECD sample of major economies. Whilst China is not amongst these economies, a recent study by Chen et al was presented to the Brookings Institute and found that the reported GDP between 2008 and 2016 had been overstated by approximately 2% per annum.
Forecasting anyone?
There clearly is demand for forecasts. Forecasts are required for planning. They may even provide a sense of safety if we need believe that someone out there knows what is going on and is in control of things. Forecasts also sell a lot of copy.
Economists are often maligned for their lack of forecasting ability. Economic forecasting has been unkindly compared to driving around a mountain road with only a rear view mirror as a guide. Rather than accuracy, much research in to the value of forecasts focuses instead on whether they are biased to the high or low side. However, the task of forecasting the broadest measure of national growth begins without accurate knowledge of where we were even a year ago. It turns out that the rear view mirror has a thick layer of grease smeared on it.
It already requires considerable skill to figure out where we are right now. Forecasting years into the future from such an uncertain starting point surely dooms any hope of high confidence in the accuracy of point forecasts. However, “I don’t really know” is not an acceptable position to take in some settings.
The RBA says “I don’t really know” another way. It publishes an interval band around the forecasts it makes. These are informed by the historical inaccuracies in the relevant forecasts over the period since 1993. This chart is taken from the February 2019 Statement of Monetary Policy:
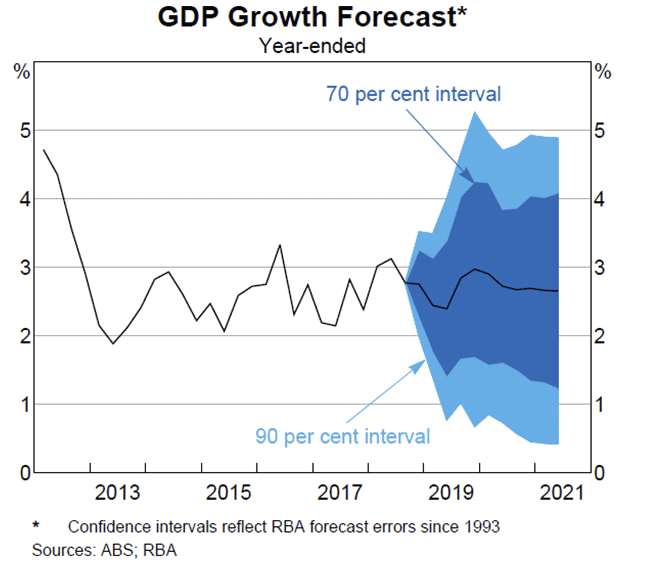
The RBA makes no claim about unusually accurate insight. To the best of its knowledge, on this basis, GDP for 2019 will be within a range of 1% to 5% with 90% likelihood. Even the narrower 70% confidence band spans 1.7% to 4.1%. That is a truly wide range of forecast outcomes with distinctly different implications. To provide further context, these ranges of uncertainty are wider than those realised from the rolling one-year GDP outcomes over the last 20 years.
The breadth of the fan chart highlights that a 0.1% miss in the latest GDP figure should hold little basis for a significant revision to whatever viewpoint we may have had just a few weeks ago.
Where to now?
Strong forecast statements may encourage some to think they arise from an accurate handle about the future. However any perception of confidence is at odds with the reality that we are unsure about where we are even at this moment. The issue of an unclear starting point is not restricted to the GDP measure, but spans most key economic variables.
In recent times, for example, it has been quite common to discuss the actions of the central banks in terms of being ahead or behind the curve. The RBA has done nothing in the last year, but according to consensus, it has been both behind the curve and seemingly ahead of it too. Personally, I would be quite satisfied with just having some notion of whether it is a curve at all.
As an investor, these observations argue for taking a long term perspective and acting in a contrarian manner at some level. It is a feature of markets that fashionable thoughts come and go. Those touting the tail forecasts, which extrapolate recent moves, will always receive disproportional attention. It may even be that some forecasters seek to draw attention by being outliers.
When one-year forecasts are close to random, it seems appropriate to ignore them for the most part and look to the longer term for more durable relationships. It is also possible that behavioural finance concepts might also come in to play when reactions appear out of step with the fundamentals.
Although shrouded in uncertainty, economic analysis is a valid and useful endeavour. Analysis of economic developments can be useful for context and for planning various contingencies.
Am I being too harsh on point forecasts? I suppose there is always the chance of them being accurate once in a while. Of course, it might take around three to four years to realise they were right after all.
Never miss an update
Enjoy this wire? Hit the ‘like’ button to let us know.
Stay up to date with my current content by
following me below and you’ll be notified every time I post a wire
Ken is a partner at Realm Investment House. He was Head of Investment Research at Mercer and Chief Investment Officer of Domestic Equities at BlackRock.


Ken is a partner at Realm Investment House. He was Head of Investment Research at Mercer and Chief Investment Officer of Domestic Equities at BlackRock.
Expertise
Ken is a partner at Realm Investment House. He was Head of Investment Research at Mercer and Chief Investment Officer of Domestic Equities at BlackRock.
Expertise
Comments
Comments
Sign In or Join Free to comment