Australian cash rate to keep falling
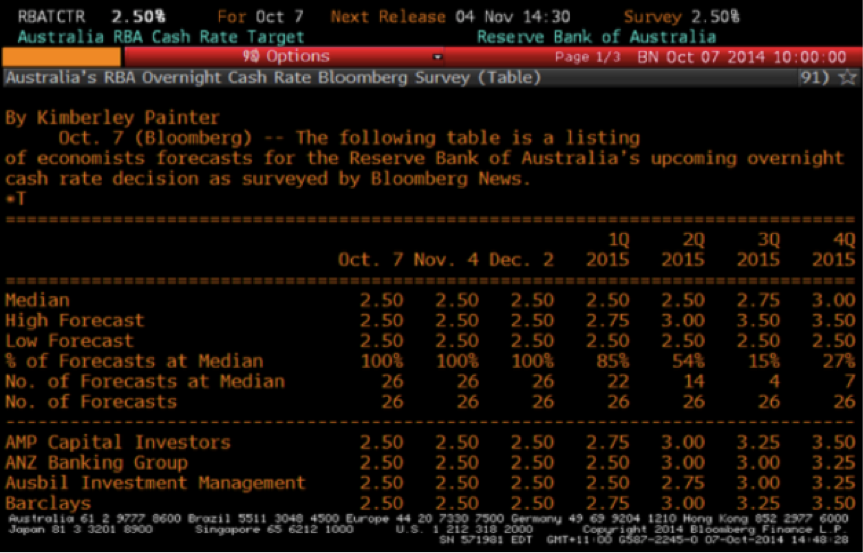
Yesterday, Australia got a long overdue official wake up call, with the nation’s GDP declining by 0.5% in the September quarter. What is truly astonishing in light of the weakness we are seeing across the economy right now is how ‘hawkish’ the market is regarding interest rates, with many commentators still clinging to the belief that the RBA is done cutting, and that the current cash rate of 1.50% represents the low for the cycle. We think the market is as wrong now as it was a few years ago, when a market survey in late 2014 by Bloomberg found that 23 out of 23 economists thought 2.5% would be the low in the RBA cash rate, as per the image below. Rates have of course been cut a further four times since, and in our opinion, they have a lot lower to go.
Whilst the Aussie GDP number will almost certainly bounce back in the next quarter, and we are in no real danger of falling into an ‘official recession’ any time soon, the shocking headline figure should leave you in no doubt as to just how soft the Australian economy really is right now.
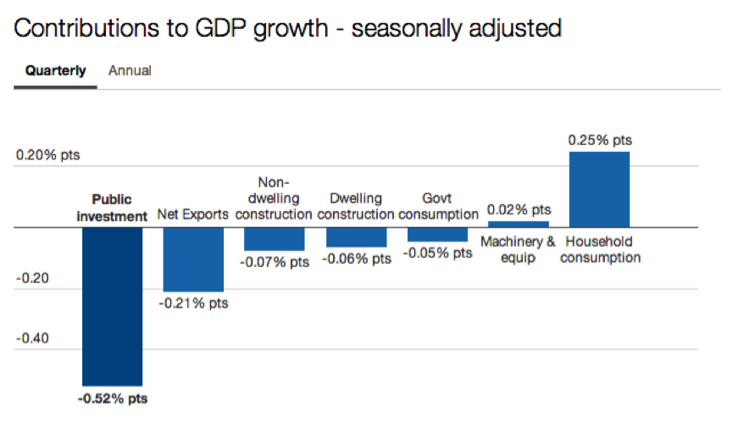
Indeed of the major contributors to GDP (government and household consumption, private and public investment, and net exports), only household consumption was a positive contributor for this quarter, as the chart below highlights.
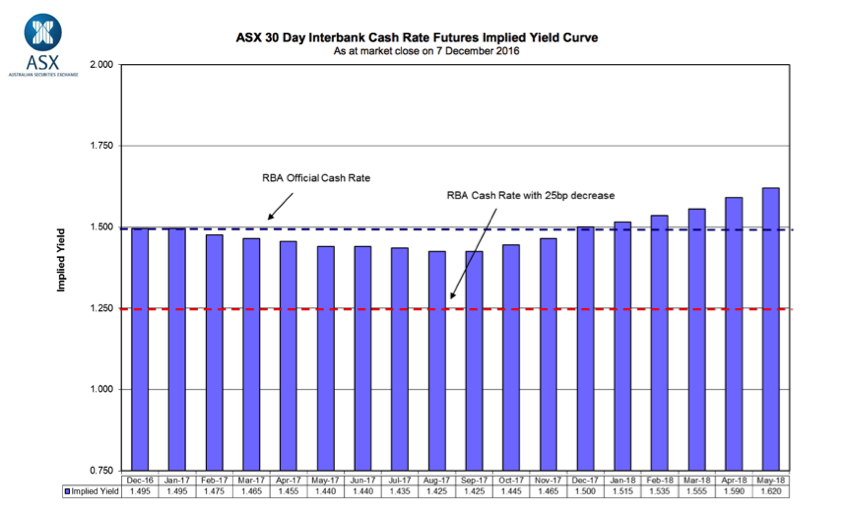
Indeed the ASX cash futures market (see image below), is not currently expecting any further rate cuts next year, and actually sees higher rates on the horizon, though not til 2018 it must be said.
We think that despite their fear of stoking a property bubble on the East Coast, the RBA will end up being forced to cut. After all, the Australian consumer is extremely leveraged, with record private debt levels. They also have little in the way of free cash flow (the household savings rate, which includes compulsory superannuation, is just 8% now, down from close to 10% in 2013), and faced with higher levels of underemployment and record low wage growth.
Australian businesses are also reluctant to invest, with further unwinds in mining capital investment to come, whilst we’ll also have to reckon with the pending closure of the car industry.
Finally, we have also likely the seen the peak for home building construction, which had been a major boost to the economy and to employment for the last few years.
Net exports will probably hold up, though the team at Capital Economics are not so sure, arguing that Australia may actually already be in a recession. Even if the volume (which is what counts for GDP) of exports performs reasonably in the years ahead, at the very least we expect the freakish rise in iron ore and coal prices that has taken place this year will at the very least run out of steam, if not completely turn around next year.
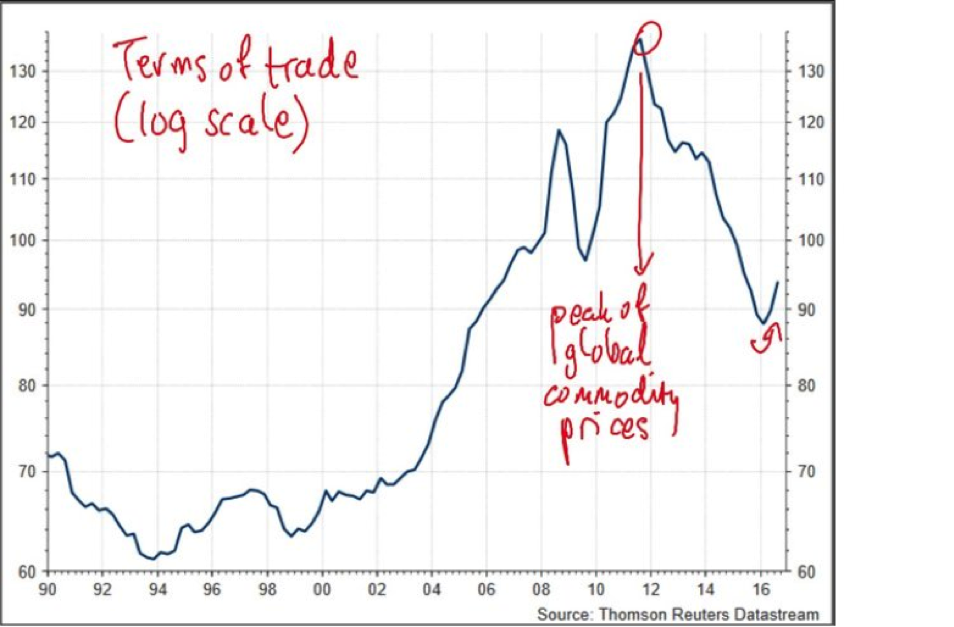
Those price rises in key commodity exports delivered a boost to nominal GDP this year, but one would need to be incredibly optimistic to expect the gains to continue, with out terms of trade, whilst well below the peak levels reached in 2011, still incredibly high by historical standards (see chart below).
This in turn will have negative implications for a Federal budget already creaking under the strain of lower than expected tax receipts, with the AAA rating almost certainly under further threat in 2017.
If we don’t lose it, at the very least you can expect to hear a lot of warnings that it’s only a matter of time, whilst the already unbearable levels of political gridlock and the focus on trivial issues (think backpacker tax) that we see from Canberra will likely worsen if get any closer to a ratings downgrade or a formal recession.
Indeed, whilst it is easy to make far too much out of any one headline GDP reading, we think what we saw released yesterday merely revealed a long growing trend of domestic economic weakness.
For evidence of this long growing slowdown, consider the chart below, which was carried in a Business Insider article and produced by Dr Andrew Charlton, founder of economics consultancy, AlphaBeta.
The chart shows reported GDP figures for the last three or so years in the dark line, and what AlphaBeta called “Adjusted GDP growth”, which strips out anomalies, including a huge public spending boost in the June quarter, to give a truer picture of what’s happening in the economy.
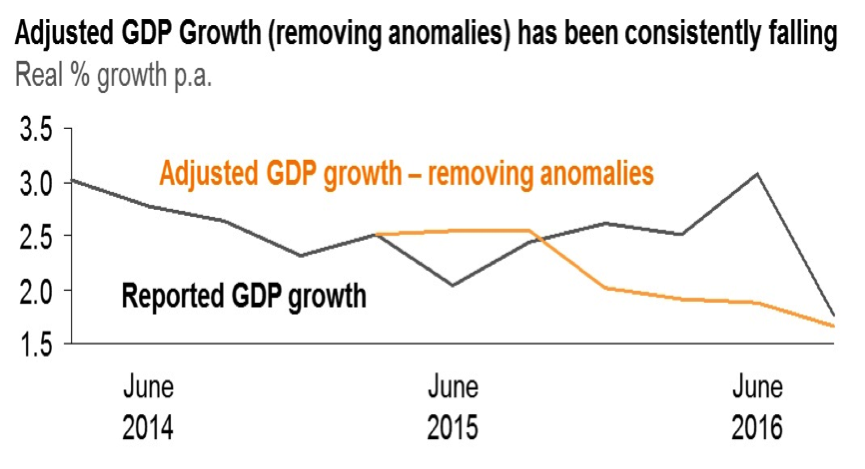
As you can see, “Adjusted GDP growth” has been declining for well over a year. Record low wages and the lack of growth in full time employment opportunities that we are seeing right now make a lot more sense if we look at the economy through this kind of lens.
Indeed, were it not for the property construction (and price boom) in much of Sydney and Melbourne, we have no doubt rates would already be much lower in Australia, something that the folks at SGS Economics and Planning would no doubt agree with.
They conducted an interesting study recently, which looked at all the major cities, territories and regions in the country, and tried to estimate what an appropriate cash rate for each area would be.
Not surprisingly, they found that the appropriate cash rate for Sydney (3.75%) was much higher than the official 1.50% cash rate, with the appropriate rate for Melbourne (2.25%) and the Northern Territory (3.50%), also above the current setting dictated to the nation by the RBA.
The chart below highlights where the team at SGS think rates would be set in various parts of the country, including Adelaide, Brisbane, Tasmania and Western Australia.
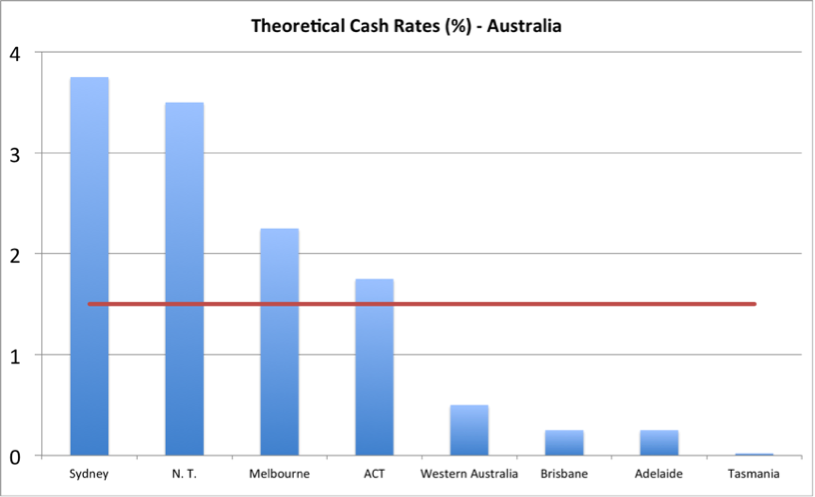
As you can see, according to SGS, US/UK style interest rates of less than 1% are appropriate for large parts of the country, with regional areas in every state needing rates as low as 0.25%.
Considering the likely peak in housing construction on the East Coast, and a potential plateauing (not crash) in property values in Melbourne and Sydney, we think there is a much greater chance that the ‘appropriate’ cash rate in these cities will decline to the levels already deemed necessary in other parts of the country that are seeing a faster pace of economic deterioration.
Certainly we see little reason to think that the economy in WA, SA or Queensland is set to pick up steam any time soon, which would allow for higher appropriate cash rates, especially with mortgage arrears across the country some 25% higher than they were a year ago, with these three states (WA/SA/Qld), the most severely affected, according to a study by S&P.
With that in mind, we are quite comfortable repeating our forecast of a comfortably sub 1% cash rate in Australia in 2017. Should this transpire, it is something that will no doubt lead to even higher levels of physical gold demand from risk conscious investors, especially if it coincides with a further decline in the Australian dollar.
Extract taken from my Final market update for 2016. To read in full, including my thought on the precious metals markets, please click here: (VIEW LINK)
Never miss an update
Enjoy this wire? Hit the ‘like’ button to let us know.
Stay up to date with my current content by
following me below and you’ll be notified every time I post a wire
Gold and precious metal bull since early 2000. Have spent +25yrs working in investment analytics, research & portfolio construction, with a primary focus on the role of precious metals in investor portfolios. Author of two books on investing in gold and the causes of the GFC. Lover of markets, competition & technology
.jpg)
1 topic
.jpg)
Gold and precious metal bull since early 2000. Have spent +25yrs working in investment analytics, research & portfolio construction, with a primary focus on the role of precious metals in investor portfolios. Author of two books on investing in...
Expertise
Gold and precious metal bull since early 2000. Have spent +25yrs working in investment analytics, research & portfolio construction, with a primary focus on the role of precious metals in investor portfolios. Author of two books on investing in...
Expertise
Comments
Comments
Sign In or Join Free to comment