TOL - 1st Sep, 2025
BHP, Rio Tinto, Mineral Resources, Sandfire, or Pilbara Minerals – which is the cheapest ASX mining stock?
Our search for the best value ASX mining stock continues! But this time we dig deep into the data… Which stock will reign supreme!?
On Monday, I wrote an article about finding value in the ASX resources sector. It was based on the latest Morgan Stanley research data on spot commodity pricing versus a selection of ASX mining companies latest share prices, as well as the broker’s latest commodity price forecasts. The article did very well (yes, you love your mining stocks!!!), so I thought I’d broaden the search for “The Best Value ASX Mining Co.” to encompass a few more metrics.
At Market Index, we have access to extensive individual broker and consensus data for pretty much the entire ASX. So, let’s unlock some of this data for you, and hopefully help you make better decisions about which ASX mining stocks to add (or cut!) from your portfolio.
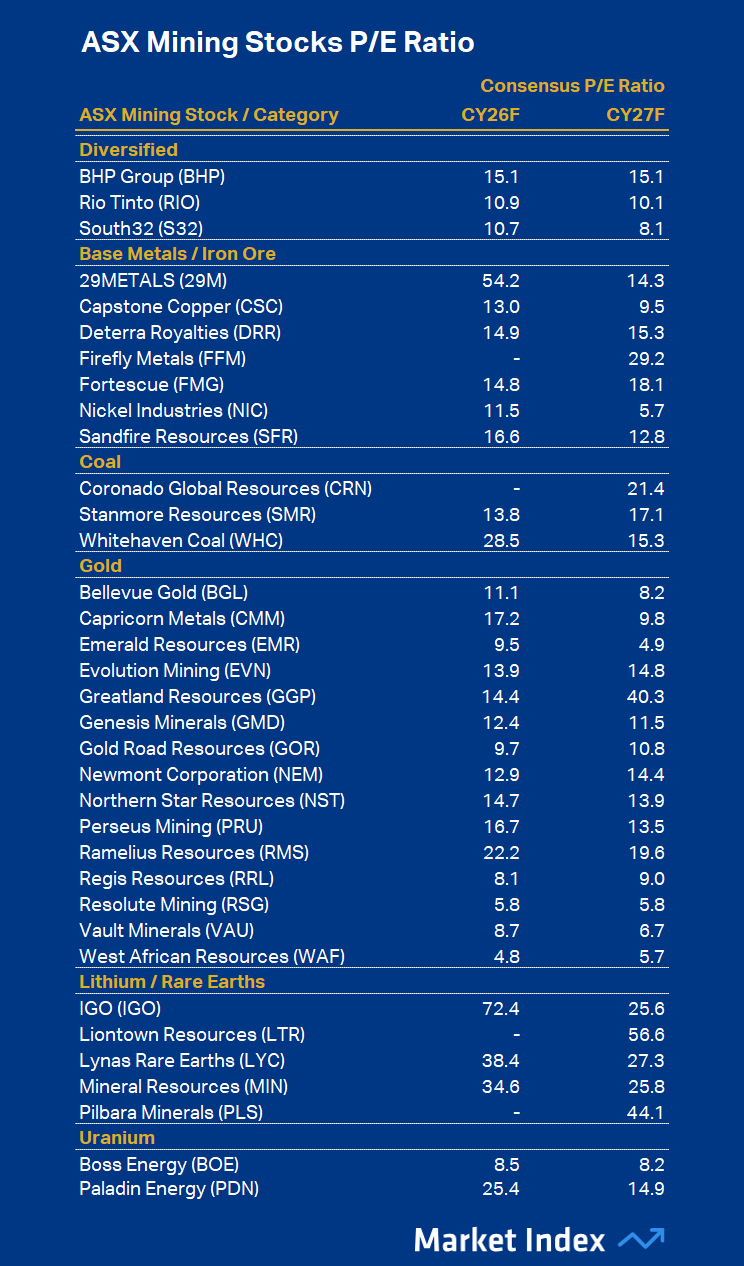
ASX Mining Stocks P/E Ratio Comparison
Where to start? Best value? Okay, P/E Ratio is as good as any place to start. It’s arguably the most widely used tool for comparing value across stocks. It’s best used in a relative sense, not an absolute sense – i.e., across a sector like we’re doing today. Apples with apples so to speak.
If you’re not au fait with the P/E Ratio, as its name suggests, one simply divides a stock’s share price by its earnings. Be sure to use forecast data (e.g. the broker consensus data for 2026 and 2027 as we’ll use throughout today’s search), because historical data is pretty much considered worthless by professional analysts – the future, not the past matters!
The P/E Ratio tells us how much we’re paying in terms of share price for a company’s earnings and is often called a stock’s “payback period”. So, for example, if a stock has a price of $10 and earnings of $1, its P/E Ratio is 10, or “10 times”, or “10x” as we say, and it means it would take 10 years at the same rate of earnings to recoup your initial investment.
The shorter the payback period, the better (because we want our money back as soon as possible), so this means a lower P/E Ratio is generally preferred to a higher P/E Ratio. That’s the crux of it, but there are some tricks and traps which you can read more about in this article I wrote a couple of weeks ago.

The table above shows the forecast P/E Ratios for calendar year 2026 (“CY26F”) and 2027 (“CY27F”) for a selection of major ASX mining stocks based on information from global research and data provider Visible Alpha. I have used yesterday’s (27 August) closing price for each stock.
Note that in order to focus the comparison(s), I have grouped each stock with stocks in a similar commodity segment, so again, we can compare like for like. However, as we are comparing all mining stocks here, there’s less of an issue in comparing say, copper miner Firefly Metals (FFM) and gold-copper miner Evolution Mining (EVN) – perhaps either of these two versus Ramsay Healthcare (RHC), for example!
Still, I’m going to refrain from making a broad statement like XXX is the cheapest ASX mining stock because it has the lowest 1-year forward P/E Ratio, and point out that within the groups, these stocks deserve special mentions:
Base metals / Iron Ore: NIC, CSC
Coal: SMR
Diversified: S32, RIO
Gold: WAF, RSG, RRL
Lithium / Rare earths: MIN (iron ore crossover noted!)
Uranium: BOE
Clearly, the cheapest ASX mining stocks in terms of P/E Ratio (based on CY26F) tend to reside in the Gold sector, with some notable performances from S32, and RIO in the Diversifieds, CSC and NIC in the Base Metals, and BOE in Uranium.
I’ll let you peruse the CY26F vs CY27F comparisons, because there are some significant differences, as some companies are clearly in the process of ramping up production, and therefore profitability. However, note that the longer one looks out, the greater the execution risk…
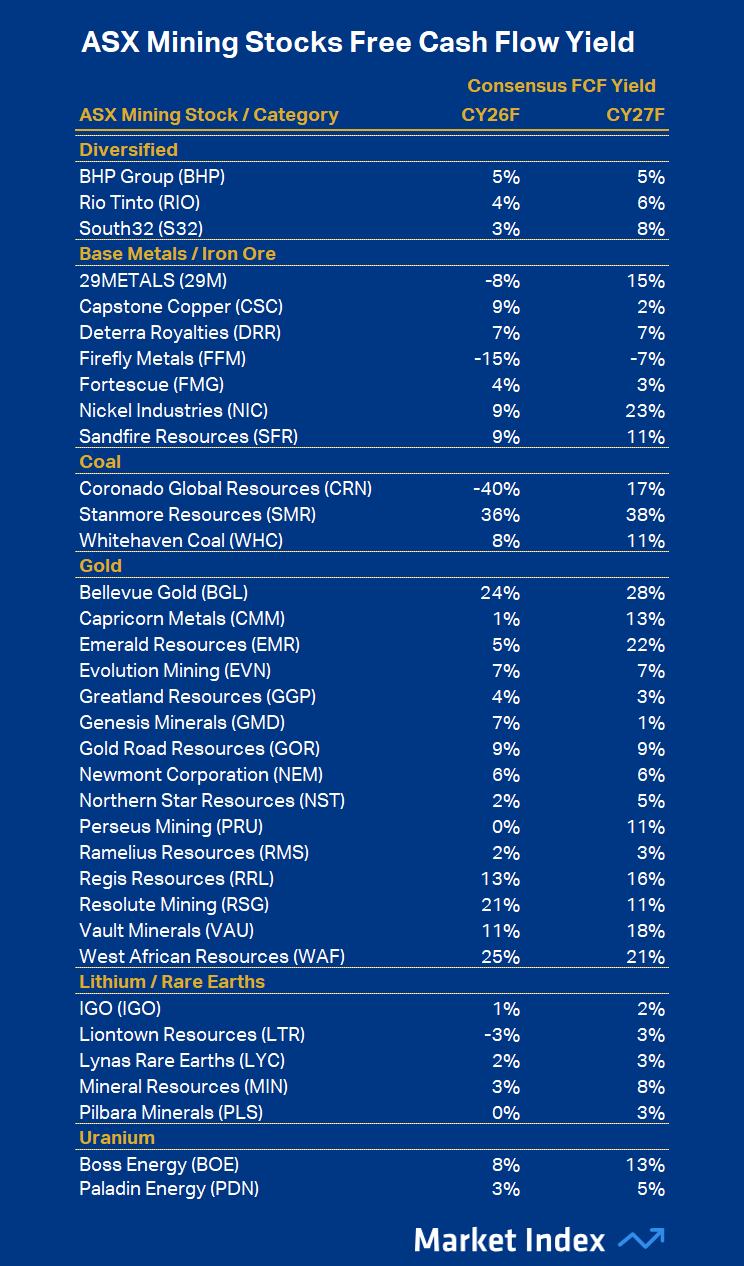
ASX Mining Stocks Free Cash Flow Yield Comparison
Free Cash Flow (FCF) is the cash a company generates from its operations after paying for all the capital expenditure (capex) needed to maintain and grow its assets, such as new mines or equipment. In other words, it’s the money left over after covering the big bills.
FCF Yield takes that number and compares it to the company’s market value (market capitalisation). It tells investors how much free cash flow they’re effectively getting back for every dollar invested in the stock. A higher FCF Yield generally means better value, because the company is generating more cash relative to its share price. A low or negative FCF Yield can signal poor value or heavy spending that reduces near-term returns.
Why FCF Yield?
Strengths:
Tells you how much actual cash the business generates relative to its market cap.
In capital-heavy sectors like mining, where sustaining capex and project development swallow large amounts of earnings, free cash flow is often a truer measure of “value”.
Complements Dividend Yield: investors can see how much of the free cash flow is being returned vs reinvested.
Weakness:
More volatile year to year, heavily influenced by commodity price swings and project timing.
Requires reliable forecasts, which can vary widely (don’t worry, ours are reliable!).

The table above shows the 2026 forecast FCF Yield for our selection of major ASX mining stocks, again sourced from Visible Alpha data. I feel that these stocks deserve special mentions for their attractive FCF yield:
Base metals / Iron Ore: CSC, NIC, SFR
Coal: SMR
Diversified: BHP
Gold: WAF, RSG, BGL
Lithium / Rare earths: MIN
Uranium: BOE
A similar result to our P/E Ratio analysis, with roughly the same group of stocks showing the most attractive FCF Yield within their respective segments. I note BHP comes in as a slender beat in Diversifieds, SFR comes in to join CSC and NIC in Base Metals, and BGL replaces RRL in Gold.
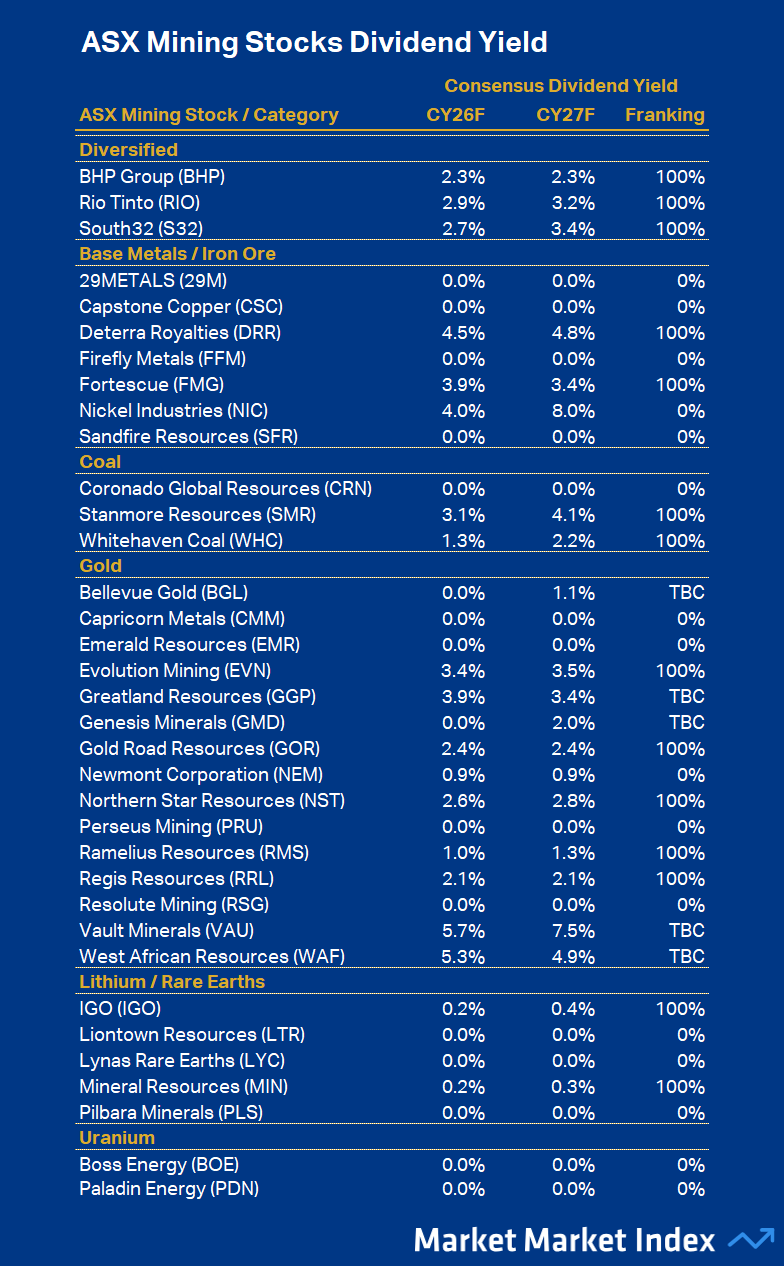
ASX Mining Stocks Dividend Yield Comparison
Okay, now for the one I know all you income investors have been hanging out for… Value, sure, that’s good – but how fat is my divvy cheque going to be every six months!? 🤑
For those who aren’t familiar with dividend yield, it’s simply dividend divided by the share price. Much like the yield on a term deposit, it tells us what periodic return we can expect on our investment. So, if a company pays an annual dividend of $1 per share, and has a share price of $10, it has a dividend yield of 10%.
For ASX stocks, franking credits are also important. Franking credits are tax offsets attached to dividends, representing company tax already paid. For Australian resident investors, they reduce personal income tax or (if one’s marginal tax rate is low enough) may even generate refunds. This makes dividend-paying stocks – especially fully franked ones (i.e., “100%”) – more attractive, as investors keep more of the company’s profits after tax.

The table above shows the 2026 forecast dividend yields and franking credits for our selection of major ASX mining stocks, again sourced from Visible Alpha data. Unfortunately, it’s somewhat a case of slimmer pickings here, with only just over half of the companies expected to pay a dividend in 2026. Several are forecast to do so for the first time, like Genesis Minerals (GMD), and therefore the level of franking of their dividends is unknown at this stage. I feel that these stocks deserve special mentions for their attractive dividend yield:
Base metals / Iron Ore: DRR, NIC, FMG
Coal: SMR
Diversified: RIO
Gold: VAU, WAF, GGP
Lithium / Rare earths: n/a
Uranium: n/a
Mining stocks are capital intensive, and many of the stocks in the above list are heavily investing in production, so that dividends may flow down the track. How do you like my best explanation for why we’re not having our socks knocked off with a deluge of fantastic dividend yields? But, it’s fair to say that companies that invest heavily in growing their earnings tend to be rewarded with greater share price appreciation than those with few growth options, and who instead choose to pay out a greater proportion of earnings as dividends.
The other thing to note here is that the seemingly best dividend yields, i.e., from VAU, WAF, GGP are associated with stocks that are yet to even pay a dividend. We’re relying on the consensus estimates here, and perhaps greater value should be placed on the dividend yields of stocks that have a strong track record of dividend payments (e.g., like DRR, NIC, FMG, EVN, and RIO).
Conclusion
For each financial metric: P/E Ratio, FCF Yield, and Dividend Yield, I’ve proposed standouts segment by segment. Let’s now try to pull each of these threads together to come up with an overall “honourable mention” list. Which ASX mining stocks are arguably the cheapest right now?
I suspect you and I may differ somewhat as, let’s face it, beauty is in the eye of the beholder… But can I propose a 1, 2, 3 of: WAF, VAU, SMR. Let the debate begin! (...and hey, these are all fundamentals = no mention here of their charts… so perhaps another installment is in order! 📈)
This article first appeared on Market Index on Thursday 28 August 2025.
Never miss an update
Enjoy this wire? Hit the ‘like’ button to let us know.
Stay up to date with my current content by
following me below and you’ll be notified every time I post a wire
Carl has over 30-years investing experience and has helped investors navigate several bull and bear markets over this time. He is a well respected markets commentator who specialises in how the global macro impacts Australian and US equities. Carl has a passion for technical analysis and has taught his unique brand of price-action trend following to thousands of Aussie investors.
........
Investing is risky. Inevitably you will endure losses. If you can't cope with losing, don't invest.

5 topics
19 stocks mentioned

Carl has over 30-years investing experience and has helped investors navigate several bull and bear markets over this time. He is a well respected markets commentator who specialises in how the global macro impacts Australian and US equities. Carl...
Carl has over 30-years investing experience and has helped investors navigate several bull and bear markets over this time. He is a well respected markets commentator who specialises in how the global macro impacts Australian and US equities. Carl...
Comments
Comments
Sign In or Join Free to comment