Chart of the day: So much ominous data
“If investing is entertaining, if you’re having fun, you’re probably not making any money. Good investing is boring.” George Soros
The past couple of days have delivered nothing less than an ominous set of economic data. Some of the data represents an appetiser to the Q2 recessionary main course and some of the data a virtual taste test of what lies ahead. Both Europe and the US served up their worse-than-expected Q1 growth data, though still only capturing the initial stages of the pandemic-induced lockdowns.
For the US, Q1 growth fell a larger-than-expected 4.8% (annualised), its largest drop since the GFC, reflecting weakness across consumers, capex and exports. UBS expects an even more confronting record 32% fall for the current Q2 quarter, with this week’s unemployment claims seeing a further 3.8 million folk claiming unemployment (worse than consensus but below last week’s 4.4 million). This is consistent with an almost unfathomable 10-15 million loss of jobs in next week’s payrolls report (previous worst was -2 million in the 1940s!). For Europe, Q1 growth last night was down 3.8%, its worst on record…that’s -16% annualised to compare it with the US. With Europe entering lockdown earlier, there are no surprises that consumers led the collapse in growth. UBS forecasts a further 5% fall for Europe in Q2.
But the awful data this week has also been surrounded by ‘news’ that’s more encouraging. Maybe this is the alcohol or the dessert course, but it’s hard to embrace or continue the analogy going given we—and most of the developed world— remains unable to enjoy a meal served at a restaurant. Nonetheless, central banks made positive tones, with the US Federal Reserve yesterday saying it would expand its lending program while calling for more fiscal support, and the European Central Bank sweeting the terms of its bank lending facility and hinting it would increase its asset purchase plan next month. Elsewhere, key US tech companies have so far beat Q1 earnings expectations, while Gilead’s pandemic drug, Remdesivir, delivered positive clinical results. As we expected, the approach of 1 May oil output cuts has seen oil prices jump 25% overnight after rising 22% in the prior session (big numbers off a low base) and China’s April manufacturing PMI eased from 52.0 to 50.8, much as expected, but pleasingly holding on to its post lockdown bounce.
Not surprisingly, global bond yields have remained extremely low. In contrast, equities have held on to their significant April gains, with index gains of over 12% in the US, 10% in Europe and 8% in Australia. So, what’s the chart of the day? Remember geo-politics, the issue of 2019? Well, today’s chart seeks to remind us that, while it has so far all been about viruses and oil in 2020, there are still other things that can arrive on the scene unexpectedly. North Korea’s leader, Kim Jong Un hasn’t been seen since 12 April and there are worrying reports about his health. As BCA notes, “North Korea is economically insignificant, [but] it is not irrelevant because US-China relations are no longer stable.” According to BCA, “a dispute over North Korea could trigger a relapse in US-China relations that threatens the global equity rebound”. With Trump dropping in the polls, who knows what ‘geo-politically’ lies ahead?
Korea – geopolitical risk indicator
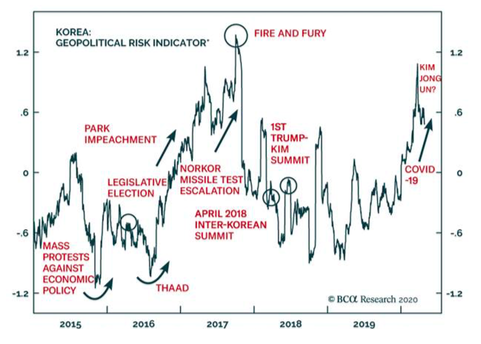
Source: BCA calculations. Based on USD/KRW, USE/TWD and Korean exports.
Be the first to know
I’ll be sharing Crestone Wealth Management's views as new developments unfold. Click the ‘FOLLOW’ button below to be the first to hear from us
Never miss an update
Enjoy this wire? Hit the ‘like’ button to let us know.
Stay up to date with my current content by
following me below and you’ll be notified every time I post a wire
Scott has more than 20 years’ experience in global financial markets and investment banking, providing extensive economics research and investment strategy across equity and fixed income markets.
........
General advice notice: Unless otherwise indicated, any financial product advice in this email is general advice and does not take into account your objectives, financial situation or needs. You should consider the appropriateness of the advice in light of these matters, and read the Product Disclosure Statement for each financial product to which the advice relates, before taking any action. © Crestone Wealth Management Limited ABN 50 005 311 937 AFS Licence No. 231127. This email (including attachments) is for the named person’s use only and may contain information which is confidential, proprietary or subject to legal or other professional privilege. If you have received this email in error, confidentiality and privilege are not waived and you must not use, disclose, distribute, print or copy any of the information in it. Please immediately delete this email (including attachments) and all copies from your system and notify the sender. We may intercept and monitor all email communications through our networks, where legally permitted

1 contributor mentioned

Scott has more than 20 years’ experience in global financial markets and investment banking, providing extensive economics research and investment strategy across equity and fixed income markets.
Expertise
Scott has more than 20 years’ experience in global financial markets and investment banking, providing extensive economics research and investment strategy across equity and fixed income markets.
Expertise
Comments
Comments
Sign In or Join Free to comment