Explaining the April US equity bounce

Key points
- US unemployment is heading for levels not seen since the Great Depression.
- Despite the current dire economic outlook, US equity indices are back to October 2019 levels after a sharp recovery in April.
- Ultimately, share prices are driven by corporate profits; and corporate profits are driven by, among other things, government deficits.
- The massive fiscal response by the US government ($2.7 trillion at the time of writing) will flow directly into the non-government savings pool, which includes companies.
- This does not mean the massive fiscal response ensures ongoing equity performance – but it may go some way to explaining investors’ willingness to buy risk assets in the teeth of what appears to be a certain economic collapse.
The April bounce
The near-global government response to the coronavirus has been to effectively shut down economies and enforce social distancing. In addition, most governments have passed or enacted significant financial support for households and businesses, in an attempt to hold the economy in place until it can once again safely re-open.
It is therefore concerning that despite the scale and speed of the response, unemployment is increasing significantly in the major economies. In the US, the most live data on the state of the economy are initial jobless claims – which at the time of writing have accrued to a cumulative 30 million lost jobs since March.
Based on the size of the US workforce (approximately 155 million), these losses amount to 19% of the workforce. Along with the initial 3.5% jobless rate in February, it is not unreasonable to conclude the current unemployment rate in the US is now above 20%[1], with a real chance it will continue to trend higher.
So, what is the response from the US equity market during the worst labour market in almost 100 years? Positive +13% in April, and positive +30% from the March lows.
Some of this recovery can be explained by the severity of the March sell off. However, the S&P 500 is currently at the same level as it was in October 2019.
The composition of the index can also help explain. Technology companies now dominate the US and global indices. Indeed, Amazon is now one of the largest components of these indices. And if there was ever a scenario that supports the Amazon business model, it’s for the government to line the pockets of consumers with fiscal stimulus, force them to stay at home, and simultaneously shut down 95% of Amazon’s competitors. There is no wonder the stock is near an all-time high!
However, in the face of a near-Depression economic scenario, even Amazon – a business based on consumer spending – will have serious headwinds. So, is there another explanation for equity market resilience?
The Kalecki-Levy profit equation
In summary, the profit equation recognises that all financial savings and spending offset each other, and real savings are represented by net investment. So company savings are really just national savings (investments) less savings from other sectors of the economy. More formally:
Business savings = national investment (I) - household savings - foreign savings - government savings
And since business profits equal business savings plus dividends paid:
Company profits = government deficits – household savings – foreign savings + dividends
Below is the historic breakdown of this equation relative to the US economy (GNP = gross national product).
US corporate profits / GNP; 1990-2018
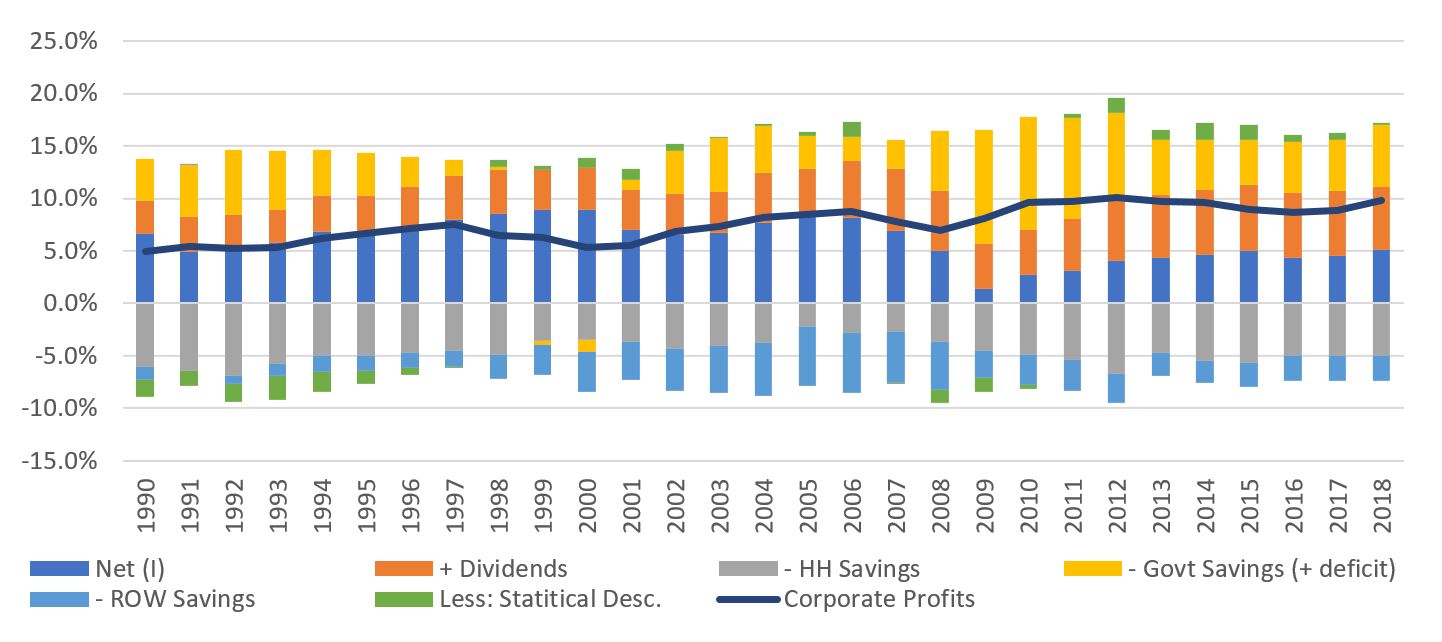
Source: BEA, Quay Global Investor
The following chart highlights the components of profit in nominal (dollar terms).
US corporate profits (US$bn); 1990-2018
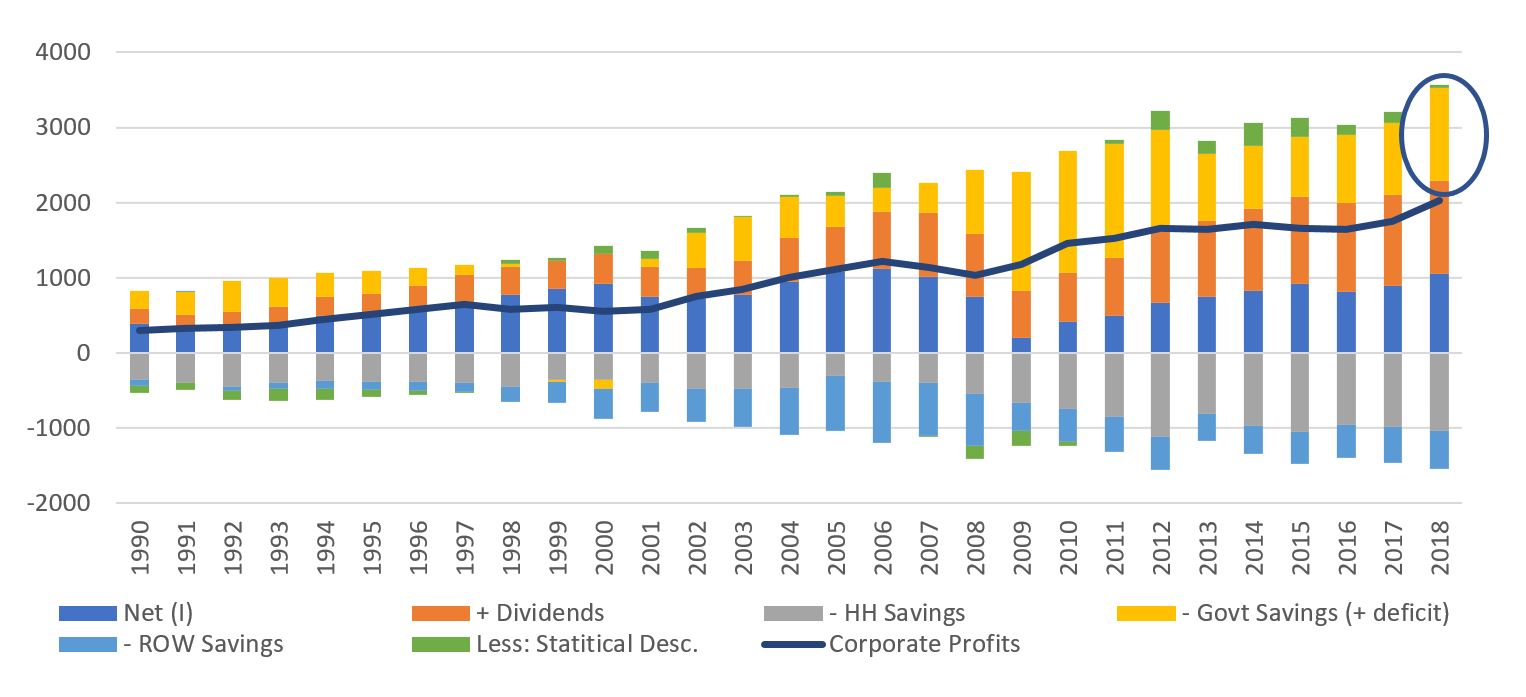
Source: BEA, Quay Global Investor
At some stage US company profits may boom
The insight from the Kalecki-Levi profit equation is that government deficits are a source of private sector profits. And in response to the government-induced economic shutdown, US spending via the CARES act added +$2.2 trillion to the deficit. Additional legislation has since added a further $0.5 trillion. In the context of the profits equation chart above, this is very significant (imagine the yellow column in the chart above and circled tripling!).
Of course, the net financial assets generated by deficit spending will not all accrue to the business sector. Potential offsets include:
- a sharply higher level of household savings as consumers try to build / rebuild a financial buffer
- a fall in expected dividends paid as businesses prioritise liquidity
- a fall in business investment due to a collapse in aggregate demand, and
- a fall in foreign savings (current account deficit) as external trade declines.
Having said that, $2.7 trillion is a big number and will go a long way. There is more than enough to go around, and we suspect US equity investors are willing to look through the near-term uncertainty and see a decent profit recovery in 2021/2022, supported by today’s deficit spending.
The same accounting realities between deficit size and company profits hold equally true in Australia, UK, Germany, etc.
A word of caution
Of course, profits are only one element of equity valuation. The price investors are willing to pay for those profits are equally important. Today, based on the Case-Shiller Cyclically Adjusted PE ratio (CAPE), stocks are not cheap (see chart below).
CAPE is defined as the ratio of price divided by the average of ten years of earnings (moving average), adjusted for inflation. It is used to gauge whether a stock or index is undervalued or overvalued by comparing its current market price to its inflation adjusted historical earnings record. Using average earnings over the past decade helps to smooth out the impact of business cycles and other events, and gives a better picture of sustainable earning power.
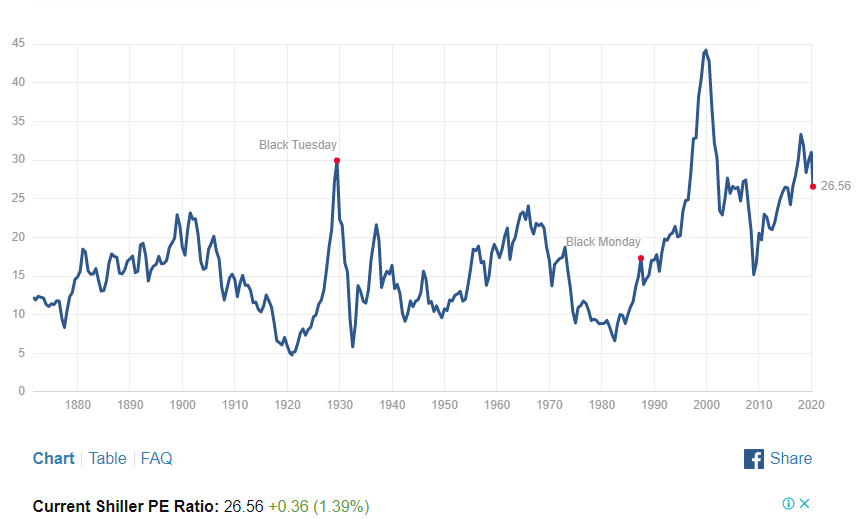
Source: Multpl.com, Quay Global Investors
Further, the Kalecki profit equation is not always a good forecasting tool. As described above, there are several offsets / leakages that will diminish the positive profit impact of net government spending. And many of these are very difficult to predict.
However, investors should not ignore the global fiscal response to the current crisis. This massive net spending will help repair household balance sheets and provide a financial bridge for the economy as near-term investment collapses. There is also a very good chance, based on the laws of accounting, that much of the net spending will show up in the form of corporate profits – even in the face of near-Depression levels of unemployment.
[1] It should be noted the official unemployment rate could vary significantly from this number. According to the BLS “a person is defined as unemployed if they do not have a job and have actively looked for work in the past four weeks, and currently are available for work”. Given people are discouraged from “actively seeking” work or “currently available for work”, the official unemployment could exclude a large proportion of the economy, and accordingly, the unemployment rate could be understated.
Never miss an update
Enjoy this wire? Hit the ‘like’ button to let us know.
Stay up to date with my current content by
following me below and you’ll be notified every time I post a wire
Chris has nearly 30 years of experience working as a real estate specialist, with a background in investment banking and equities research. Prior to co-founding Quay, he worked in real estate investment banking at Credit Suisse and Deutsche Bank.


Chris has nearly 30 years of experience working as a real estate specialist, with a background in investment banking and equities research. Prior to co-founding Quay, he worked in real estate investment banking at Credit Suisse and Deutsche Bank.
Chris has nearly 30 years of experience working as a real estate specialist, with a background in investment banking and equities research. Prior to co-founding Quay, he worked in real estate investment banking at Credit Suisse and Deutsche Bank.
Comments
Comments
Sign In or Join Free to comment