How COVID-19 has changed our outlook

Chris Rands
Yarra Capital Management
At the beginning of this year when we wrote our outlook for 2020, we were more positive than most on the idea that the housing cycle was moving into full swing, which we believed would slow the Reserve Bank of Australia (RBA). While our view on housing looks like it is still on the mark, the coronavirus completely undermined our thinking on the RBA, as central banks around the world are now aggressively cutting rates.
A detour on houses
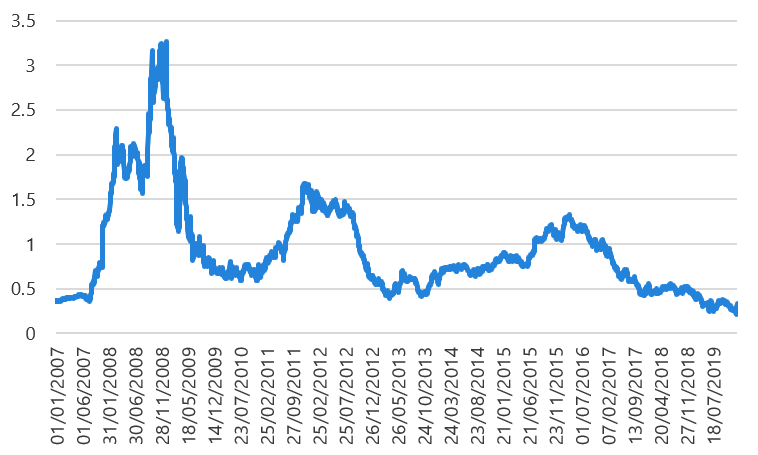
Our view at the start of the year was that the rate cuts the RBA made through 2019 would be very supportive for the housing sector. This has been forthcoming, with house prices now up 7% over the year (Sydney houses up 13%) and set to reach new all-time highs. Given the fact that rate cuts over the past 10 years have consistently pushed prices higher (refer to Chart 1), we expect to see new highs for property in the coming months as the RBA adds more support via lower rates. We believe this should eventually help improve housing-sensitive sectors.
Looking forward, if the coronavirus doesn’t end up as severe as the current market forecasts, we believe the housing and inflation stories we shared in January are still in play. While this could offer some upside to the economy in the second half of the year, the backdrop of our original outlook has changed.
Chart 1 - Australian house prices
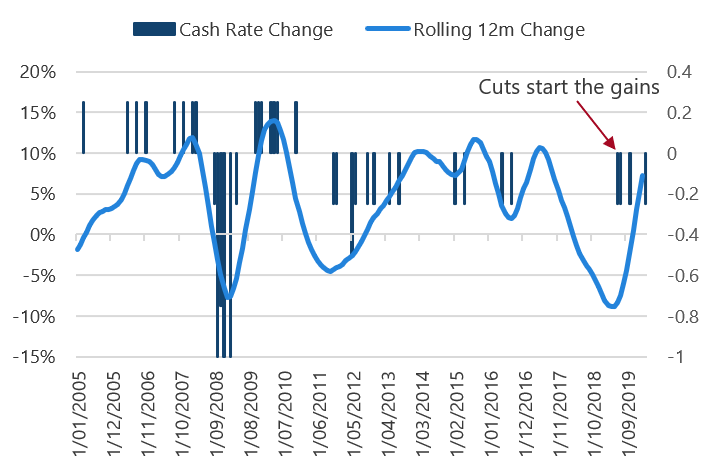
Source: Bloomberg, Nikko AM
Chart 2 - Australian house price index
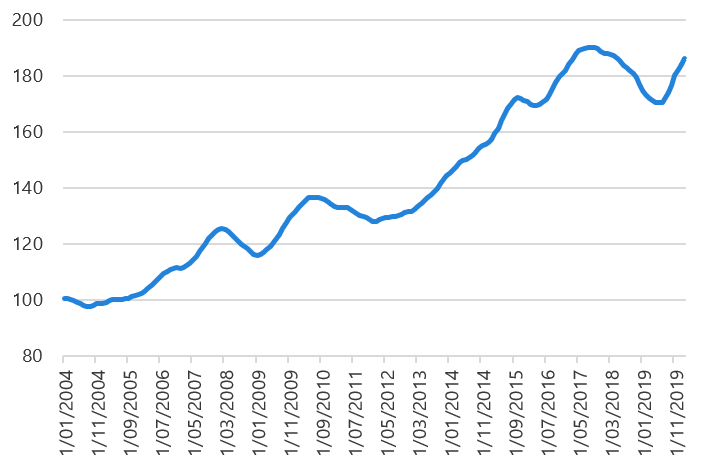
Source: Bloomberg, Nikko AM
The problem with this view (currently) is that the market has become far more concerned with the spread of the coronavirus. As this spreads to new countries, the greater affect it could have on the global economy. By mid-February, the market had been receiving some comfort that the daily new cases were beginning to plateau, as shown in Chart 3.
Chart 3 - Daily new cases
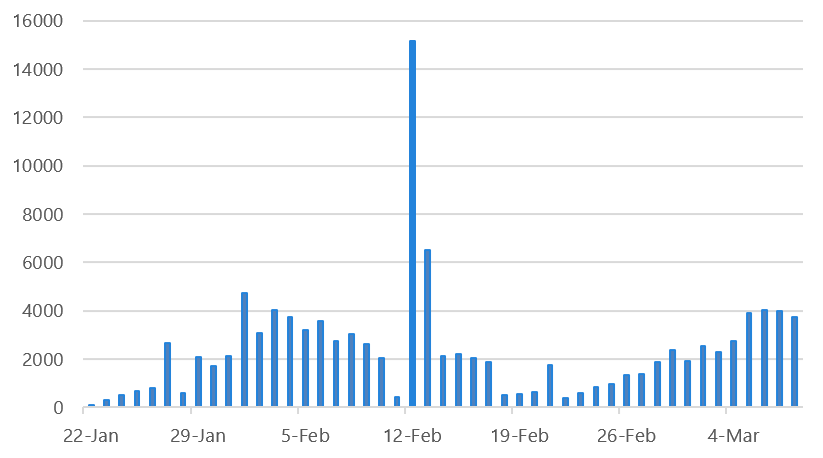
Source: John Hopkins University
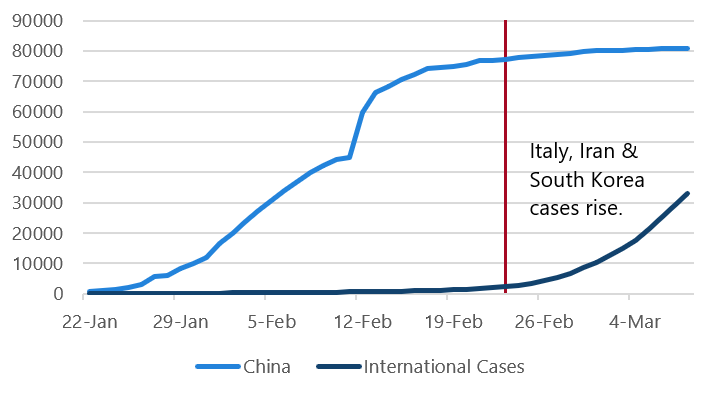
However, the situation outside of China quickly destroyed this narrative. The key driver of the turn in equity markets looks like it was the disease spreading into South Korea, Italy, and Iran, which hit sentiment hard. Chart 4 shows the coronavirus situation outside of China, which the market economists have now become fearful of. If this disease continues to spread, just how disruptive will it be to the global economy?
Chart 4 - Total cases outside of China
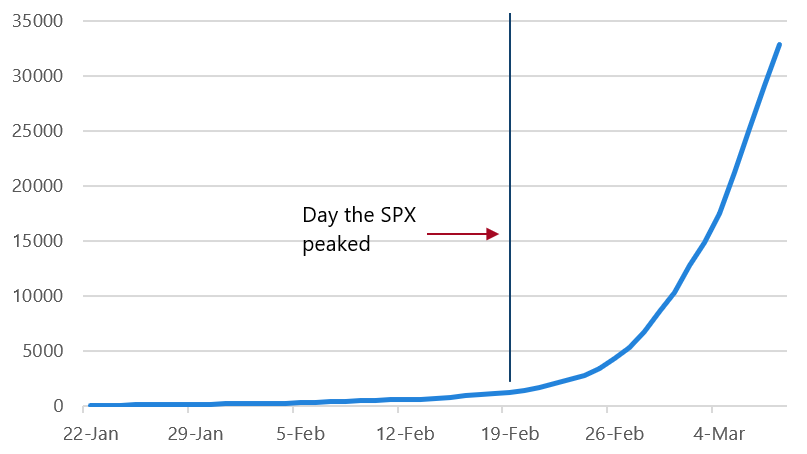
Source: Worldometer: (VIEW LINK)
Table 1 - Coronavirus COVID-19 global cases by John Hopkins CSSE
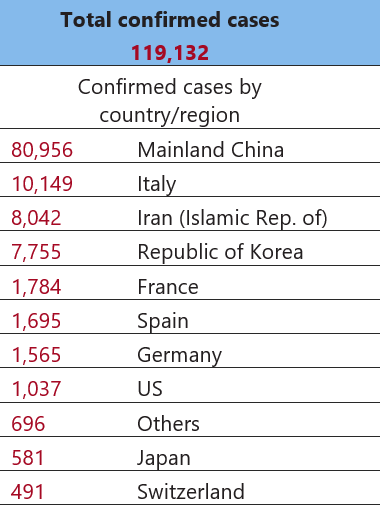
Source: John Hopkins CSSE as at 11 March 2020. Only top 10 countries shown
On the back of this, we cut our short duration position on Friday, 21 February (refer to Chart 5). With the benefit of hindsight, this was the day before the equity market meltdown. The rationale for our decision was that the probability of the better scenario (i.e. Australia is strong) was falling considerably as the coronavirus spread to other countries. We believed that the flow of information was starting to show that it was becoming more likely that the situation is going to get worse before it gets better.
Chart 5 - Active duration and yields
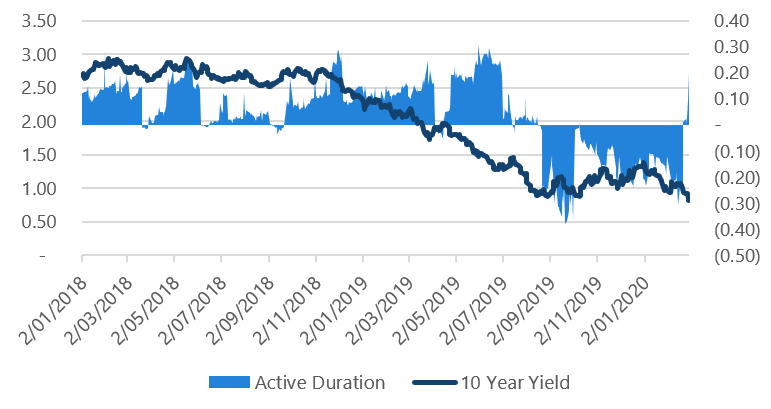
Source: Bloomberg, Nikko AM
What do we think now?
This is a bit harder to call from here, because we really have no idea just how disruptive the coronavirus will be and how far it could spread. From a positioning perspective, the short answer is: we will likely remain relatively square duration as long as the headline risk of the disease persists.
If we think about this disease, there are all sorts of ‘interesting’ forecasts being thrown out there around how bad it could be. From here, we need to consider just how much stock to put in that information in order to determine how much it could affect the economy.
For example, the Australian Financial Review (AFR) picked some forecasts from economist Professor Warwick McKibbin (former RBA board member), sharing his ‘worse case’ pandemic scenario:
“If the virus reaches a global pandemic, as looks almost certain, between 15 million and 68 million people around the world will die, the modelling suggests. A global pandemic would result in between 21,000 and 96,000 Australians facing death. (In comparison in Australia, influenza on average causes 3,500 deaths, about 18,000 hospitalisations and 300,000 GP consultations each year.) More than 12 million people could die in China under the worst case scenario.”
—AFR, 3 March 2020
Between 15 - 68 million deaths globally (with 12 million in China)! That’s a startling number. But is this going to turn out to be just a startling number or an unlikely number? If we look at the current rate of transmission and deaths, focusing specifically on China, we get the following charts:
Chart 6 - Coronavirus cases
Source: John Hopkins University, as at 10 March 2020
Chart 7 - Coronavirus deaths
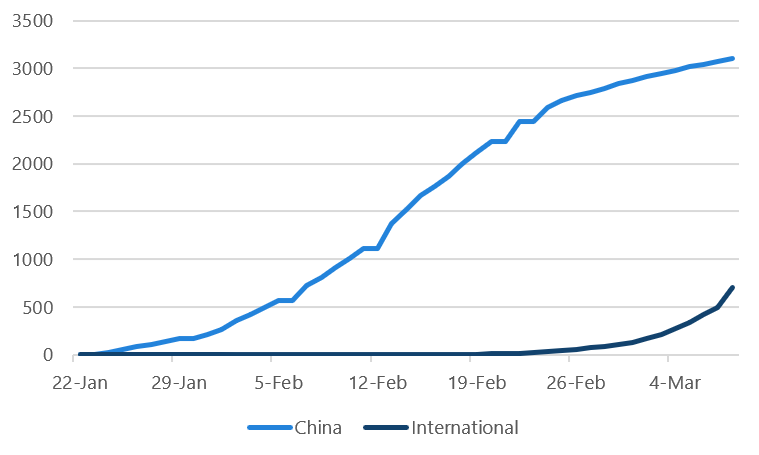
Source: John Hopkins University, as at 10 March 2020
Positively, China seems to be levelling off at about 80,000 cases and 3,000 deaths after an extremely quick ramp up over February. With a population of 1.4 billion, compared to the global population of 7.8 billion, China represents ~17% of the global population. At 3,000 deaths, it doesn’t yet seem likely that the total deaths will approach anywhere near the proposed 15 – 68 million, as there are some signs that the containment in China is working. (Note: the maths behind contagions is parabolic, which means the figures can get out of control quickly).
So, while this could end up being a tragic pandemic, the hype in the press and social media is leaning more towards being alarmist than realist, and we are going to have to see far greater infection spread to get close to those proposed numbers. This was raised by Warrick McKibben when he told the media that they had reported only his worst case scenario, meaning we need to read the constant flow of new data with a critical eye.
Looking more closely at prospective timing for new international cases, in China the first case was confirmed in late December 2019. By the end of February (more than two months later), the virus had lost a lot of its momentum. If (and this is a big if) the world follows a similar timeline, it is likely we will see outbreak headlines popping up around the world for the next three months, as new countries are exposed to the virus and watch it spread through the population before it slows. From a risk-on/-off perspective, it does look like the next few months will see continued negative headlines related to its transmission and this will potentially lead to more equity market volatility.
What is the RBA thinking?
Moving this idea to the RBA, it is very clearly concerned about what effects the virus will have on the equity market. No central bank wants to tie themselves directly to the equity market, but it appears the RBA has shown its hand by acting so aggressively following the recent falls. Let’s not forget what the RBA was saying about low rates and the coronavirus before the equity market fell.
“The Board also recognised that the incremental benefits of further interest rate reductions needed to be weighed against the risks associated with very low interest rates. Internationally, concerns had been raised about the effect of very low interest rates on resource allocation in the economy and their effect on the confidence of some people in the community, notably those reliant on savings to finance their consumption. A further reduction in interest rates could also encourage additional borrowing at a time when there was already a strong upswing in the housing market.”
— Reserve Bank of Australia, February 2020 Minutes
Effectively, the RBA was saying we need to be careful about the effects that low rates can have on our economy. From Chart 8, you can see that the market was reading this as the RBA is going to be a reluctant cutter. That was true, until the equity market fell.
Chart 8 - March cash rate expectations and equity prices
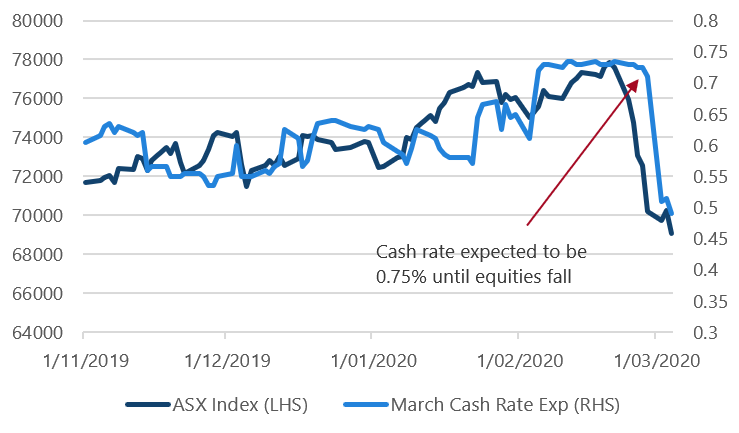
Source: Bloomberg
In its most recent statement, the RBA made no comment about the trade-off but did say:
“The coronavirus outbreak overseas is having a significant effect on the Australian economy at present, particularly in the education and travel sectors.”
Perhaps it is more appropriate to say: The coronavirus outbreak overseas is having a significant effect on the equity market.
Until the coronavirus hit the equity market, the RBA was trying to look through it. That idea is now dead. There is growing research that backs up this idea that central banks take their lead from the equity market — with an academic paper making the following claim for the Fed:
The economics of the Fed Put (Cieslak and Vissing-Jorgensen – 2018)
“Negative stock returns realized between FOMC meetings are a more powerful predictor of subsequent federal funds target rate changes than almost all macroeconomic news releases.”
Stock market returns forecast the Fed — check. They then go on to say:
“About 80% of the Fed’s reaction to the stock market can be explained by the Fed revising its expectations of economic activity down following stock market declines.”
Revising forecasts down — check. Here is what the RBA said a month ago versus 3 March 2020:
February: “The central scenario is for the Australian economy to grow by around 2¾ per cent this year and 3 per cent next year, which would be a step up from the growth rates over the past two years.”
March: “The coronavirus has clouded the near-term outlook for the global economy and means that global growth in the first half of 2020 will be lower than earlier expected.”
The equity market decline looks like it altered the RBA’s outlook, causing them to reassess just how disruptive this virus will be. It’s unfortunate they reacted to the equity market in the way they did, as it does seem to encourage excessive risk taking.
The takeaway for us is that as long as the above headline risk of further coronavirus spread remains (it took two months to play out in China), then the equity market is probably going to be jittery and this will keep the RBA live for further rate cuts and potentially QE. Additionally, as the economic data has broadly been weaker than expected, this has meant that when we saw evidence of the virus spreading globally, we had to push our forecasts lower.
If the virus doesn’t turn out to be as bad as feared, it could setup a very strong second half of this year as we are going to see coordinated central bank easing with fiscal policy to come. But we can only wait and see what the impact of the virus will be.
What did we do with credit?
On Monday, 24 February, we observed another volatility reading from our event risk indicator, which is a warning signal for risk-off environments ahead. Over the week, the indicator deteriorated as equities saw some of their worst performance since the GFC. Additionally, we are now seeing a grouping of the risk indicators, which is a good signal that volatility is starting to rise.
Chart 9 - Event risk indicator
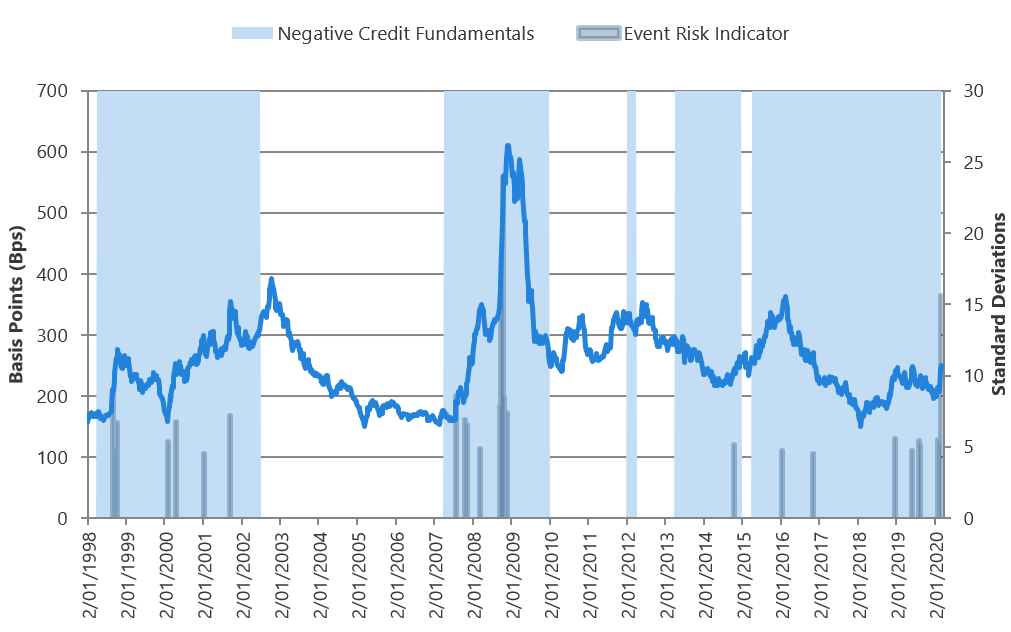
Source: Bloomberg, Nikko AM
This raises the question of what did we do with our credit positions? We sold down a small portion of 3–5 year credit and bought longer dated government bonds. But why so small? In August 2019, we made the decision that credit spreads were starting to get too expensive and so wound back our exposure. This led to a halving of our credit duration and taking out almost all exposure — which was longer than three years — meaning we already hold a relatively defensive credit position.
Chart 10 - Active credit duration
Source: Nikko AM
You can see this reflected in Chart 11. We have almost no active credit position longer than three years (a small overweight in 3–5 is offset by the short in the longer maturities). In addition, a large percentage of our active credit holdings is in RMBS/ABS. This is almost all AAA rated, with good subordination. Given the way the housing market is running, in our view, this makes it a safer option than lower-rated corporate credit.
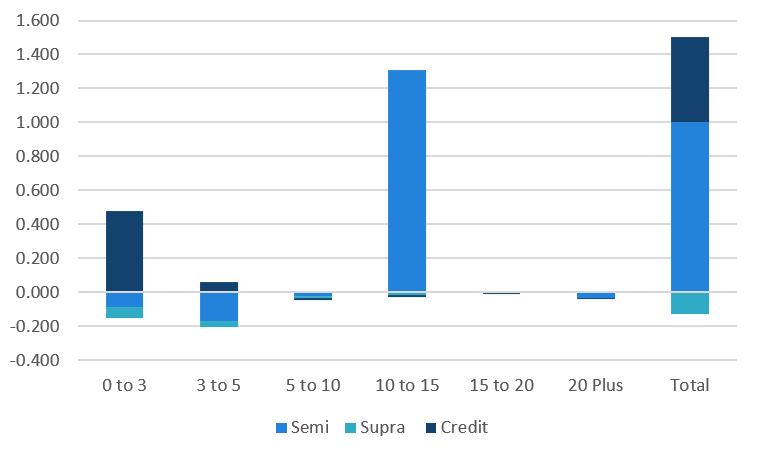
Chart 11 - Active credit position
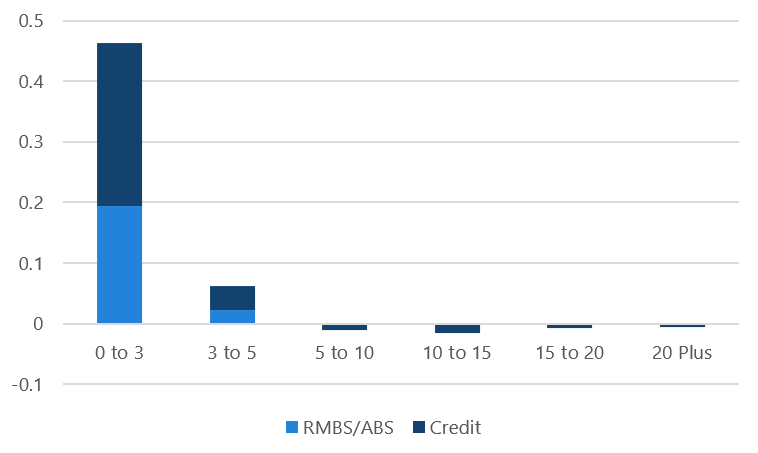
Source: Nikko AM
Our response when the risk indicator went off was to slightly reduce our exposure to credit and increase our exposure to government. While we are not averse to using credit, the economic conditions and spread level need to backup that view.
Where do we have positions?
Given the RBA is inching closer to the 0.25% level, which they think of as their lower bound (we will find out how true that is in due course), it stands to reason that the market is going to start thinking more about QE. The RBA has spoken a few times in the past about what this will look like, which you can read about in their comments in the links below:
Towards the end of the speech, you can get a sense of what type of policy they would use.
“My third observation is that we have no appetite to undertake outright purchases of private sector assets as part of a QE program.
There are two reasons for this. The first is that there is no sign of dysfunction in our capital markets that would warrant the Reserve Bank stepping in. The second is that the purchase of private assets by the central bank, financed through money creation, represents a significant intervention by a public sector entity into private markets. It comes with a whole range of complicated governance issues and would insert the Reserve Bank very directly into decisions about resource allocation in the economy. While there are some scenarios where such intervention might be considered, those scenarios are not on our radar screen.
My fourth point is that if — and it is important to emphasise the word if — the Reserve Bank were to undertake a program of quantitative easing, we would purchase government bonds, and we would do so in the secondary market. An important advantage in buying government bonds over other assets is that the risk-free interest rate affects all asset prices and interest rates in the economy. So it gets into all the corners of the financial system, unlike interventions in just one specific private asset market.”
From this we can broadly say that it would be unlikely that an Australian QE program would buy credit (the private assets listed above), unless the market becomes highly dysfunctional and firms cannot raise finance on their own. Instead, we believe they would buy government bonds, which could also include semi-governments.
This brings us to one of our key over weights: long-dated semi-government bonds. Chart 12 shows our positioning. As we enter a world of low rates and QE, we think that this looks like a safer way to look for yield than just taking credit.
Chart 12 - Active sector duration
Source: Nikko AM
Interestingly, of all the sectors at the moment, the 10–15 semis is the only sector that offers above average levels of spread compared to its historical average. This can be seen below where the sector typically offers between 20 and 120 points over government bonds. The current spread of 60 points, while not super attractive, is not too bad considering the RBA could soon be conducting QE.
Chart 13 - 10–15 year semi spread
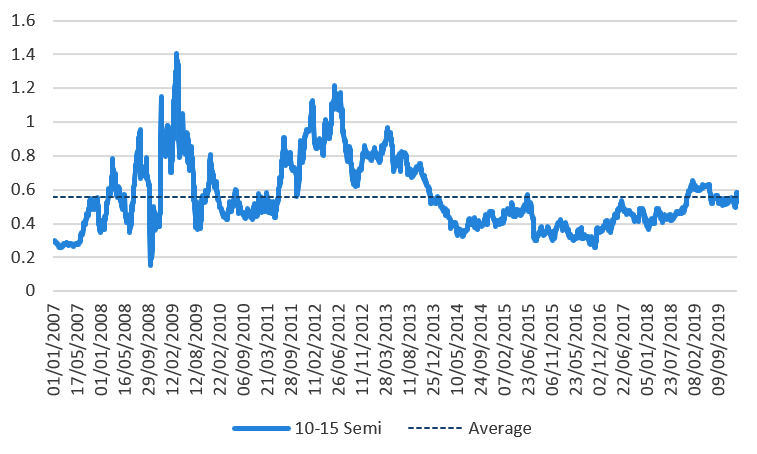
Source: Bloomberg, Nikko AM
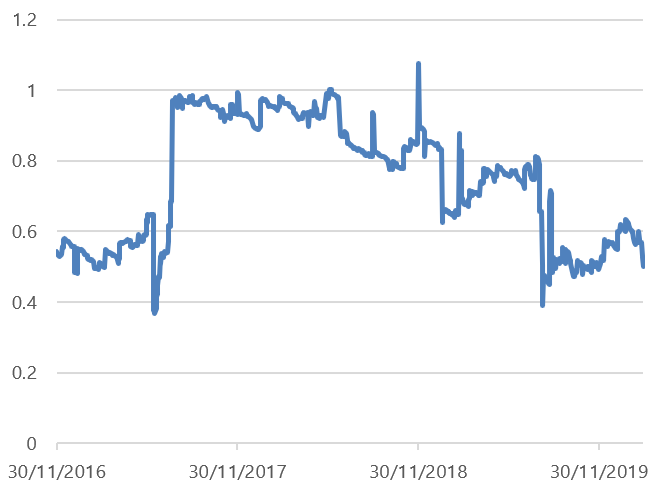
When we compare this sector to 3–5 year credit (the sector we had been selling down), we can see why long-dated semis start to look attractive. Chart 14 shows the 3–5 year credit against its recent history. This sector is at its tightest level since the GFC, despite the RBA cutting and the market thinking we are in a weak economic environment.
Chart 14 - 3–5 year credit spread
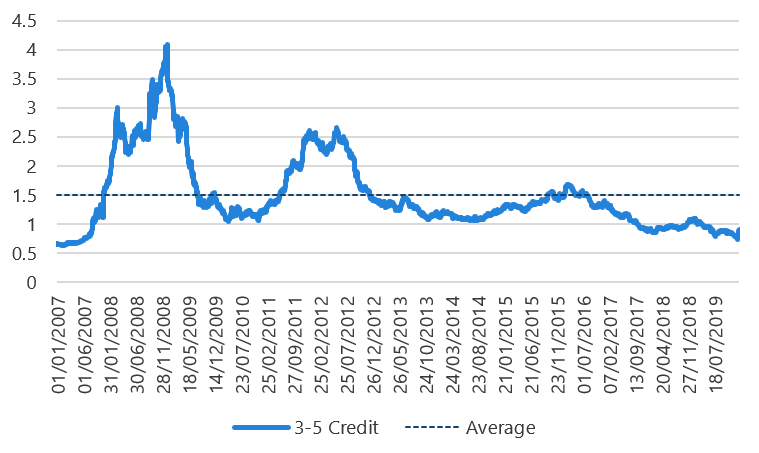
Source: Bloomberg, Nikko AM
If we look at the difference of 3–5 credit spread versus 10–15 semi spread, short credit is at its most expensive relative to long-dated semis in the past 10 years. Chart 15 shows the outright spread level of each sector, while the excess pickup from credit is in Chart 16.
Chart 15 - Semi and credit spreads
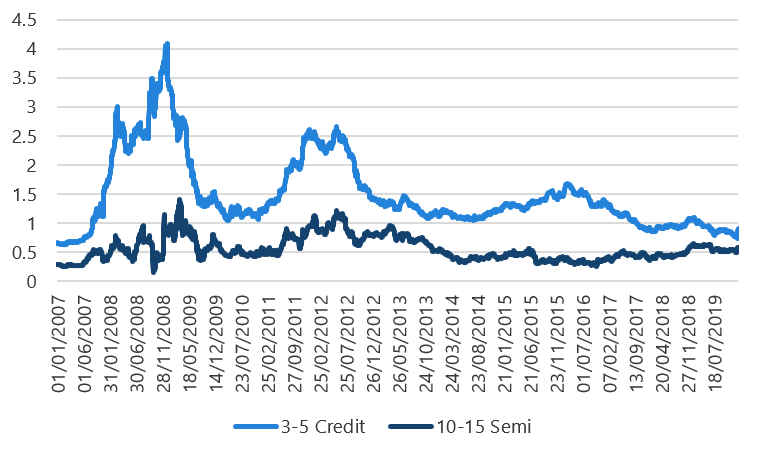
Source: Bloomberg, Nikko AM
Chart 16 - 3–5 credit minus 10–15 semi spread
Source: Bloomberg, Nikko AM
Charts 15 and 16 show why we currently favour the semis. Chart 16 shows we are giving up about 30 points of spread by favouring long-dated semis over mid-curve credit. At the same time, Chart 15 shows that if there is a risk-off environment, where spreads widen, then credit can easily go 100 – 250 points (to say 200 over government), while semis should struggle around 50 points (at around 100 over government). Even from a relative value perspective, the semis look like good value versus credit, which makes them attractive even before we factor in potential QE into the equation.
At the moment, this positioning has been underperforming, as typically when rates rally the semis lag. But as rates begin to stabilise we would expect this to find support, delivering a decent level of spread while also looking like a safer way to add yield.
Stay one step ahead of the crowd
Our investment philosophy is based on identifying pricing anomalies. Inherent in this philosophy is the belief that markets are often incorrect in forecasting short-and medium-term influences and conditions. Keep up to date on where we believe the market has got it wrong by hitting the 'follow' button below.
Never miss an update
Enjoy this wire? Hit the ‘like’ button to let us know.
Stay up to date with my current content by
following me below and you’ll be notified every time I post a wire
Chris is responsible for portfolio management, including portfolio construction and trading for various Australian fixed income portfolios including the Nikko AM Australian Bond Fund at Yarra Capital Management (Nikko AM was acquired by Yarra Capital Management in April 2021). Chris has over 9 years of experience in the fixed income market. He is also co-host of the popular Australian podcast series The Rate Debate.
Featuring

Chris Rands,
Yarra Capital Management
Chris is responsible for portfolio management, including portfolio construction and trading for various Australian fixed income portfolios including the Nikko AM Australian Bond Fund at Yarra Capital Management (Nikko AM was acquired by Yarra Capital Management in April 2021). Chris has over 9 years of experience in the fixed income market. He is also co-host of the popular Australian podcast series The Rate Debate.

2 topics
Chris Rands
Co-Portfolio Manager, Fixed Income
Yarra Capital Management
Chris is responsible for portfolio management, including portfolio construction and trading for various Australian fixed income portfolios including the Nikko AM Australian Bond Fund at Yarra Capital Management (Nikko AM was acquired by Yarra...
Expertise
Comments
Comments
Sign In or Join Free to comment