How long will the Fed funds rate stay at 0%?
“It is wise to take admissions of uncertainty seriously…but declarations of high confidence mainly tell you that an individual has constructed a coherent story in his mind, not necessarily that the story is true.” Philip Tetlock, Superforecasting
The US Federal Reserve’s (Fed) keenly awaited meeting decision overnight was arguably on the hawkish side of expectations. In large, it did not add to its current policy stimulus. It did not, as some forecasters had hoped, announce ‘yield curve control’ or move to open-ended quantitative easing. Bond purchases were unchanged and long-term bond yields rose several points post the Fed’s announcement. Indeed, the text of the Fed’s decision was largely unchanged, still suggesting funds rate would be at zero "until it is confident that the economy has weathered recent events and is on track to achieve" its goals. Last week’s ‘less worse’ than expected US payrolls may have reduced the Fed’s need to respond.
However, saving the bond markets’ day was the Fed members’ so-called ‘dot-plot’. They say there is ‘simplicity in art’ and, as shown in our chart today, there is definitely simplicity, and a dose of clarity, in the forecasts of the US Fed members. As the chart shows, US policy is forecast to be zero until at least the end of 2022, and virtually unanimously. Should we take comfort in forecast unanimity? The bond market did—eventually rallying 10bps through the day, flattening the curve.
And then there is the ‘contrast’ (also sought in great art). Long-run Fed funds rates at 2.5%. The question is, how do we get from years of zero rates to a long run of 2.5% where bond yields rise toward 2% or more? Well, it’s hard to forecast one year out…probably one of 2020’s greatest revelations! Three years out is a crapshoot. But the Fed’s growth forecasts are still revealing. After a fall of 6.5% in 2020, growth is forecast to jump 5% in 2021 and another 3.5% in 2022. With most of the growth collapse behind us in real time, that’s 8-9% growth from here until the end of 2022.
Now, as UBS notes (somewhat dovishly), “even with that bounce back, the implied level of spending only returns to its pre-COVID-19 level well into 2022.” The question (somewhat less dovishly) is, pre-COVID-19 spending in early 2020 delivered a US 10-year of 1.9%. Moving between today’s yield of 0.8% and 1.9% is a one-year total return loss of over 10% under such a recovery scenario (versus a 2% return gain if the 10-year rallies further to 0.5%).
We would always argue for an exposure to bonds given the outlook is always more uncertain than consensus claims (and given the portfolio benefits of diversification). But that risk-reward skew suggests portfolios should be a little underweight bonds given the medium-term duration risk embodied in the Fed’s central forecasts. And with short-rates at zero until, let’s say at least end 2021 (that’s 18 months from here), this provides a powerful ‘relative’ argument to favour returns from equities and credit, albeit current index valuations suggest only a modest overweight (or even neutral) stance…and a more rigorous focus on both quality and valuations.
US Fed members’ dot plot for the funds rate
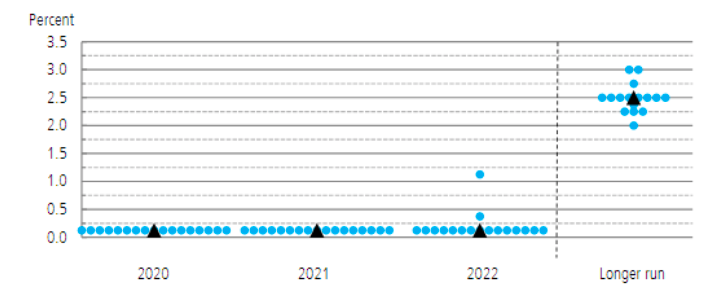
Source: US Federal Reserve Board, UBS.
Be the first to know
We share Crestone Wealth Management views on a range of macro topics that we're watching. Click the ‘FOLLOW’ button below to be the first to hear from us.
Never miss an update
Enjoy this wire? Hit the ‘like’ button to let us know.
Stay up to date with my current content by
following me below and you’ll be notified every time I post a wire
Scott has more than 20 years’ experience in global financial markets and investment banking, providing extensive economics research and investment strategy across equity and fixed income markets.
........
General advice notice: Unless otherwise indicated, any financial product advice in this email is general advice and does not take into account your objectives, financial situation or needs. You should consider the appropriateness of the advice in light of these matters, and read the Product Disclosure Statement for each financial product to which the advice relates, before taking any action. © Crestone Wealth Management Limited ABN 50 005 311 937 AFS Licence No. 231127. This email (including attachments) is for the named person’s use only and may contain information which is confidential, proprietary or subject to legal or other professional privilege. If you have received this email in error, confidentiality and privilege are not waived and you must not use, disclose, distribute, print or copy any of the information in it. Please immediately delete this email (including attachments) and all copies from your system and notify the sender. We may intercept and monitor all email communications through our networks, where legally permitted

1 contributor mentioned

Scott has more than 20 years’ experience in global financial markets and investment banking, providing extensive economics research and investment strategy across equity and fixed income markets.
Expertise
Scott has more than 20 years’ experience in global financial markets and investment banking, providing extensive economics research and investment strategy across equity and fixed income markets.
Expertise
Comments
Comments
Sign In or Join Free to comment