Maximising returns in a bond portfolio: Taking advantage of non-linearity is the key.

One of the key strategies employed within fixed income portfolios to add value is the maximisation of ‘carry and roll’. The successful utilisation of this strategy requires the exploitation of specific characteristics within the structure of the yield curve. Recognising what these are is central to getting the most out of your bond portfolio.
The term ‘carry and roll’ refers to the two types of return that an investor can earn from a bond as time passes. The ‘carry’ is simply the coupon/cash payments received on a bond over a particular time frame. The ‘carry’ can be viewed as being analogous to, and approximated by, the yield of the bond at the time of purchase. The ‘roll’ is the change in the capital value of the bond over time. It is the interaction of these two components which ultimately determines the total return earned on a bond over a holding period.
The initial issue for investors is that while ‘carry’ is largely a known number the ‘roll’ is not. As the ‘roll’ earned on a bond is unknown at the start of the period, it’s important to distinguish between expected ‘roll’ and actual ‘roll’. Expected ‘roll’ is calculated using the yield curve which is expected by the investor to prevail at the end of the holding period. In the absence of an explicit view regarding the future movements in the yield curve, it’s normally assumed that the bond simply rolls down the current yield curve; i.e. default is no change in the yield curve. Actual ‘roll’ is the change in capital value of the bond realised by the investor over the holding period and is calculated using the actual yield curve that exists at the end of the holding period.
Non linearity of the yield curve is the key
It may appear to many that the key to maximising returns is to simply invest in the highest yielding securities available. This approach is analogous to simply maximising the ‘carry’ on a portfolio. Unfortunately, investing in the highest yielding securities does not necessarily maximise the total return or ‘carry and roll’ on a portfolio. To illustrate this seemingly counterintuitive outcome the ‘carry and roll’ will be calculated using monthly observations from the Commonwealth government zero coupon curve estimated by the Reserve Bank of Australia (1).

The expected incremental ‘carry and roll’ per 0.25 year of additional term to maturity is calculated and shown in Figure 1. Given the volatility in the ‘carry and roll’ as the term to maturity is extended a polynomial line of best fit is applied to the series. As can be seen, the expected ‘carry and roll’ per additional 0.25 years of term to maturity is positive out to around 5 years and then declines to zero.
What is driving this difference in the expected ‘carry and roll’? The existence of different levels of ‘carry and roll’ arises due to the non-linearity of the yield curve not its slope per sae. The non-linearity of the yield curve impacts upon the ‘roll’ earned over a holding period and can often dominate the ‘carry’ component of total returns. This dynamic can be seen more clearly in Figure 2 which plots the average actual yield curve (Blue line) over the last decade against the implied linear yield curve based on the average aggregate slope (Orange line).
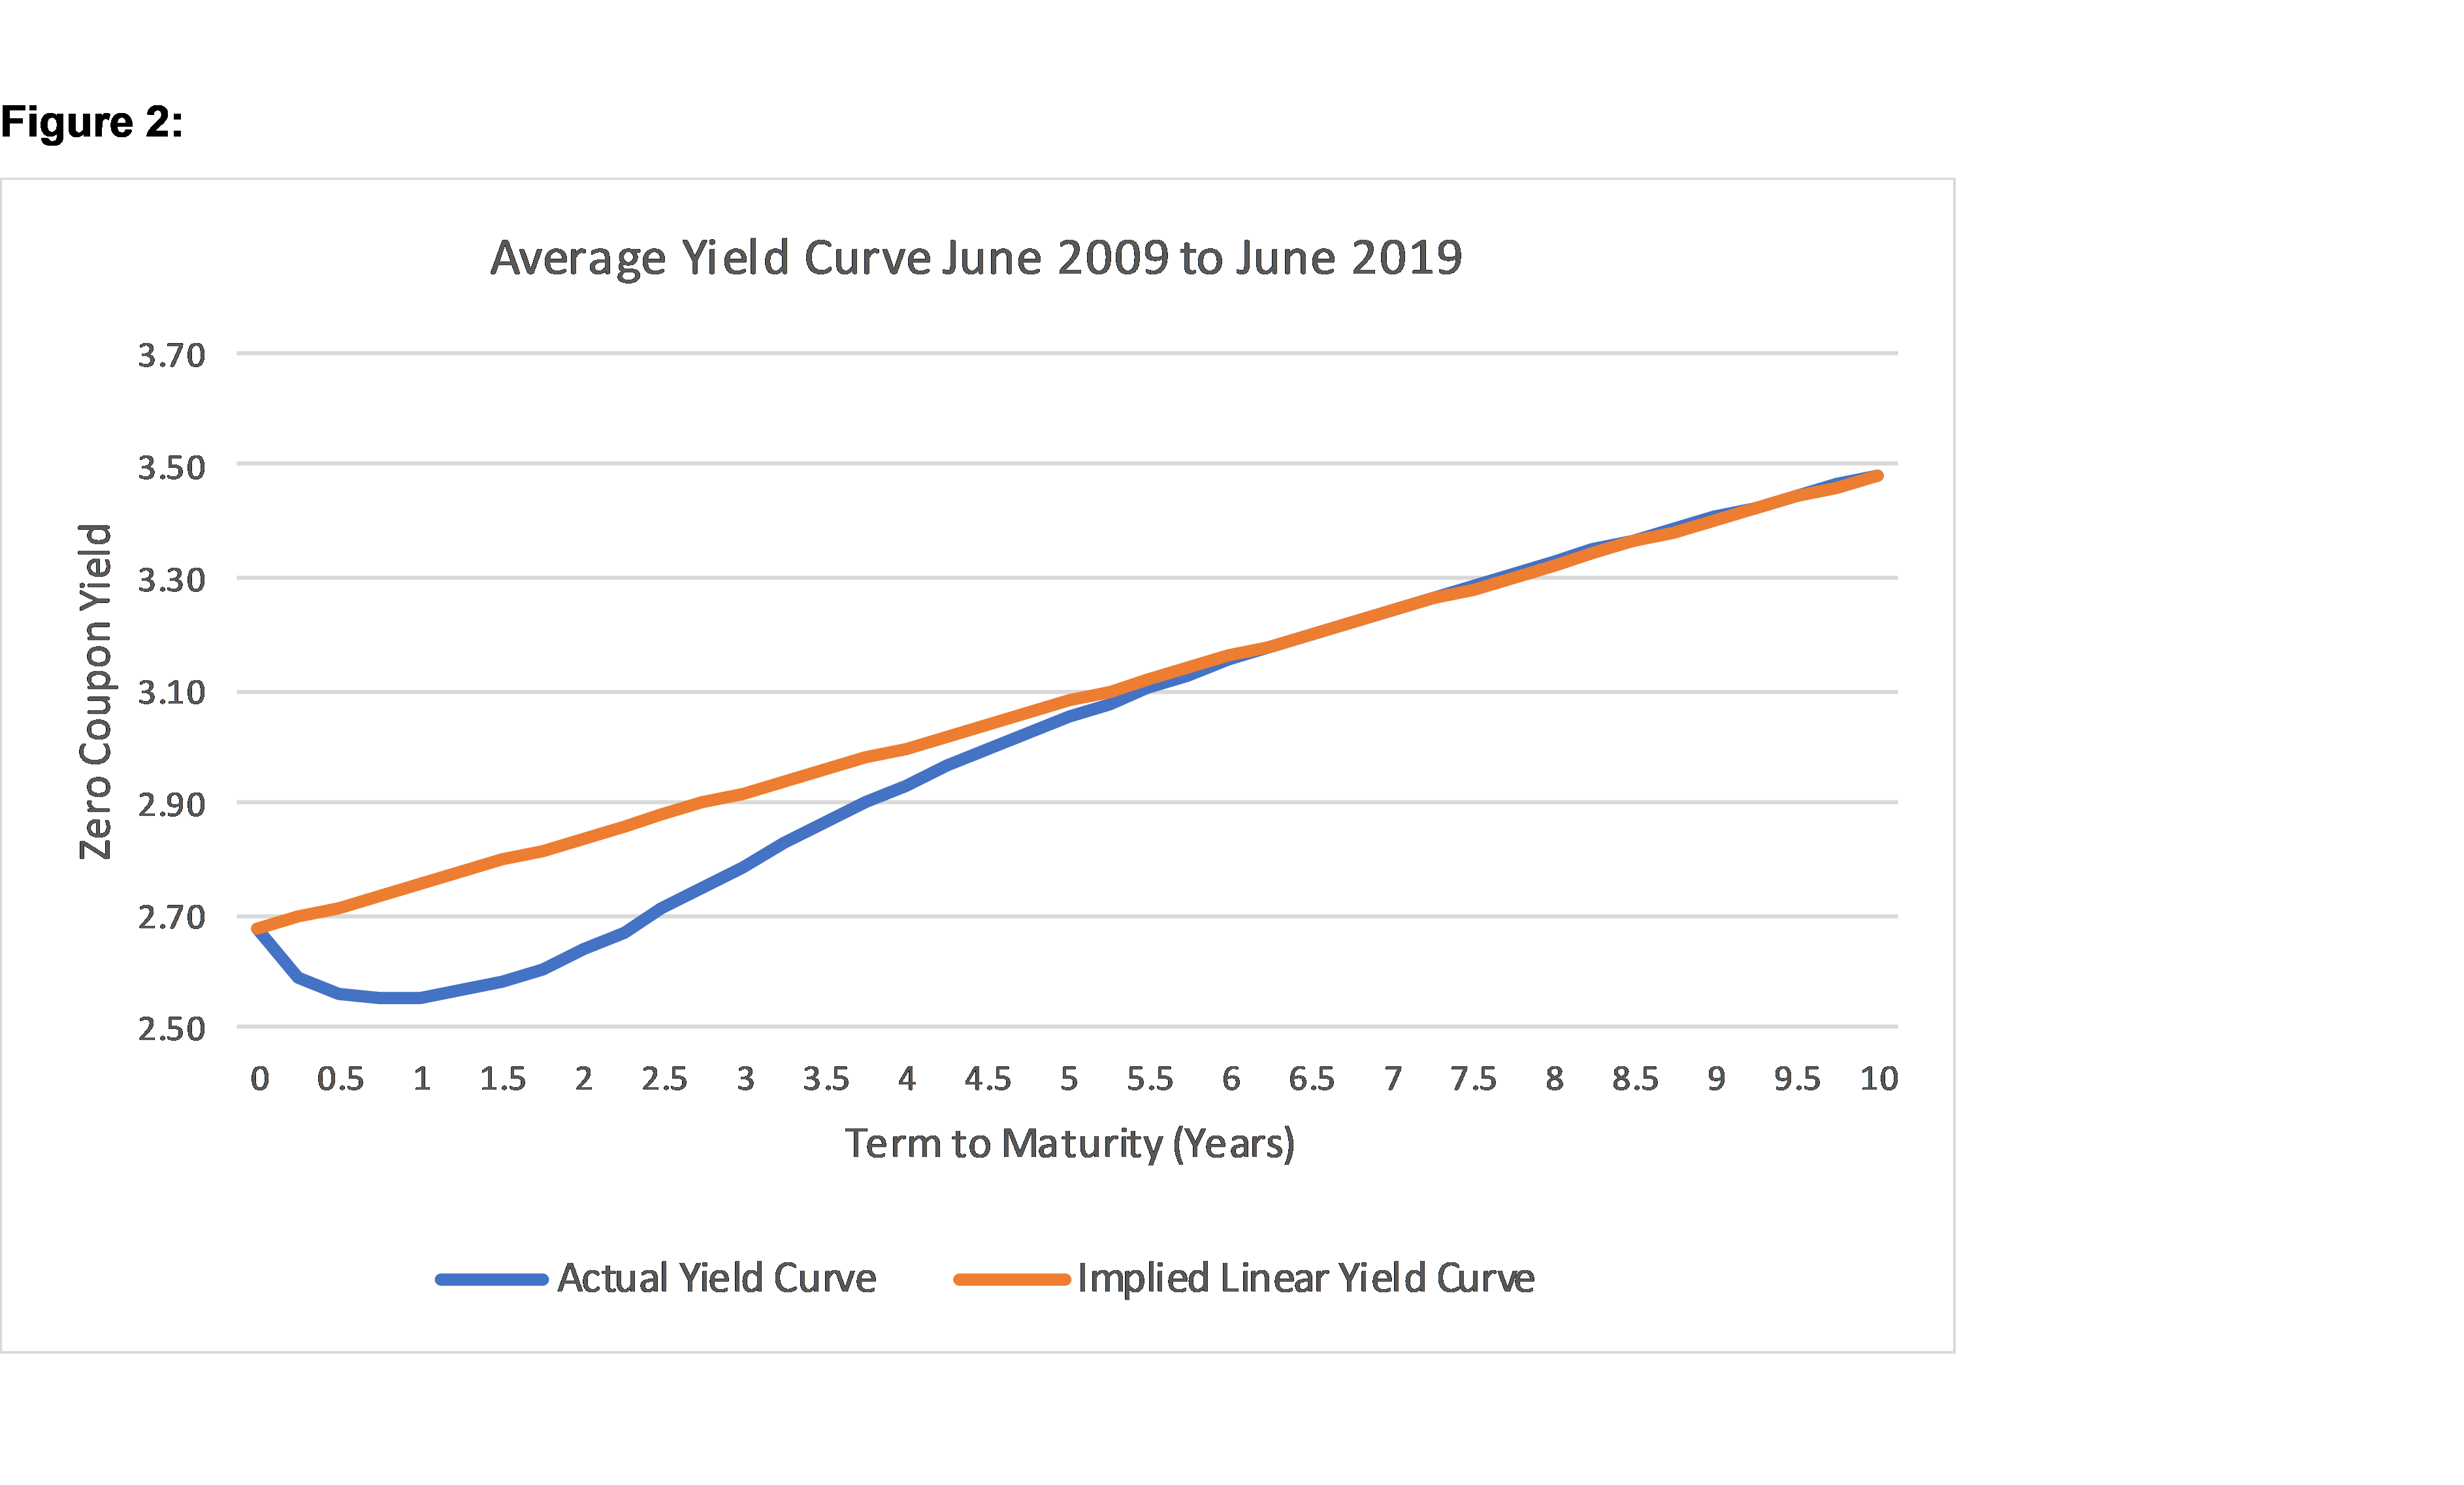
The non-linearity of the yield curve for terms to maturity below 5 years is quite apparent which in turn drives the pick-up in expected ‘carry and roll’. As the term to maturity moves out past 5 years the yield curve becomes almost perfectly linear. This highlights how even though the ‘carry’ on a bond longer than 5 years is rising the linear nature of the curve does not increase the expected ‘carry and roll’; i.e. excess expected ‘carry and roll’ is not generated from a linear yield curve. It follows that often, despite the existence of an upward sloping yield curve, the higher expected ‘carry and roll’ is earned predominantly from the non-linearity of the curve. This is the important characteristic to keep in mind when considering the ability of expected ‘carry and roll’ to add value to a bond portfolio.
Expected ‘carry and roll’ and actual ‘carry and roll’ need to be linked
While non linearity of a yield curve is important there must also be another important relationship if an investor is to successfully use expected ‘carry and roll’ to generate higher returns. The potential for higher returns from expected ‘carry and roll’ will only be realised by the investor if there is a positive relationship between expected and actual ‘carry and roll’. Put another way higher expected ‘carry and roll’ needs, on average, to translate into a higher actual ‘carry and roll’ if the investor is to make money from such a strategy. To see if this relationship exists the actual ‘carry and roll’ per 0.25 year increment in term to maturity can be calculated over the same time period (again a polynomial line of best fit is included given the volatility in returns as term to maturity moves longer).
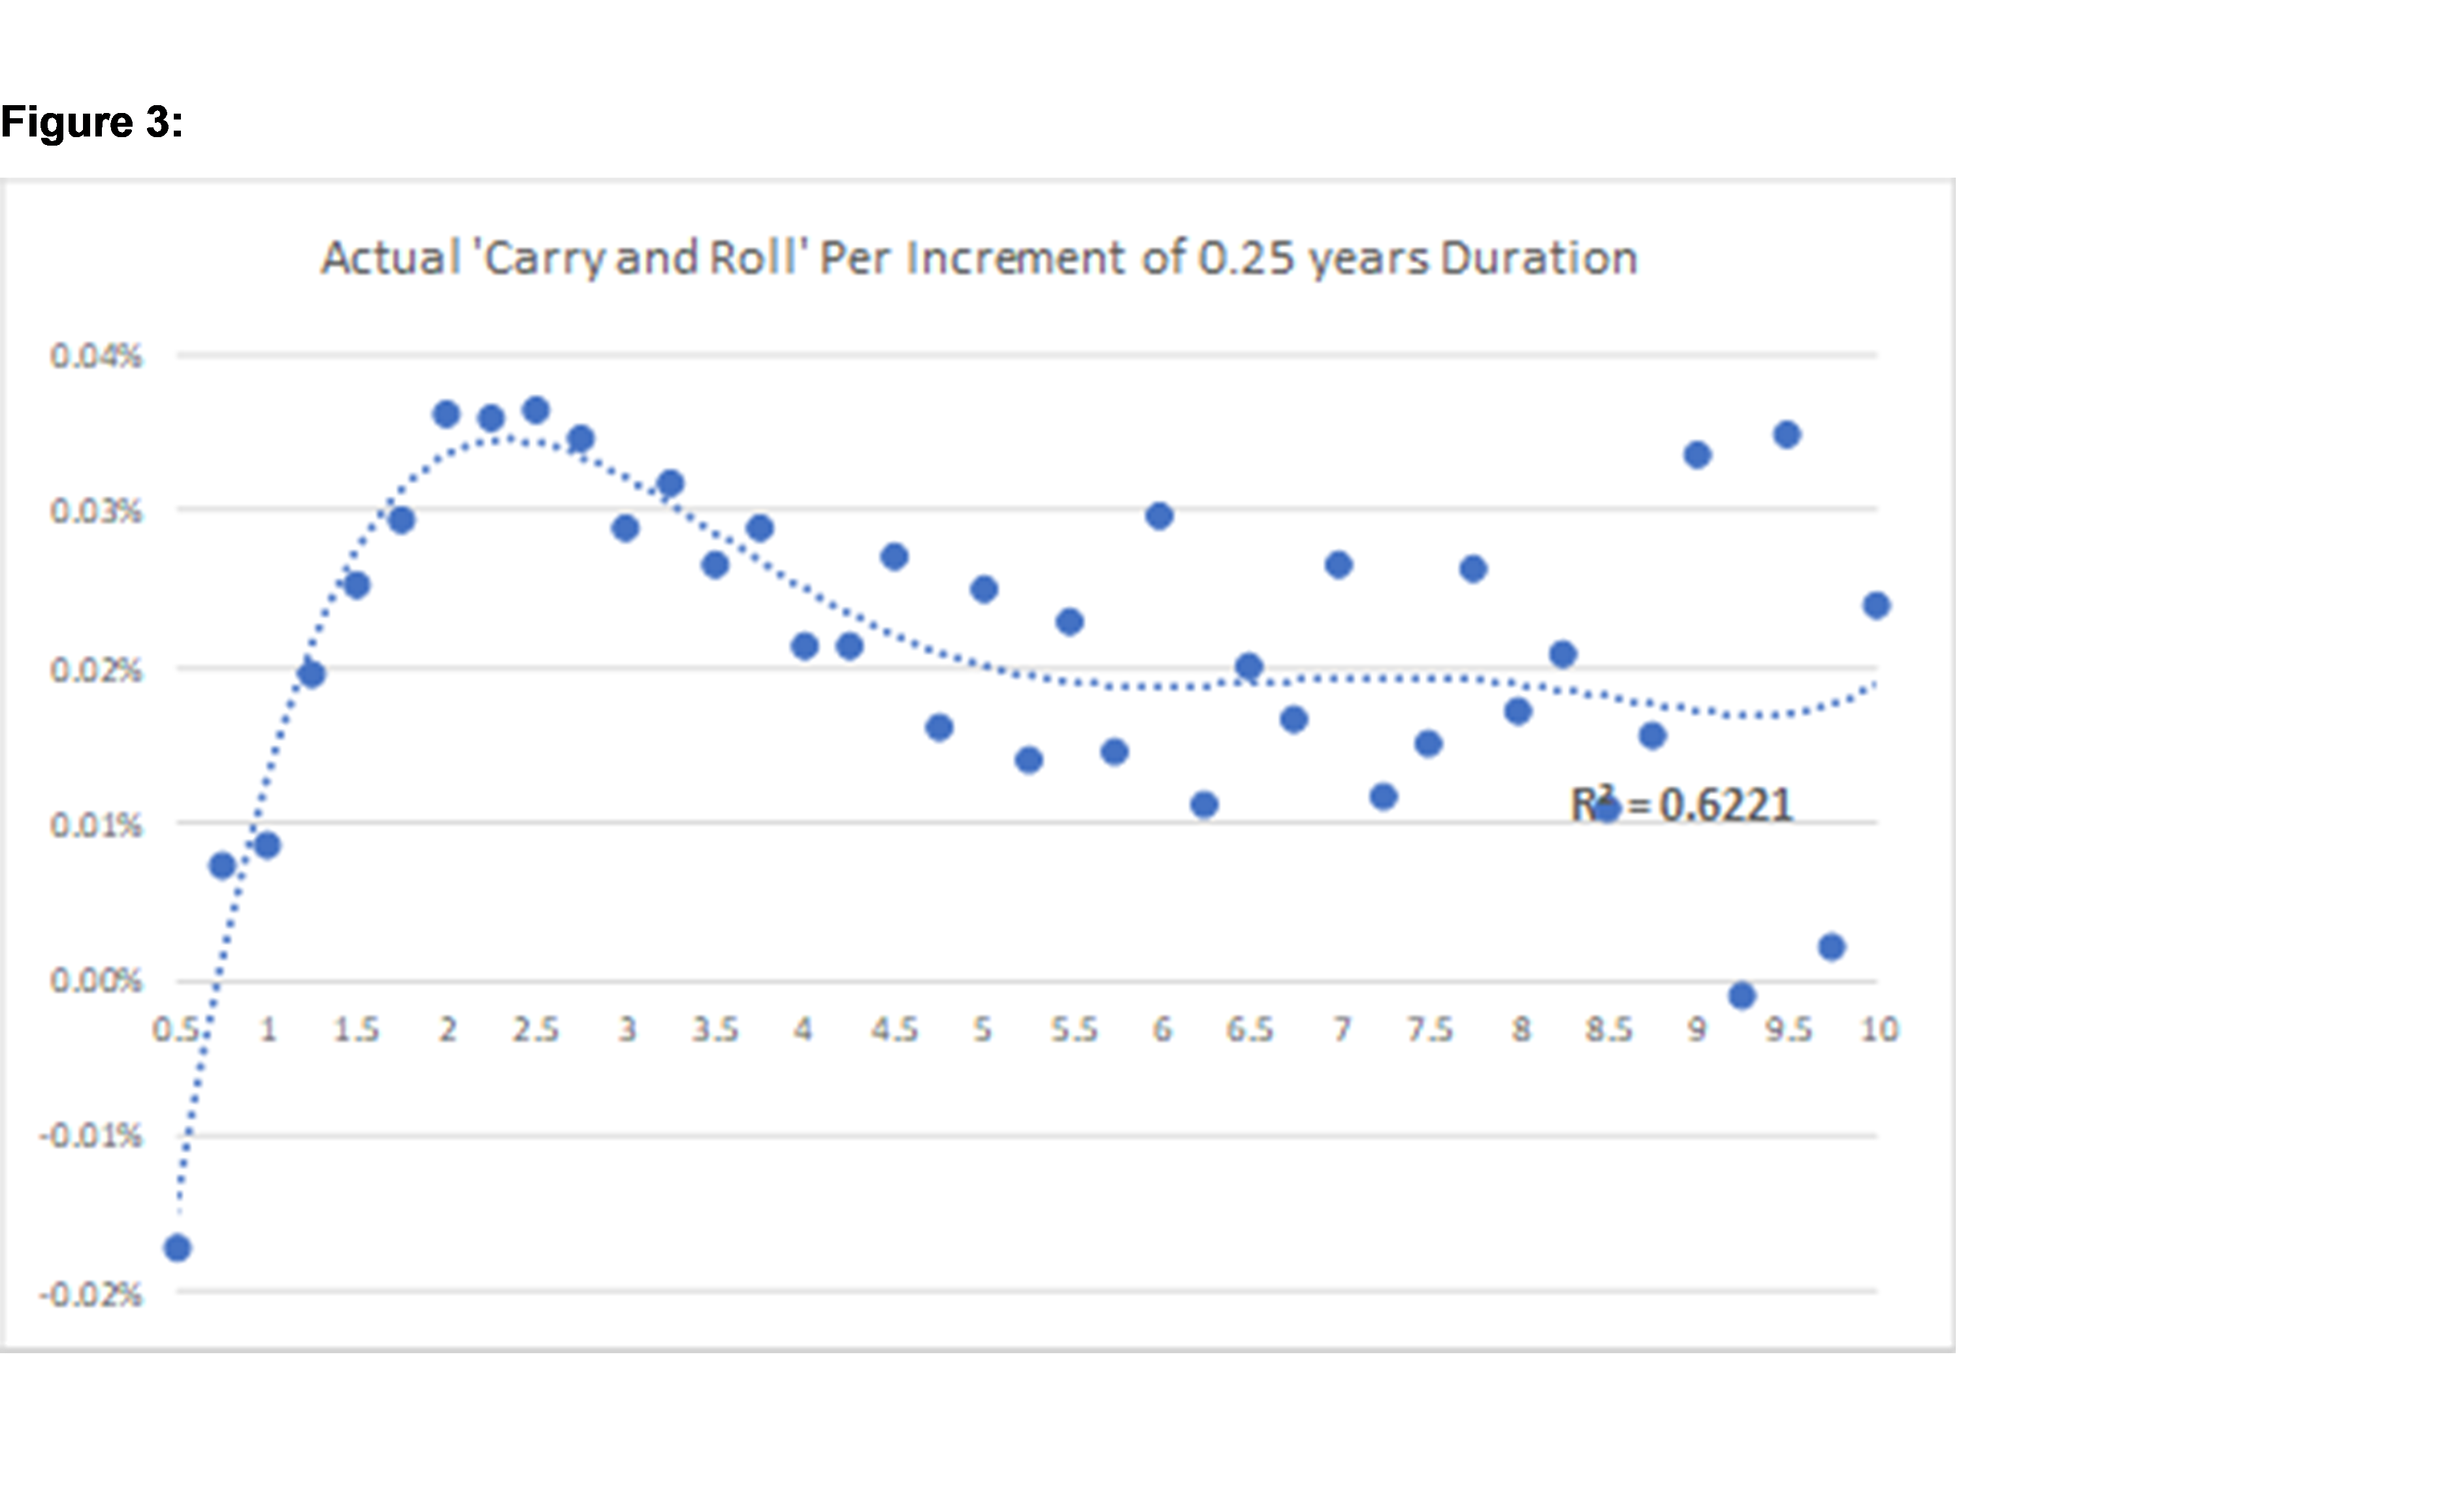
What is evident from Figure 3 is that on average the actual ‘carry and roll’ exhibits a similar return profile to the expected ‘carry and roll’. The similarity in return profiles highlights that over the last decade there has been a strong positive relationship between the actual and expected ‘carry and roll’. This positive relationship points to investors being able to earn higher returns from maximising the expected ‘carry and roll’ in a portfolio. This is not to say that this relationship holds in every month as expected and actual returns will vary. However, the evidence highlights how over the longer term taking advantage of the non-linearity in yield curves to maximise expected ‘carry and roll’ can generate higher returns for investors.
Investors wanting to maximise the returns on their bond portfolio may often look to invest in the higher yielding part of the curve. However, the evidence suggests that in seeking to maximise the return on bonds it is the non-linearity of the curve which is the more important factor to consider. Importantly for investors the last decade suggests that the curve is more likely to be non linear towards the shorter end of the term to maturity spectrum. This highlights how often it is more important for investors to take advantage of any non-linearity in the yield curve to maximise ‘carry and roll’ rather than simply increasing ‘carry’ by structurally tilting towards longer term to maturity securities.

Never miss an update
Enjoy this wire? Hit the ‘like’ button to let us know.
Stay up to date with my current content by
following me below and you’ll be notified every time I post a wire
By
Clive Smith,
Clive Smith is an investment professional with over 35 years experience at a senior level across domestic and global public and private fixed income markets. Clive holds a Bachelor of Economics, Master of Economics and Master of Applied Finance degrees from Macquarie University and is a CFA ® charterholder.

1 topic
Clive Smith is an investment professional with over 35 years experience at a senior level across domestic and global public and private fixed income markets. Clive holds a Bachelor of Economics, Master of Economics and Master of Applied Finance...
Expertise
Clive Smith is an investment professional with over 35 years experience at a senior level across domestic and global public and private fixed income markets. Clive holds a Bachelor of Economics, Master of Economics and Master of Applied Finance...
Expertise
Comments
Comments
Sign In or Join Free to comment