Navigating the inefficiencies of the gold sector
Almost 10% of the 2,200 companies on the ASX are primarily gold companies. Gold is the fourth largest Australian goods export, after iron ore, coal, and natural gas. The gold ecosystem is a stock-picker’s paradise: volatile, not well researched, and inefficiencies abound. Most of the companies are too small to attract substantial analysis. Gold stocks have been reviled for the last few years. However with the gold price rise in early 2016, which probably saw off the bottom in the gold price, the gold stocks are merely deeply unpopular. When money moves into the gold sector it generally starts at the top (Newcrest, $15b) then cascades down to the smaller and riskier stocks, as the initial stocks get bid up, and later investors look further down the risk curve to find better value. Surfing the wave of revaluations of progressively smaller companies can be very profitable.
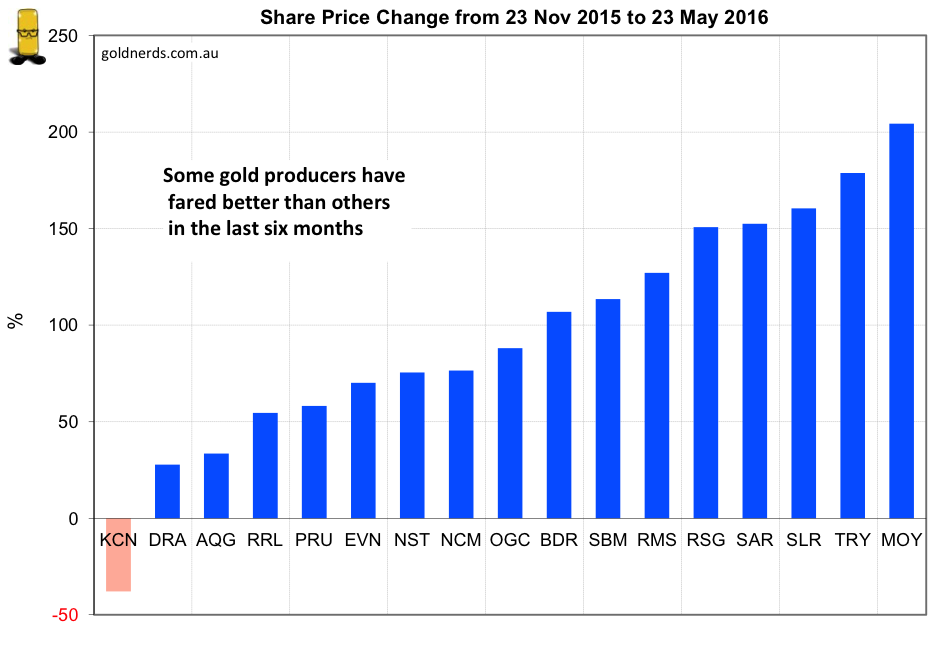
There are currently 11 gold companies with market capitalizations over a billion, then a further 20 over $100m, 20 more over $50m, 76 more over $10m, and another 76 below $10m. In the last six months, the share prices of those five groups have risen respectively 74%, 122%, 65%, 85% and 27%. The 41 producers rose 64% on average, the 56 developers rose 81%, while the 108 explorers rose 55%. The sweet spot was certain small miners and developers, while most small explorers have yet to see much improvement.
Pricing inefficiency in the sector is rife because hardly anyone analyses it in much detail. As far as we know, we are the only group to analyze the entire sector.
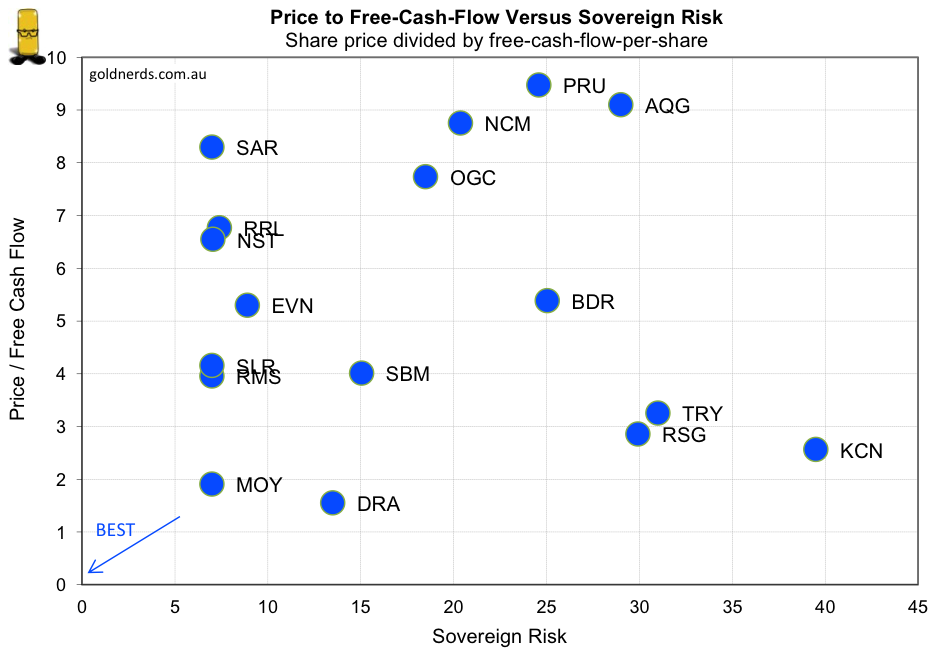
We estimate the free cash flow simply by the number of ounces produced times the difference between the price of gold and the all-in sustaining cost of mining. While this overestimates the true free cash flow a little, it is far easier to determine for most companies on a comparable basis.
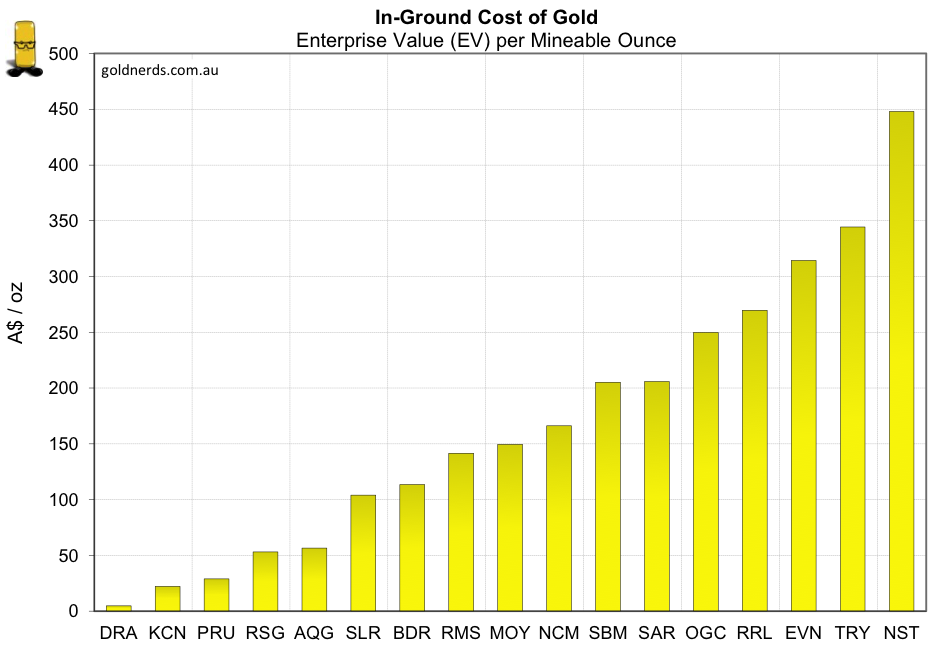
The cost of the gold in the ground held by companies varies widely, and of course increases as a company gets closer to production and increases if the gold is cheaper to mine. Owning more ounces gives an investor greater leverage to an increasing price of gold. Many explorers and developers have gold resources costing less than $30 per ounce, even $10 per ounce—much cheaper than buying gold bullion at $1,700 per ounce, but riskier.
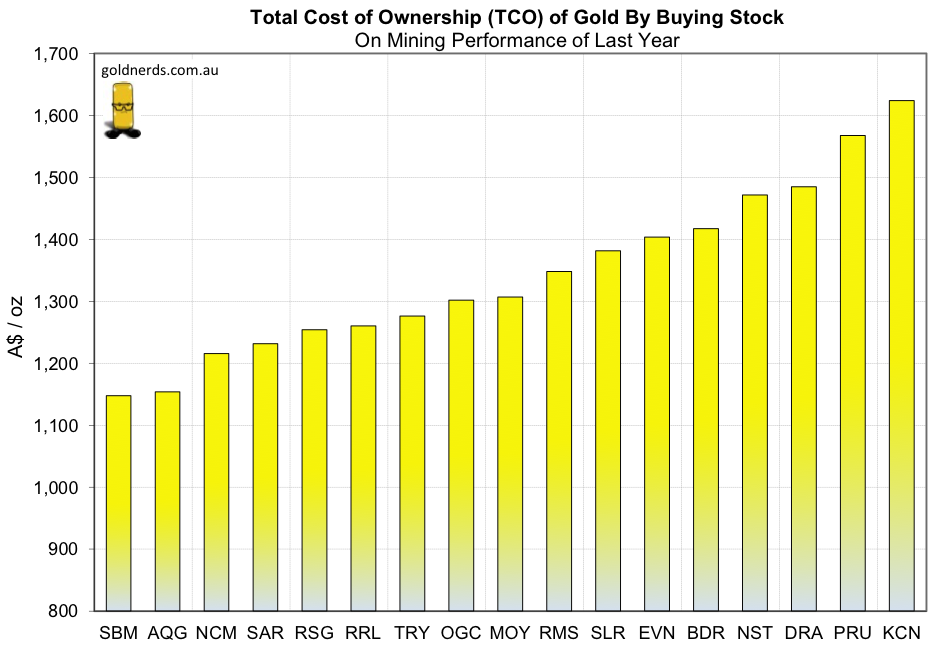
GoldNerds has a custom metric of total cost of ownership (TCO), the sum of a company’s in-ground gold, mining costs, and any remaining mine construction costs; all expressed on a per ounce basis. Companies in similar circumstances (should!) tend to have similar TCOs.
GoldNerds is a subscription service, selling friendly, sophisticated spreadsheets of information for investors, comparing all the gold and silver companies on the ASX. As far as we know, we provide the only comparison across the whole sector.
By Dr. David Evans, founder of GoldNerds: (VIEW LINK)
Never miss an update
Enjoy this wire? Hit the ‘like’ button to let us know.
Stay up to date with my current content by
following me below and you’ll be notified every time I post a wire
Livewire Exclusive brings you exclusive content from a wide range of leading fund managers and investment professionals.
2 topics
Livewire Markets
Livewire Exclusive brings you exclusive content from a wide range of leading fund managers and investment professionals.
Expertise
Livewire Markets
Livewire Exclusive brings you exclusive content from a wide range of leading fund managers and investment professionals.
Expertise
Comments
Comments
Sign In or Join Free to comment