TOL - 19th Nov, 2020
Recovery sectors made obvious
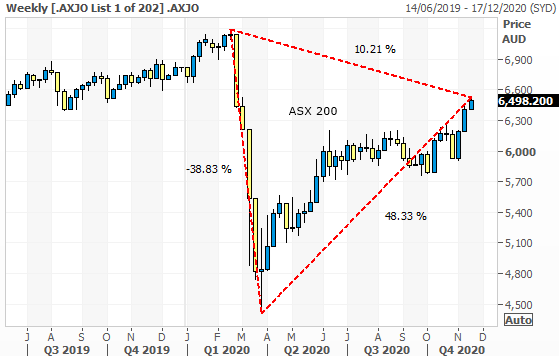
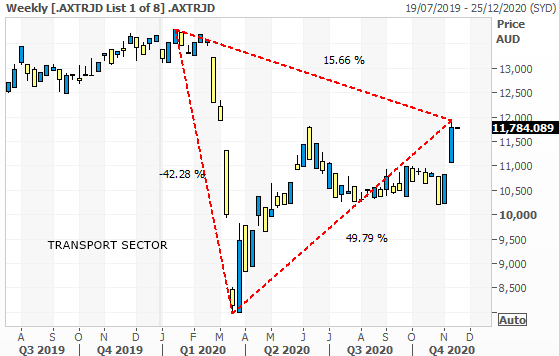
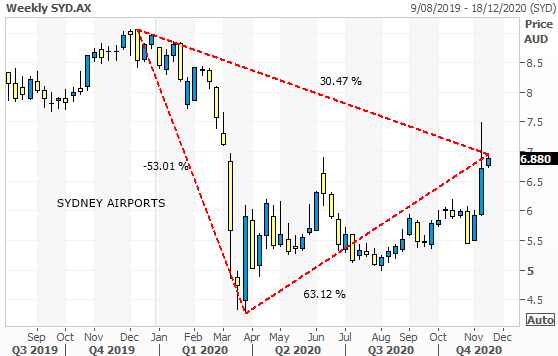
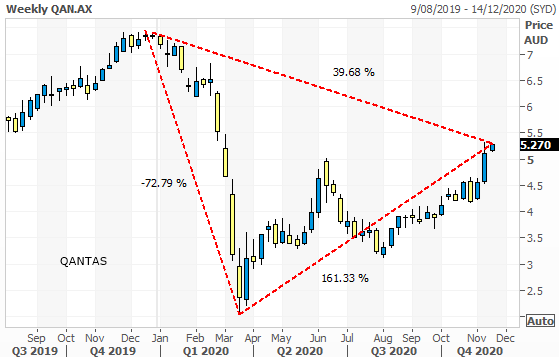
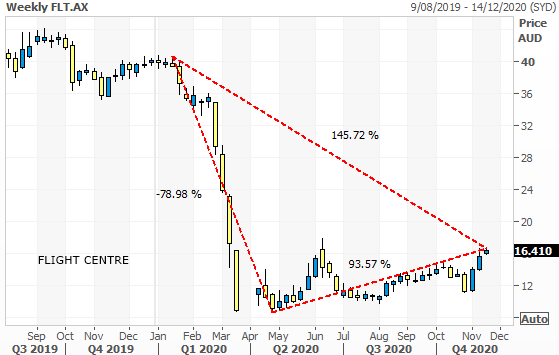
For a bit of insight into the recovery potential of certain sectors here are some charts showing what I have called “Recovery triangles” which show how far a sector fell from the high in February to the low in March, how far it has recovered since, and how much further it would have to rise or fall to return to the February high.
The numbers on the charts indicate the direction of the line, a positive number indicates that it is measuring a rise, negative numbers indicate a fall.
It makes it blatantly obvious which sectors have the most recovery potential should we get back to a normal level of economic activity.
Here is the first chart showing the market as a whole - this is the ASX 200. The triangle shows that it fell 38% from top to bottom, has recovered 48%, and would have to rise 10% to recover the high in February.
SECTORS AND STOCKS
Caveat - Some stocks have had significant share issues as they raised capital to stay alive in the pandemic - which means that returning to the pre-pandemic February highs is unlikely.
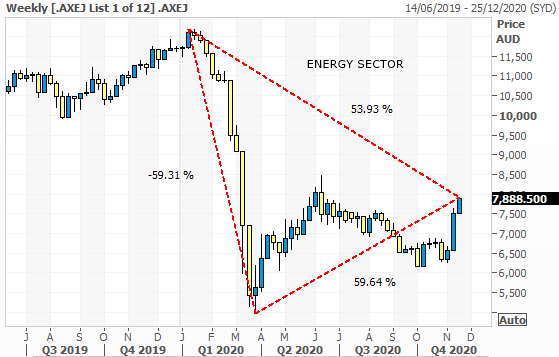
- The energy sector (OSH, WPL, ORG, STO, WOR), one of the most obvious recovery plays from here, huge potential still. The sector fell 59%, has recovered 59%, and would have to rise 53% to get back to the high in February. These are all weekly candle charts.
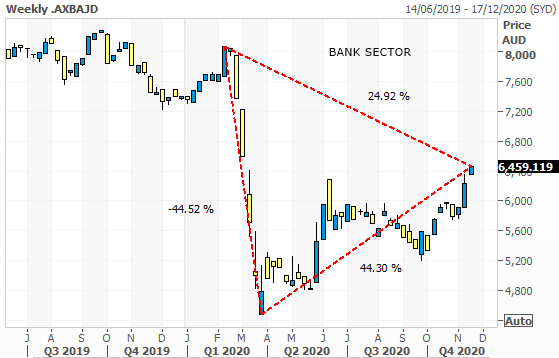
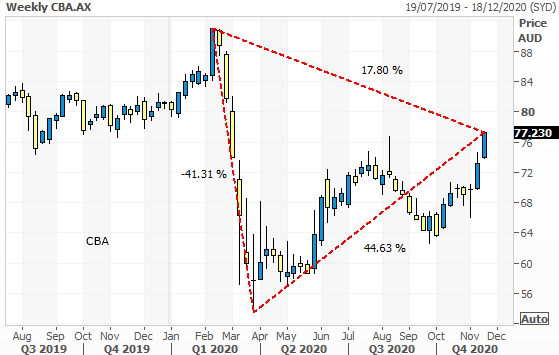
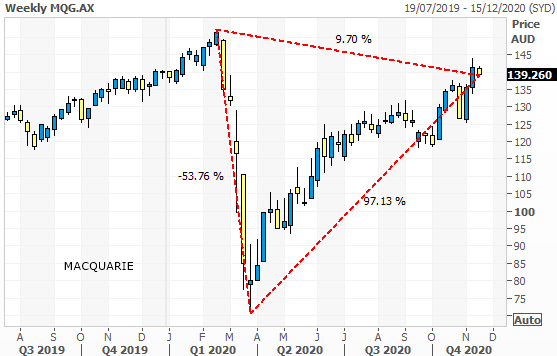
- The bank sector (WBC, ANZ, NAB, CBA, BEN, BOQ, MQG) fell 44%, has bounced 44%, and would have to rise 24% to recover the February high.
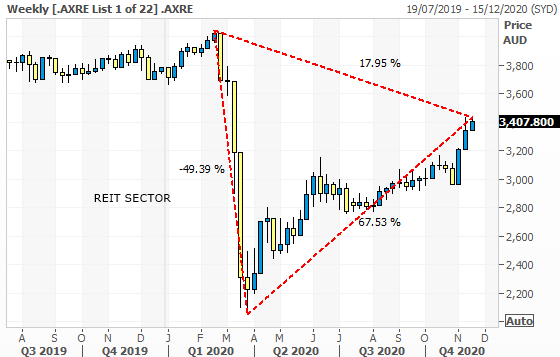
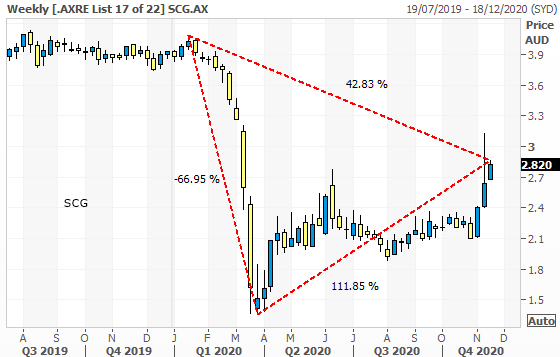
- The REIT sector (URW, SCG, DXS, LLC, GPT, VCX, MGR) fell 49%, has bounced 67%, and would have to rise 18% to recover the February high.
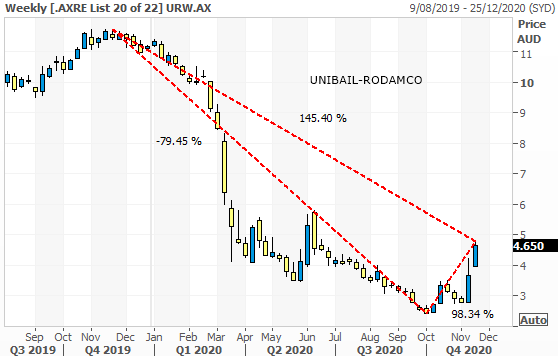
- The poster child of the retail rout in REITs - Unibail-Rodamco (URW) is 98% up from the bottom having fallen 79%, but would have to jump 145% to recover the February high. It is also a great example of how you shouldn’t be put off buying a stock just because it has gone up. It may be up 98% but it is still heavily oversold from the highs. As a French domiciled business with investments in retail properties in Europe, it is perhaps one of the most geared stocks to a vaccine.
- The Transport Sector – would have to rise 15% to recover the February high.
- SYD - would have to rise 30% to get back to the February high.
- QAN - would have to rise 39% to get back to the February high.
There is no travel sector index so here are a couple of stocks - I’ll leave you to read the numbers.
- FLT - would have to rise 145% to get back to the February high.
-
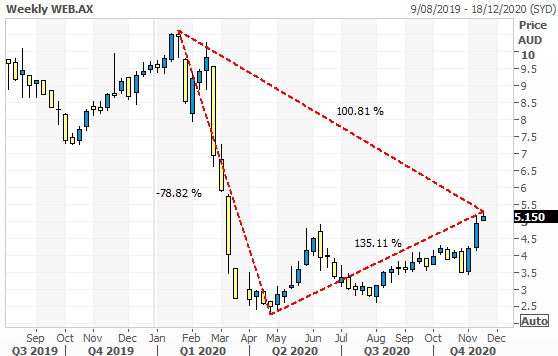
WEB – would have to rise 100% to get back to the February high. Like some of the other hard hit recovery stocks WEB had a huge capital raising so is unlikely to recover the February high anytime soon.
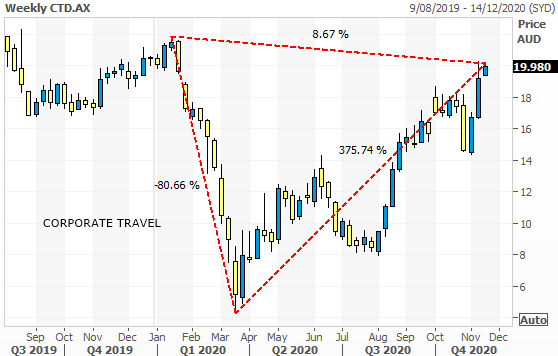
- CTD - has already had a huge bounce and is only 8% from the February high. It shows you what FLT and WEB could do still.
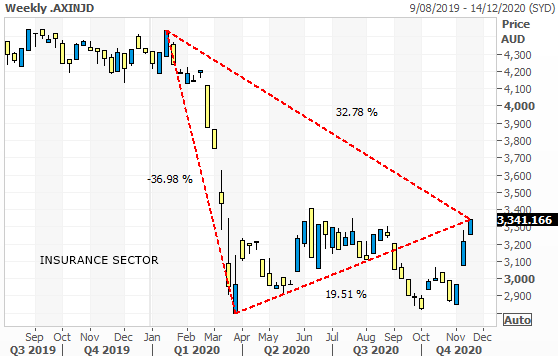
- The Insurance sector – would have to rise 32% to recover the February high.
MIDDLE GROUND - Sectors that are not obvious recovery sectors or pandemic beneficiaries.
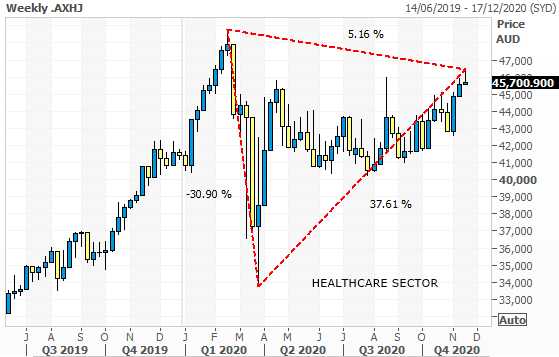
- The Healthcare sector, is in the middle ground when it comes to pandemic victims or beneficiaries. It fell 30%, recovered 37%, and would have to rise 5% to recover the February high.
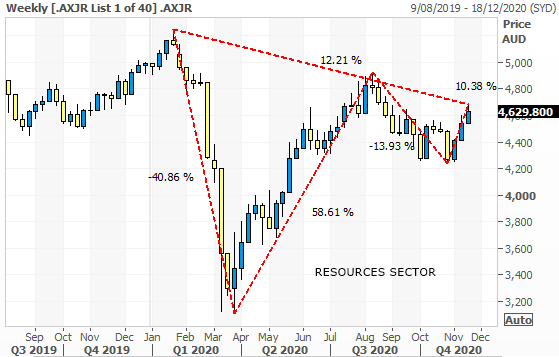
- The Resources sector – Another sector in the middle ground, a clear loser from a slowdown in economic growth but it has been buoyed by a very resilient Chinese demand for iron ore and a buoyant iron ore price. Net result it fell 40%, bounced 58%, fell 14%, bounced 10% recently and is still 12% below the February high.
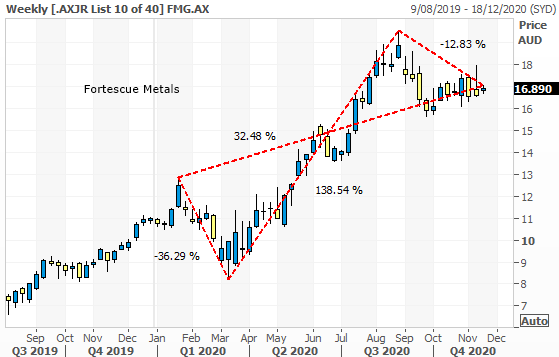
- Here is the poster child of the recent iron ore price strength – Fortescue Metals - it initially fell 36%, rebounded 138%, and has seen some profit-taking recently taking it down 12.8%. It is currently 32% above the February high.
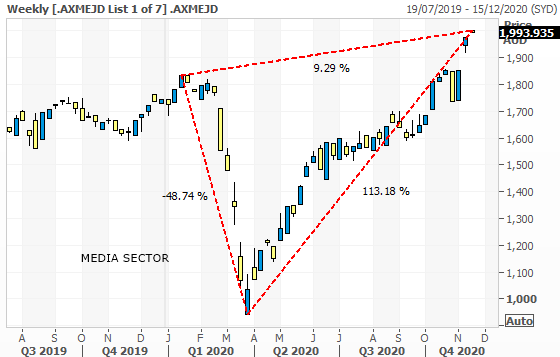
- The Media sector – has done remarkably well but is hardly a homogenous group including a smorgasbord of stocks most of which are online businesses including NEC, REA, NWS, SEK, CAR, DHG.
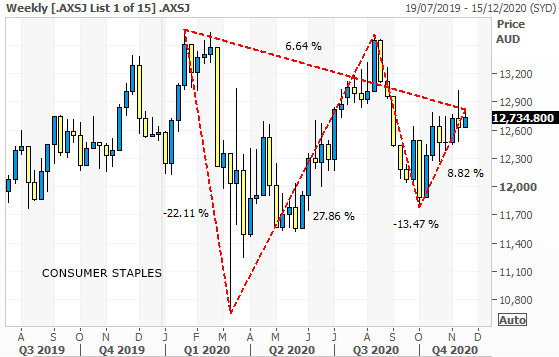
- The Consumer Staples sector (WOW, COL, MTS, A2M, CCL, TWE, BKL, GNC, TGR, CGC, ELD) has performed defensively and would still have to rise 6% to recover its February high.
PANDEMIC BENEFICIARIES - These are sectors would be expected to underperform a recovery rally.
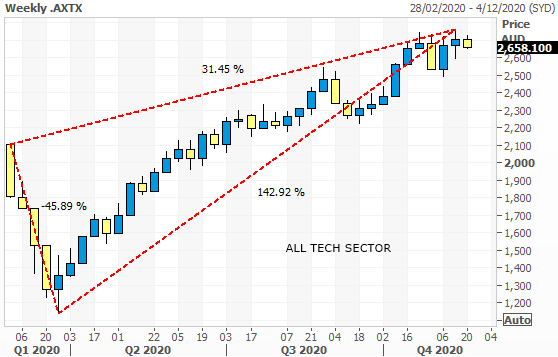
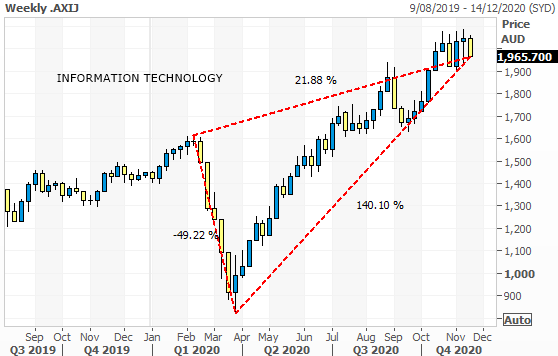
- The ALL TECH sector started life about a week after the pandemic sell-off started, but the picture is pretty clear either way, the sector fell 45%, bounced 143%, is 31% above the February high and is holding up quite well despite the recent sell-off. This sector is of course dominated by APT plus REA and XRO. The more established information technology sector chart is down below as well, very similar.
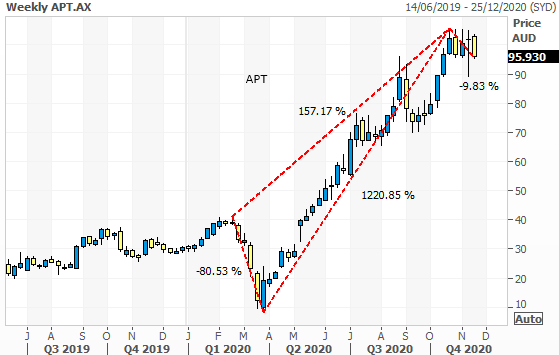
- And this is the Afterpay (APT) recovery triangle - hindsight is a wonderful thing, but this is all you needed to know this year. A 12 bagger in eight months.
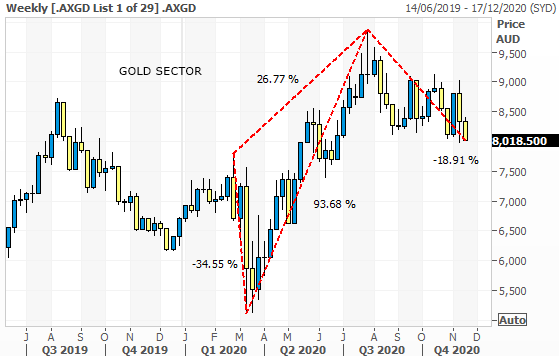
- The Gold sector fell 34%, bounced 93%, is 26% above its February high, and has fallen 18% as the market has rallied recently.
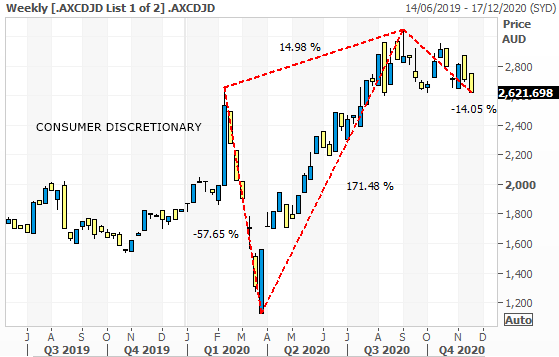
- The consumer discretionary sector boomed after the initial sell-off as everyone settled in at home and started spending their Jobkeeper, Jobseeker, Super withdrawal and travel money online. The sector fell 57%, rose 171%, is 15% above the February high, and has fallen 14% as the market has rallied recently.
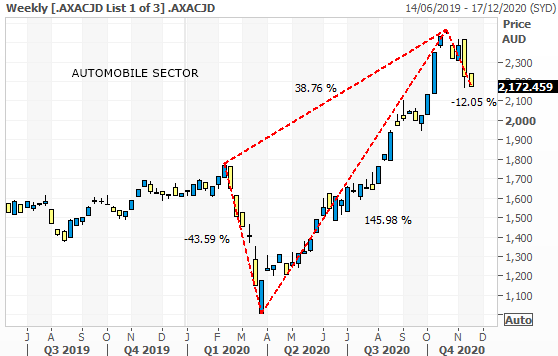
- The automobile sector (ARB, GUD) is one of the pandemic beneficiaries. It fell 43.6%, Rose 145%, is 38.7% above the February high and has fallen 12% since the pandemic news
With the adults back in control of the White House and with vaccine optimism seeping into some of the recovery sectors I envisage a much quieter “Tweetless” life as an investor - steady, predictable, boring. Is it too much to ask for a steady if plodding bull market? The foundations are being built and there is still significant recovery potential as you’ll see above in some stocks and sectors.
Never miss an update
Enjoy this wire? Hit the ‘like’ button to let us know.
Stay up to date with my current content by
following me below and you’ll be notified every time I post a wire
Marcus Padley founded Marcus Today in 1998 and leads the team of analysts and market commentators that publishes a daily stock market newsletter, presents four podcasts and runs an $80m Australian equity fund. He is passionate about educating and informing private investors with insightful, honest, straight-up independent stock market research and ideas. Marcus likes to call it as it is without agenda, puts subscribers first, and this has paid off for real people with real money.
........
IMPORTANT - The content included on our website and in our emails has been prepared to provide general information only and, as such, the specific needs, investment objectives or financial situation of any particular user accessing the Marcus Today website or associated e-mails have not been taken into consideration. Each individual user should obtain advice from their financial planner or advisor before acting on any information provided on the Marcus Today website or associated e-mails so that such individual users can obtain advice applicable to their personal circumstance from their own financial advisor. Please note that stocks can go down as well as up. Past results are not indicative of future performance and returns can be negative.
AFSL - Marcus Today Pty Ltd (ACN 110 971 689) is a corporate authorised representative of MTIS Private Wealth License no. 473383.

4 topics

Marcus Padley founded Marcus Today in 1998 and leads the team of analysts and market commentators that publishes a daily stock market newsletter, presents four podcasts and runs an $80m Australian equity fund. He is passionate about educating and...
Expertise
Marcus Padley founded Marcus Today in 1998 and leads the team of analysts and market commentators that publishes a daily stock market newsletter, presents four podcasts and runs an $80m Australian equity fund. He is passionate about educating and...
Expertise
Comments
Comments
Sign In or Join Free to comment