Regulators late to the debt party

Clime Investment Management
Clime Investment Management
The declaration two weeks ago by the Australian Prudential Regulation Authority (“APRA”) that it was taking further steps to slow the growth of bank provided “interest only” loans in residential property is to be welcomed. However, it represents a reactionary policy that does not target either an appropriate pricing framework for housing or a desired annual rate by which house prices should increase. Rather the loan restrictions are intended to ensure financial stability by reducing the excessive leverage of speculators in the residential property market. It forces the banks to properly manage or reassess their credit quality and exposures to residential property after a period of unconstrained and rampant price growth.
Today the Australian residential property market operates in a policy vacuum. Australian Governments, be they Commonwealth or State, have been content to see residential property prices rise because higher prices ensure votes (from the baby boomers for the moment) and taxation revenue (both stamp duty and land taxes). Until property prices fall or until there is a major voter backlash (“Y” generation), politicians seem content to let prices run. It is now left to the regulators (APRA, RBA and ASIC) to intervene but these entities are not charged with either ensuring affordability or ensuring pricing fairness in the housing market. The regulators are late to the party after years of watching the relentless growth in household debt that over the last few years has grown at multiples of household income.
The statement by APRA last Friday succinctly articulates the observable results of the housing policy vacuum. To quote “… The environment of heightened risk that has prevailed for the past few years has not lessened: the environment remains one of high housing prices, high and rising household indebtedness, subdued household income growth, historically low interest rates and strong competitive pressures. APRA has therefore concluded that further steps to address risks that continue to build within the mortgage lending market are appropriate. “
While Australia is not alone in having rampaging house prices, the following chart shows the extent of price increases over the last 37 years. Remarkably our neighbour New Zealand has produced a higher rate of price growth and particularly so over the last 17 years.
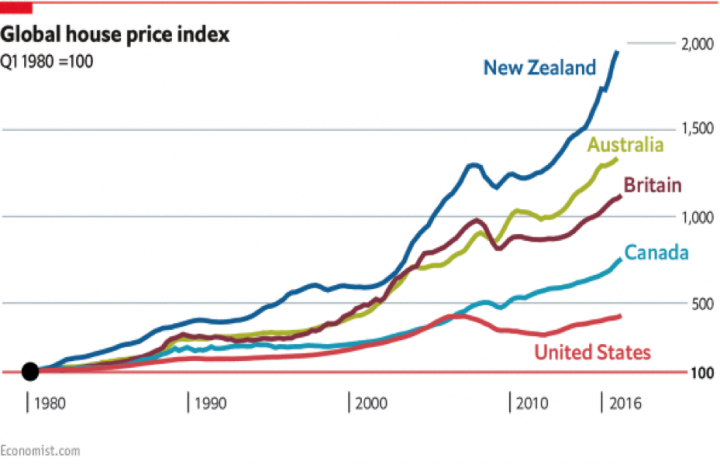
Figure 1. Global house price index
Source. Economist.com
It has been the sustained and compounding lift in house prices that has directly driven the growth in household wealth in Australia. It is a great current debate in Australia as to whether the growth in household wealth has led to a more harmonious society. In the following section, we will constantly turn back and forth between asset values, debt and household cash flows.
To examine wealth and debt in detail, we draw on a recent release by the Australian Bureau of Statistics (ABS): Finance and Wealth December 2016. This report highlights and helps put into context the level of debt across the Australian economy.
Household balance sheets
At the end of December quarter 2016, household net worth was $9.4 trillion of which land and buildings (mainly residential property) accounted for $6.4 trillion. The solid growth in household net wealth over the December quarter was primarily driven by property prices, predominantly in Sydney and Melbourne.
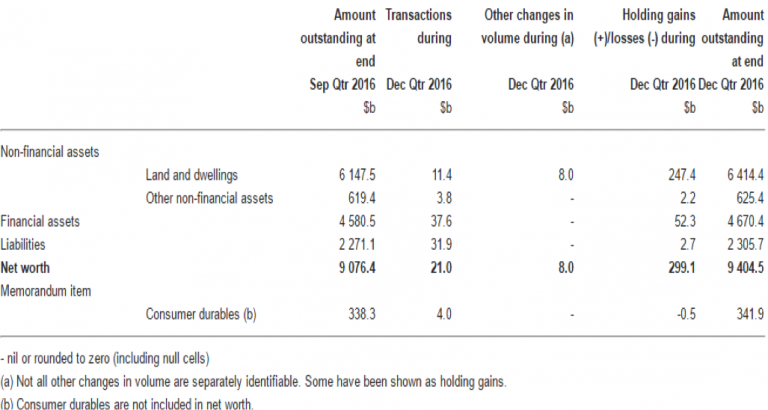
Figure 2. Household Accumulation of Wealth
Source. ABS
Households have approximately $11.7 trillion in gross assets, and dwellings represent 60% of these assets. The balance is financial assets covering cash, non-super investments and superannuation assets. At December 2016, financial assets are estimated at $4.67 trillion, of which some $2.2 trillion is represented by superannuation assets. Household liabilities (or debt) were $2.3 trillion, of which $1.7 trillion related to mortgages for occupiers and investors.
The level of mortgage debt to residential property value sits at about 30%. On this measure, some may opine that Australia’s household debt is not high – but it includes the houses of baby boomers that have little or no debt. It masks the level of debt that resides with the younger “Y” generation, and the make-up of this debt which has increasingly evolved towards “interest only” loans. It is the growth in “interest only” loans utilised by young families and investors to enter the property market that has stirred APRA and the RBA to become concerned.
The next chart gives a historic perspective to the movement in household wealth. Net wealth of households since the GFC has been primarily driven by growth in the value of residential property. The growth in superannuation assets, from about $1 trillion to $2.2 trillion over the same period, is impressive but is dwarfed by the increased value of residential property. Further, the increase in superannuation has substantially been driven by contributions and reinvestment. Capital gains as measured by the Australian stock market over the last ten years have been non-existent.
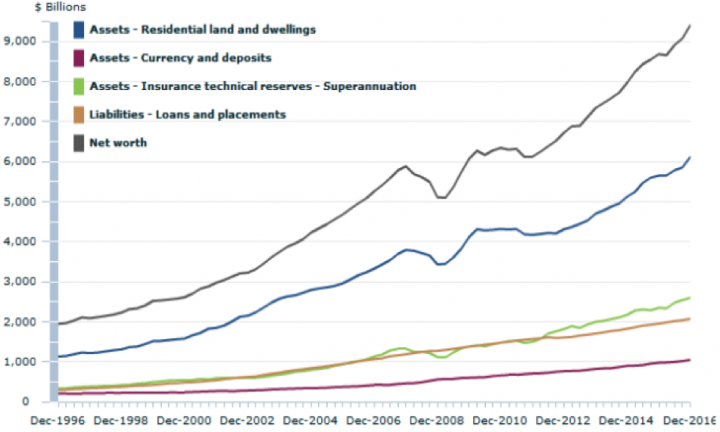
Figure 3. Components of Household balance sheet
Source. ABS
The above chart shows why Australian households have and continue to be intensely focused on residential property prices. It has truly been a superior returning asset and has outperformed all other asset classes over the last twenty five years. The sustained outperformance of residential property over equities is a damning indictment of the Australian capital market. In a recent report, Shaw and Partners showed that geared housing had produced a 16% constant annual growth rate over the last 15 years, which was 6% higher per annum than Australian shares.
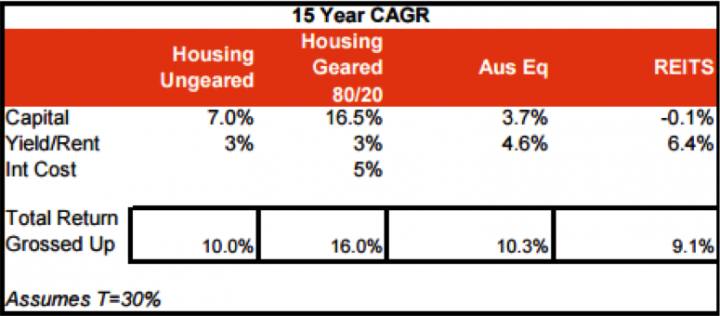
Figure 4. 15-year CAGR
Source. Shaw and Partners
The excessive returns observed from residential property are partly the result of speculative investment and this history is feeding further speculative investment. High returning asset classes always attract speculative investment and more so when debt is easily available.
The next chart shows the effect of the GFC on Australian interest rates and explains the surge in geared property investment. Leading up to 2008, Australia was headed towards a residential property slowdown as interest rates were starting to bite into the demand for mortgage debt. However, the GFC resulted in massive adjustment to monetary policy across the developed world as quantitative easing and zero interest rate policies were adopted. The openness of the Australian economy, with virtually no check on non-resident capital flows, resulted in lower mortgage rates consistent with offshore markets. This, combined with the vacuum in housing affordability policy, resulted in the massive surge in mortgage and property related investment debt. Because governments and regulators had no housing inflation target and mortgage debt was unconstrained by appropriate LVR regulations, the price of housing has exploded with debt. However, historic low mortgage rates have meant that the “interest payable to income” ratio has fallen for the Australian household sector.
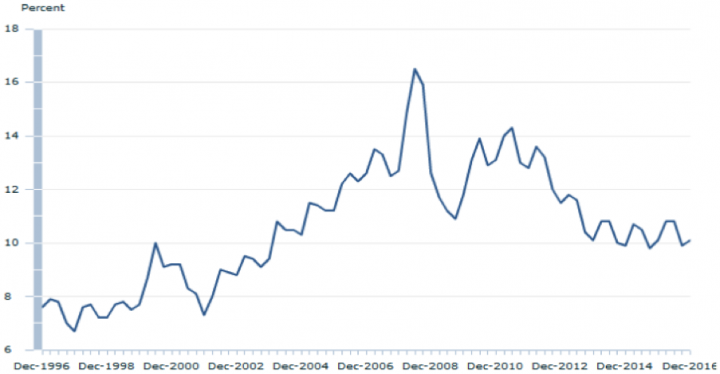
Figure 5. Interest payable to income ratio, households
Source. ABS
The problem with the above table is that the income figure includes those of lowly geared baby boomers. We need to slice and dice the national figures to determine the level of interest or mortgage stress for younger families. While we have no published analysis of this, we now see a heightened level of concern by the RBA and therefore we can presume that they are noting some disturbing trends.
Surging residential property values explain the next chart, which shows that the leverage or gearing of the household sector is falling. The balance sheet of the household sector has two sides; and the asset side (property) has increased in value faster than the debt side (mortgages). That is good news for property owners, investors and speculators – but terrible news for young families seeking to enter the housing market.
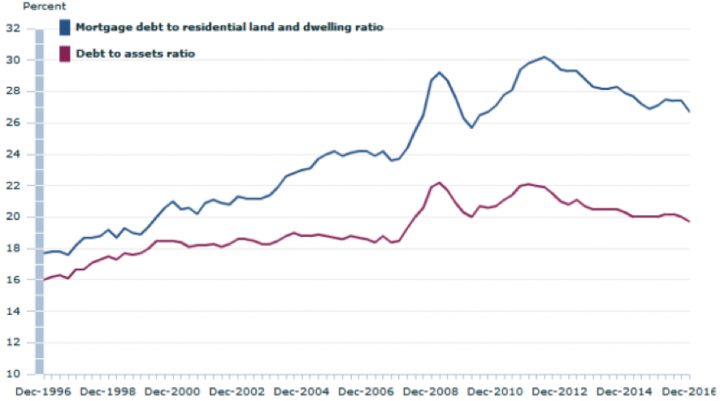
Figure 6. Gearing ratios
Source. ABS
In its report, the ABS noted that households’ “debt to liquid assets” ratio reflects the ability of the household sector to extinguish debts in a short period of time using their readily available, or liquid assets. The ABS noted that liquid assets included currency and deposits, short and long term debt securities, and equities. The ratio of household debt to liquid assets was 124.4% at 31 December 2016. In the ABS view, this ratio seemingly suggests that Australian households can extinguish all their debt quickly so we need not worry about $1.7 trillion of mortgage debt!
The problem with that superficial nonsense is that it fails to drill down into the detail of the matter. The CBA released a stunning analysis last week that suggests that a portion of Australia’s households are currently experiencing cash flow stress. To quote:
”Commonwealth Bank data has revealed that more than a third of Australians are spending more than they earn each month.
Not only are Australians overspending, but the new data reveals this overspend contributes to a large proportion of Australians struggling with financial wellbeing. Around 46 per cent believe they are not progressing towards their financial goals and just as many (45 per cent) of Australians are uncomfortable with their current level of spending.
The data also indicated more than half (56 per cent) of people would not have enough savings to handle a temporary loss of income and one in three Australian households would be unable to find $500 in an emergency.”
The ABS may be comfortable, but we should all hope that they are not advising the Federal Treasurer regarding household debt and liquidity. Clearly the RBA is doing its own analysis.
The Australian Credit Market
The ABS statistics give us a snapshot of the level of indebtedness across the economy as at December 2016. The following table discloses that Australia (ex financial intermediaries) has drawn some $6.1 trillion of debt.
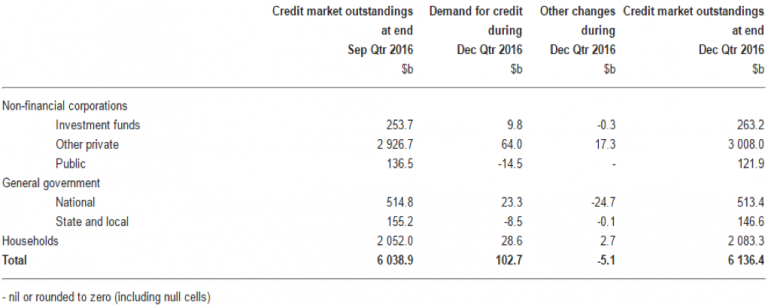
Figure 7. Credit Market Summary
Source. ABS
This is a gross figure and it represents about 360% of GDP. This ratio of debt to GDP has been fairly consistent over the last fifteen years. For instance, in 2008 Australia’s GDP broke through $1 trillion and gross debt was about $3.8 trillion. Since then, gross debt has lifted by $2.3 trillion or about 4 times the lift in annual GDP of $600 billion.
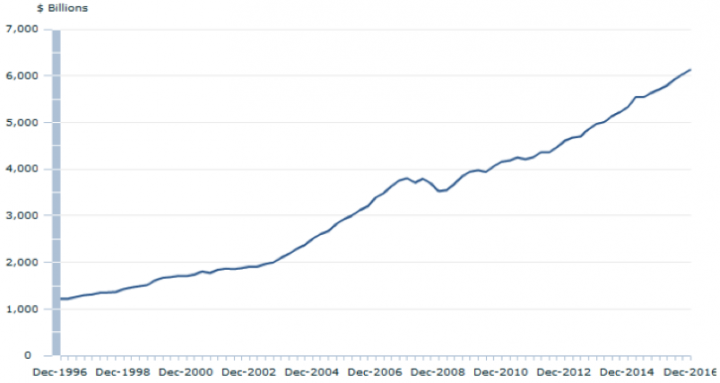
Figure 8. Credit market outstandings
Source. ABS
In 1996, Australia’s GDP was approximately $500 billion and the debt ratio 200%. Over the last twenty years, the major growth in debt has come from the household sector. In 1996, household debt was 50% of GDP; today, household debt is 120% of GDP. The growth in household debt has exceeded GDP over a long period and it exceeds household income over the last few years. This has put the RBA on red alert.
Investment
As noted above, balance sheets have two sides; and the increase in debt should be matched by an increase in assets (and primarily investment). When the investment creates something, as opposed to purchasing secondary stock, then capital formation is expanded.
The next chart from the ABS shows long-term trends in primary investment relative to GDP. The chart shows the extent of the resources investment boom (reaching its zenith in 2012) when it peaked at 18% of GDP. The other observation is that household investment to GDP is relatively static at 9% to 11% of GDP. This suggests that household investment in residential housing is mainly in secondary stock rather than in building new houses. This supports the argument that negative gearing does nothing to increase the housing stock.
Figure 9. Gross fixed capital formation, by sector, relative to GDP, seasonally adjusted
Source. ABS
The above chart also tracks general Government investment, which has remained fairly steady as a proportion of GDP (at approximately 3.0%) through the 2000s, after peaking at 4.6% in the March quarter 2010 following the GFC. Arguably the static level of Government investment is reflected in the bottlenecks in public infrastructure and the recent energy crisis in South Australia.
Our view
We reiterate our opening commentary that Australia’s regulators are reacting to the inherent risks associated with excessive household leverage and excessive speculation in residential property. Interest only loans are akin to Harvey Norman offers of “4 Years Interest Free!” and reminiscent of the teaser loans offered by US banks prior to the GFC. It is unfortunate that the policies being contemplated and the public concerns being expressed by regulators are being made after years of clear evidence that Australian house prices were being pushed higher by a range of factors, each of which could have been addressed individually in a co-ordinated national response.
While there are significant international macro issues that can affect the economic well-being of Australia, it is household leverage and the consequent exposures of Australian banks that has the greatest potential to affect investors.
There needs to be a clear national view as to whether higher house prices are good for the economy. It seems logical to think that housing costs make up a major part of the cost of living for a family. Substantial increases in housing prices that aren’t captured in the consumer price index create a divergence between household assets, debt and income. That rift is now clear to see, and it is worrying that house prices and related debt are growing at multiples of household income.
A logical market reaction for financial intermediaries is to respond by creating and promoting interest-only loans. This response holds the market together for a while, like it did in the US prior to the GFC. Then, at some point, market forces intervene to bring down house prices and debt is written off. The RBA, APRA and ASIC have every right to be concerned – but they are very late in the cycle.
Never miss an update
Enjoy this wire? Hit the ‘like’ button to let us know.
Stay up to date with my current content by
following me below and you’ll be notified every time I post a wire
The Clime Group is a respected and independent Australian Financial Services Company, which seeks to deliver excellent service and strong risk-adjusted total returns, closely aligned with the objectives of our clients.

5 topics
Clime Investment Management
Funds Management & Stock Research
Clime Investment Management
The Clime Group is a respected and independent Australian Financial Services Company, which seeks to deliver excellent service and strong risk-adjusted total returns, closely aligned with the objectives of our clients.
Expertise
Clime Investment Management
Funds Management & Stock Research
Clime Investment Management
The Clime Group is a respected and independent Australian Financial Services Company, which seeks to deliver excellent service and strong risk-adjusted total returns, closely aligned with the objectives of our clients.
Expertise
Comments
Comments
Sign In or Join Free to comment