SLOOS is saying something about US High Yield Credit
For those with a memory long enough to remember, it was about this time last year that almost everyone was talking about US high yield credit and the big blowout in credit spreads (which was largely caused by commodities). Since then the story has changed, as they say "if it's in the press it's in the price", in fact credit spreads have come in dramatically since then and are now trading around the bottom end of the range. The chart below shows this.
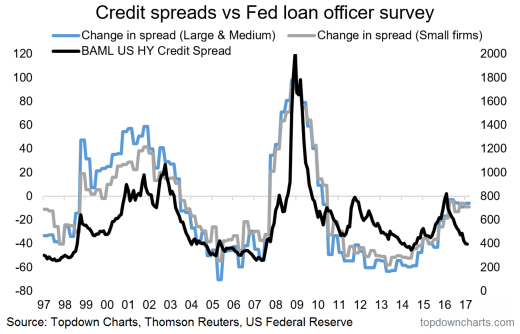
What the chart also shows, and part of what I talked about in the weekly report is that there is a strange disconnect between what banks are reporting and where High Yield Credit Spreads are. In the early 2000's and again just prior to the global financial crisis the Fed SLOOS (Senior Loan Officer Opinion Survey) data served as a leading indicator to the widening of credit spreads. So it leaves an important question - is this time different? The chart was featured in the latest Weekly Macro Themes: (VIEW LINK)
Never miss an update
Enjoy this wire? Hit the ‘like’ button to let us know.
Stay up to date with my current content by
following me below and you’ll be notified every time I post a wire
Callum is Head of Research at Topdown Charts.
Topdown Charts is a chart-driven macro research house covering global Asset Allocation and Economics.


Callum is Head of Research at Topdown Charts. Topdown Charts is a chart-driven macro research house covering global Asset Allocation and Economics.
Expertise
Callum is Head of Research at Topdown Charts. Topdown Charts is a chart-driven macro research house covering global Asset Allocation and Economics.
Expertise
Comments
Comments
Sign In or Join Free to comment
most popular
Investment Theme
If 24 LICs ran the Melbourne Cup, which ones would we back?
Affluence Funds Management