The Paradox of Passive. Beware of feedback loops
The rise of passive investing over the last decade has been remarkable, and the “active v passive” debate hasn’t abated, but the debate tends to focus on how much of the market is passively managed and less so on the capital flows i.e. who is buying the stock of companies and why? When stocks are being purchased without any thought to the underlying fundamentals of the company, this could create a risk to how markets operate.
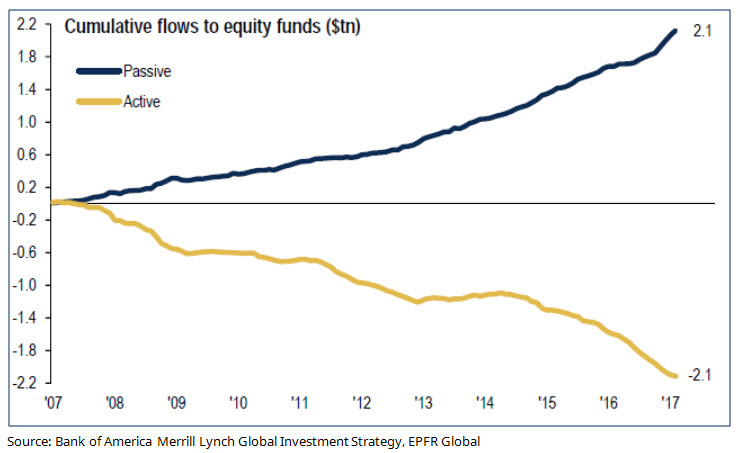
Since 2007, cumulative flows into passive equity vehicles (which ignores segregated institutional accounts) have been US$2.1 trillion. This has been offset by outflows from active vehicles of US$2.1 trillion. Passive exposure of the total market is already estimated to be circa 40% globally, and predicted to rise to as much as 60% over the next 5 years[1]. These numbers would be higher if we accounted for “quasi” passive flows from non-market cap based index type strategies (including “factor” portfolios).
In the first four months of this year (January to April 2017) passive equity flows were US$200 billion in US funds alone, against a US$70 billion outflow from active equity vehicles.
Chart 1: Passive vs Active Equity Flows
While there is clearly a benefit of low management costs that accrues to those using passive (or semi-passive) strategies, we question at what point the benefits of low management costs are outweighed by the causative effects of very large flows of capital being allocated with no reference to economic return. Much like Keynes’ Paradox of Thrift – that which is good for the individual may not be good for the whole, a similar effect applies to passive. In short, is there a Paradox of Passive that leaves investors with low management costs but in aggregate lower returns (or higher risks)?
As more and more capital is invested with no thought behind what is being purchased, there has to be a tipping point where this irrational behaviour is no longer sustainable.
When is that tipping point? We would suggest we are close to or even past the tipping point (in some markets).
While the case for passive investing rests largely on the fact that the management of a passive exposure is very cheap (the SPDR S&P500 ETF, the largest in the world, has an expense ratio of just 9 basis points, while the Vanguard total US market ETF is 4 basis points), investors in these strategies would do well to remember a number of salient points:
Value does not equal Price
Passive (and semi-passive) approaches are ignorant of value/price (and governance, capital management, etc.) – they invest on one criteria alone, that being the methodology for the construction of the index on which they are based, often market cap (or close to it). This creates a somewhat perverse outcome that the larger a company becomes, the greater the proportion of new money it receives. As such, the indices on which passive investments are made, or indeed any rules based approach, are prone to distortion.
We would note here that passive investing does not create the distortion in and of itself. If the index is an accurate reflection of market efficiency in capital allocation then passive flows to or from it don’t really distort that. However, if there is a distortion already or there are sufficient flows into a subsector of that index (e.g. a style or sector bias) then passive flows will amplify that distortion.
This process of correcting distortions is (generally) held in check by other non-passive (or active) investors, only to the extent those non-passive investors are influencing the price. That is not the case today with non-passive investors being large net sellers and passive investors being large net buyers. The distortions are complicated by non-market-cap based index investors biasing certain stocks.
Consider for example Amazon (AMZN), the markets consumer discretionary darling of the moment and the third largest stock in the S&P500 at 1.9%. The stock has risen 40% this year (vs S&P’s 17.7%). It has a market cap of US$475 billion, up from US$114 billion at the end of 2012.
It has a P/E ratio of over 200 times, has never paid a dividend, and made US$2.4 billion in profit on about US$135 billion of revenue (and apparently has a beta of 1.4). Its operating margin is 3.1% (and has never been above 5% in the last 10 years).
However, it sits in 176 ETFs and is a top 15 holding in 117 of those. These include:
- 12% - 18% in various retail and consumer discretionary sector ETF’s
- 7% in the iShares North American Tech ETF
- 6.4% in the iShares Morningstar Large Cap Growth ETF
- 5.7% in the iShares MSCI USA Momentum Factor ETF
- 2.3% in the Diamond Hill Valuation-weighted 500 Index ETF
- 1.9% in the Global Catholic Values ETF
The net result of this is that while the stock has a 1.9% market cap weight, the “size based weight” of all the ETFs in which Amazon is listed is 2.7%. So for every $1 of flow into these ETFs Amazon receives 150% of its market cap based weight of flow.
More importantly a look at the flows from the largest holders of the stock, based on filings in the US, shows that in the last 12 months:
- The founder, Jeff Bezos, has sold roughly US$2.2 billion worth of stock
- The top 5 active managers sold US$7.8 billion of stock
- The top 3 passive managers bought US$5.5 billion of stock
The risk here is that if passive flows continue at their current rate Amazon gets even more expensive, active managers underperform, passive flows get a further boost and we have a (not very) virtuous cycle.
It is flow not stock that counts
There has been some commentary recently around the point that passive exposures are still less than 50% of the total market and as such are not distortive (yet) to stock prices. Deutsche Bank estimated based on analysis of underlying share registries that passive ownership was nearer 22% in the US, not 40%, and much lower elsewhere in the world (albeit this probably doesn’t account for institutional passive ownership which is less likely to be via a fund or ETF). This is an interesting factoid, but not that relevant in looking for market distortions. A single large holding of a passive investor – be that an index fund, foundation, charity or whoever, does not influence price if they don’t trade.
It’s flows that cause prices to move, not “stock”.
To this end, while the ownership numbers of passive may still be low, the flows are anything but. If we look at the share registers of the top 15 stocks in the US, the dollar weighted trading volume of those stocks in the year to 31 March 2017 by grouping has been:
- “Owners” have been net sellers of US$5.5 billion (mostly Amazon and Microsoft)
- Active managers have been net sellers of US$1.1 billion; albeit if we exclude Apple that figure jumps to net sellers of US$8.4 billion (most of which is Amazon);
- Passive managers have been net buyers of US$54.1 billion
One method of analysing the distortions being created by passive and other rules based investment methods is to examine the weight of a stock in these indices and to compare it to its market cap weight.
To do this, we weight each component of the ETF by the aggregate dollar value in that ETF and compare the addition of all of these to the market cap weight. If the dollar weighted value of the ETF holdings is greater than the market cap weight then these passive strategies are collectively contributing to an overweighting in these stocks. We can examine this in terms of current invested dollars to gauge the impact of historical flows and in terms of recent flows. This is shown in the next chart.
Percentage of ETF Weight/Flow Received Relative to Market Cap Weight/Flow in 12 Months to 6th June 2017

As we can see, every stock in the top 10 S&P 500, has received a significantly greater proportion of passive flow than its market share in the S&P500 would suggest in the last 12 months and their aggregate weights in all the ETFs far exceed each stock’s market cap weight in the broad market index. E.g. the average dollar weighted value of Amazon in all ETFs adds up to 140% of its market cap weight – implying that the historical flows into these ETFs has been at a rate 40% greater than its market cap would justify. Similarly, in the last 12 months the dollar weighted value of the flows into Amazon has been 20% greater than its market cap would justify.
Total Portfolios Can’t be Passive
Virtually no investors have a total portfolio that is truly passive. While Warren Buffet’s estate might be largely passive in that inflows and outflows are dwarfed by the size of the corpus, the rest of us don’t really have that luxury. Cash flows in and out mean that almost all investors have an active approach to their overall investment strategy. While it can and often does make sense to acquire some components of that strategy as cheaply as possible, investors should have regard to the way these pieces fit together. This requires some understanding and management of the components. You wouldn’t want a car that was made entirely from the cheapest sourced components – it would be cheap, but probably wouldn’t run that well.
Investors need to be aware that as the proportion of passive investment grows, the rigor applied in terms of Governance and other issues is reduced.
How often do passive, or other rules based strategies, vote against management? It’s a question passive investors should consider, particularly where you now represent the largest holdings of these companies.
Percentage of the top 10 shareholders that are passive (based on filings as at 31st March 2017)

Conclusion
While we understand and generally concur with the desire to implement portfolios cheaply, investors should always be cognisant of what they are buying. It is our view that the flows into passive and quasi-passive vehicles are having a distortive effect on markets at the moment and this is prone (as always) to sudden reversals. Just as investors have jumped on the cheap bandwagon, the paradox of passive is that it could turn out to be an expensive mistake.
For further insights from Schroders, please visit our website
Never miss an update
Enjoy this wire? Hit the ‘like’ button to let us know.
Stay up to date with my current content by
following me below and you’ll be notified every time I post a wire
Established in 1961, Schroders in Australia is a wholly owned subsidiary of UK-listed Schroders plc. Based in Sydney, the business manages assets for institutional and wholesale clients across Australian equities, fixed income and multi-asset and global equities.
We believe in the potential to gain a competitive advantage from in-house global research; that rigorous research will translate into superior investment performance. We believe that internal analysis of investment securities and markets is paramount when identifying attractive investment opportunities. Proprietary research provides a key foundation of our investment process and our world-wide network of analysts is one of the most comprehensive in funds management.


Schroders
Established in 1961, Schroders in Australia is a wholly owned subsidiary of UK-listed Schroders plc. Based in Sydney, the business manages assets for institutional and wholesale clients across Australian equities, fixed income and multi-asset and...
Expertise
Schroders
Established in 1961, Schroders in Australia is a wholly owned subsidiary of UK-listed Schroders plc. Based in Sydney, the business manages assets for institutional and wholesale clients across Australian equities, fixed income and multi-asset and...
Expertise
Comments
Comments
Sign In or Join Free to comment
most popular
Education
How Warren Buffett has trounced “the world’s greatest hedge fund manager”
Leithner & Company Ltd