The yield trap of 2017

Daniel Mueller
Vertium Asset Management
Want to know the biggest yield trap of 2017? Each year there are dividend plays that turn out to be yield traps. In 2012, it was QBE. During 2012 to 2014, we saw several consumer stocks turn out to be yield traps including Seven West Media, David Jones and Myer. The year 2015 saw mining services stocks take an axe to their dividends including Monadelphous and WorleyParsons. In 2016, BHP’s progressive dividend policy was scuttled and Woolworths and Origin also cut dividends.
But, before moving on to 2017, you might ask, “what is a yield trap?”
A yield trap is a stock that looks to have an attractive dividend yield. It has usually paid a high dividend over previous years and investors often salivate over the prospect of the company maintaining its dividend in the coming years. Sometimes, in the face of weak share prices, the forecast yield looks juicy, sometimes 7%, 8% or higher, often fully franked.
But, unfortunately for income-seeking investors, these historic dividends turn out to be unsustainable.
In the case of most companies that cut their dividends, the yield trap is foreseeable. Most have weakening earnings and balance sheets that are spiralling out of control. With lower earnings unable to support balance sheet debt, dividends are cut to keep the unforgiving bankers at bay.
And 2017's biggest yield trap is...
Which leads us to the biggest yield trap of 2017, Telstra.
Since listing in 1997, Telstra has always been a strong, consistent and reliable dividend payer. This culminated in the company paying 31 cents per share fully franked dividend each of the last two years.
Due to its long history of steady dividends, the market was expecting another 31 cents per share in future years. And just prior to the FY17 results, Telstra was offering an enticing 7% fully franked dividend yield. However, it turned out to be an illusion, or nightmare, for yield chasers. At the FY17 results, the board slashed the dividend for FY18 to 22 cents per share.
But, hang on.
Telstra’s earnings are forecast to grow from 33 cents per share in FY17 to 34 cents per share in FY18. The company has a proud history of maintaining an A-rated balance sheet. It didn’t look like its dividend was at risk like the usual yield traps.
So why did Telstra cut its dividend?
To answer this, we need to examine what drives Telstra’s earnings.
Telstra is undergoing significant structural change as NBN nationalises its fixed-line network. Hence, Telstra will lose much of its fixed-line earnings by 2022 when the NBN migration completes. However, Telstra gets compensated somewhat by NBN recurring and NBN one-off payments. So in effect, Telstra has three earnings streams: NBN recurring, NBN one-offs and its core business.
1. NBN recurring
In FY17, Telstra received $420 million of recurring EBITDA from the NBN Definitive Agreement. This refers to payments NBN Co makes to Telstra for leasing Telstra’s ducts, racks and backhaul. Telstra management expects these payments to increase to just under $1 billion by the time NBN is rolled out and then rise in line with inflation.
If we proportionately allocate Telstra’s ‘ITDA’ (interest, tax, depreciation and amortisation) to these payments, we get 1.2 cents earnings per share in FY17. Using management’s guidance, recurring NBN payments should increase to 3.0 cents earnings per share by FY22.
So far so good. Let’s move on to the next earnings stream.
2. NBN one-offs
NBN one-offs refer to payments Telstra receives each time a customer switches from their network to NBN. In FY17, Telstra received $1,285 million of one-off EBITDA from the NBN Definitive Agreement. If we proportionately allocate Telstra’s ‘IT’ (interest and tax), we estimate these payments equated to 6.7 cents earnings per share in FY17.
Telstra management expects to receive another $4 billion of these payments over the next four years. This is fine for the next few years, but it results in an earnings hole once they start to dry up.
Ok, so this isn’t great, but NBN one-offs are only a small part of Telstra’s value. What about Telstra’s other sources of earnings?
3. Core business
By core, we mean everything else: mobiles, e-health, robot farming, the lot! It generated EBITDA of $8,974 million in FY17. For the next five years, most of Telstra’s divisions should be relatively stable. But, the big exception is fixed-line. Management has guided to a $3 billion per annum loss of fixed-line earnings. But this loss is net of the $1 billion per annum NBN recurring payments. Hence, the real earnings loss could be up to $4 billion per annum.
So, while the FY17 core earnings was 24.7 cents per share, we estimate a decrease to 18.8 cents per share in FY22 on the back of fixed-line earnings decline.
Telstra’s three earnings streams are summarised in the below table.
Table 1: Telstra’s earnings streams
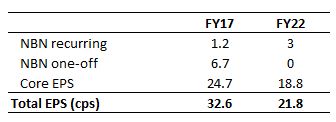
Note: 2022 estimates assume no change to competitive environment, additional cost savings and restructuring charges. Source: Telstra, Vertium
Was Telstra just being prudent?
Which brings us back to the question, why did Telstra cut its dividend?
From the above analysis, we can see Telstra’s FY17 underlying EPS (NBN recurring payments plus core earnings) was just 25.9 cents. This is well below reported EPS of 32.6 cents. Hence, the underlying payout ratio was 120% rather than the reported payout ratio of 95%. So, clearly the dividend was unsustainable from an underlying payout ratio.
How does this impact Telstra’s balance sheet?
Telstra could have continued to kick the can down the road by paying close to 100% of its reported EPS for the next few years. However, given the eventual fixed-line earnings loss, the balance sheet debt also needs to be reduced. Put simply, Telstra’s future earnings can’t support its current credit rating. Without a dividend cut, Telstra’s currently strong balance sheet might come to resemble the stretched balance sheet of its yield-trap peers. Specifically, Telstra would not maintain its healthy net debt / EBITDA ratio, which would move above management’s stated comfort zone of 1.3 – 1.8x.
The chart below outlines various scenarios under different dividend payout ratios.
Chart 1: FY22 net debt / EBITDA
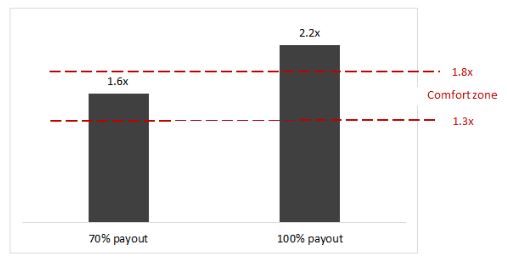
Source: Telstra, Vertium
Rather than waiting, Telstra took its medicine. Or, rather its shareholders were forced to. Its board reduced the dividend payout ratio from close to 100% to a range of 70 – 90%.
A prudent decision… for now.
2022 déjà vu
Surely the FY18 dividend of 22 cents per share is the new sustainable level?
Let’s fast forward to 2022. NBN one-offs have ended and the core business has lost much of the fixed-line earnings. Partly mitigating the losses is NBN recurring payments of $1 billion per annum. Net-net, EPS is estimated to be around 22 cents per share. Based on Telstra’s new dividend payout policy of 70 – 90% of earnings, the dividend is cut again, this time to under 20 cents per share.
The dividend cut of 2017 wasn’t enough and Telstra is a candidate for the yield trap of 2022!
Never miss an update
Enjoy this wire? Hit the ‘like’ button to let us know.
Stay up to date with my current content by
following me below and you’ll be notified every time I post a wire
Daniel joined Vertium Asset Management in 2017 as a Portfolio Manager / Equity Analyst and brings with him nearly 15 years’ Australian equity investment management experience. At Vertium, Daniel assists the CIO and is responsible for researching and analysing Australian companies.
Prior to Vertium, Daniel was a Senior Equities Analyst / Portfolio Manager at Forager Funds where he was responsible for assisting with Forager’s Australian equities portfolio.
Before Forager, Daniel held similar roles at Morningstar, Northward Capital, Investors Mutual, Cannae Capital and MMC Asset Management.

10 topics
1 stock mentioned
Daniel Mueller
Vertium Asset Management
Daniel joined Vertium Asset Management in 2017 as a Portfolio Manager / Equity Analyst and brings with him nearly 15 years’ Australian equity investment management experience. At Vertium, Daniel assists the CIO and is responsible for researching...
Expertise
Daniel Mueller
Vertium Asset Management
Daniel joined Vertium Asset Management in 2017 as a Portfolio Manager / Equity Analyst and brings with him nearly 15 years’ Australian equity investment management experience. At Vertium, Daniel assists the CIO and is responsible for researching...
Expertise
Comments
Comments
Sign In or Join Free to comment
most popular
Equities
The Magnificent Seven can’t carry the market forever
Pzena Investment Management