US-Iran sabre rattling boosts Woodside Energy and Santos share prices - but how high can they go?
Woodside and Santos are rallying on rising Mid-East tensions and crude, but after months of underperforming the ASX 200, can this continue?
Crude oil prices have risen sharply in the last 24 hours as geopolitical tensions in the Middle East intensified ahead of a critical deadline set by the United States for Iran to accept a revised nuclear deal.
The escalation follows a sixty-day ultimatum issued by President Trump, which expires tomorrow, and coincides with Israel's renewed calls for Washington to take direct action against Tehran’s uranium enrichment activities.
In addition to the imminent deadline, markets were further spooked by an order for the limited withdrawal of diplomatic personnel from Iraq, Bahrain and Kuwait – a move historically consistent with increased credible security threats or impending US military action.
Iranian officials have responded with combative warnings, explicitly threatening US bases and military assets across the region. The situation is compounded by revelations from the International Atomic Energy Agency (IAEA) that Iran’s stockpile of 60% enriched uranium has surged by 50% since February – enough to produce material for up to ten nuclear weapons with further refinement.
%20ICE%20chart%2012%20June%202025.png)
As a result, the price of Brent crude, the global oil benchmark, has jumped higher. Traders often favour Brent in times of Middle Eastern unrest due to its direct relevance to the seaborne oil trade and its pricing foundation in the North Sea, a politically stable zone.
Unlike West Texas Intermediate (WTI), which reflects US onshore supply conditions, Brent reacts more sensitively to global supply shocks and shipping risks in the Strait of Hormuz – through which a fifth of the world’s oil passes.
Bringing it back to the ASX, local energy giants Woodside Energy (ASX: WDS) and Santos (ASX: STO) are both trading higher today, supported by the rally in crude. However, their longer-term share price trajectories tell a different story. Over the past 12 to 18 months, both stocks have underperformed the broader ASX 200 Index.
Yet – as can be seen in the charts below, both have staged somewhat of a comeback since their April lows (as have most ASX stocks!). To better understand their prospects moving forward, let’s perform a quick fundamentals, technicals, and broker consensus check up on these two premier ASX energy stocks.
Woodside Energy (WDS) – Quick Take
Key factors driving WDS's 12–18-month underperformance
- Dilution risk and debt: Concerns over capital discipline following the BHP Petroleum merger and new LNG project outlays.
- LNG market exposure: A softening in Asian LNG prices due to warmer weather and oversupply.
- Regulatory pressures: Delays and challenges surrounding new developments, including Scarborough and Browse.
Earnings Trends
%20-%20Price%20vs%20Earnings%20Per%20Share%20(EPS).png)
Not surprisingly, WDS’s short and long term price action matches its earnings trends. According to GuruFocus consensus estimates, WDS’s earnings per share (EPS) is expected to fall to $1.51 this financial year (FY25), then further to $0.96 in FY26, before rebounding to $1.57 in FY27.
Technical Analysis
%20chart%2012%20June%202025.png)
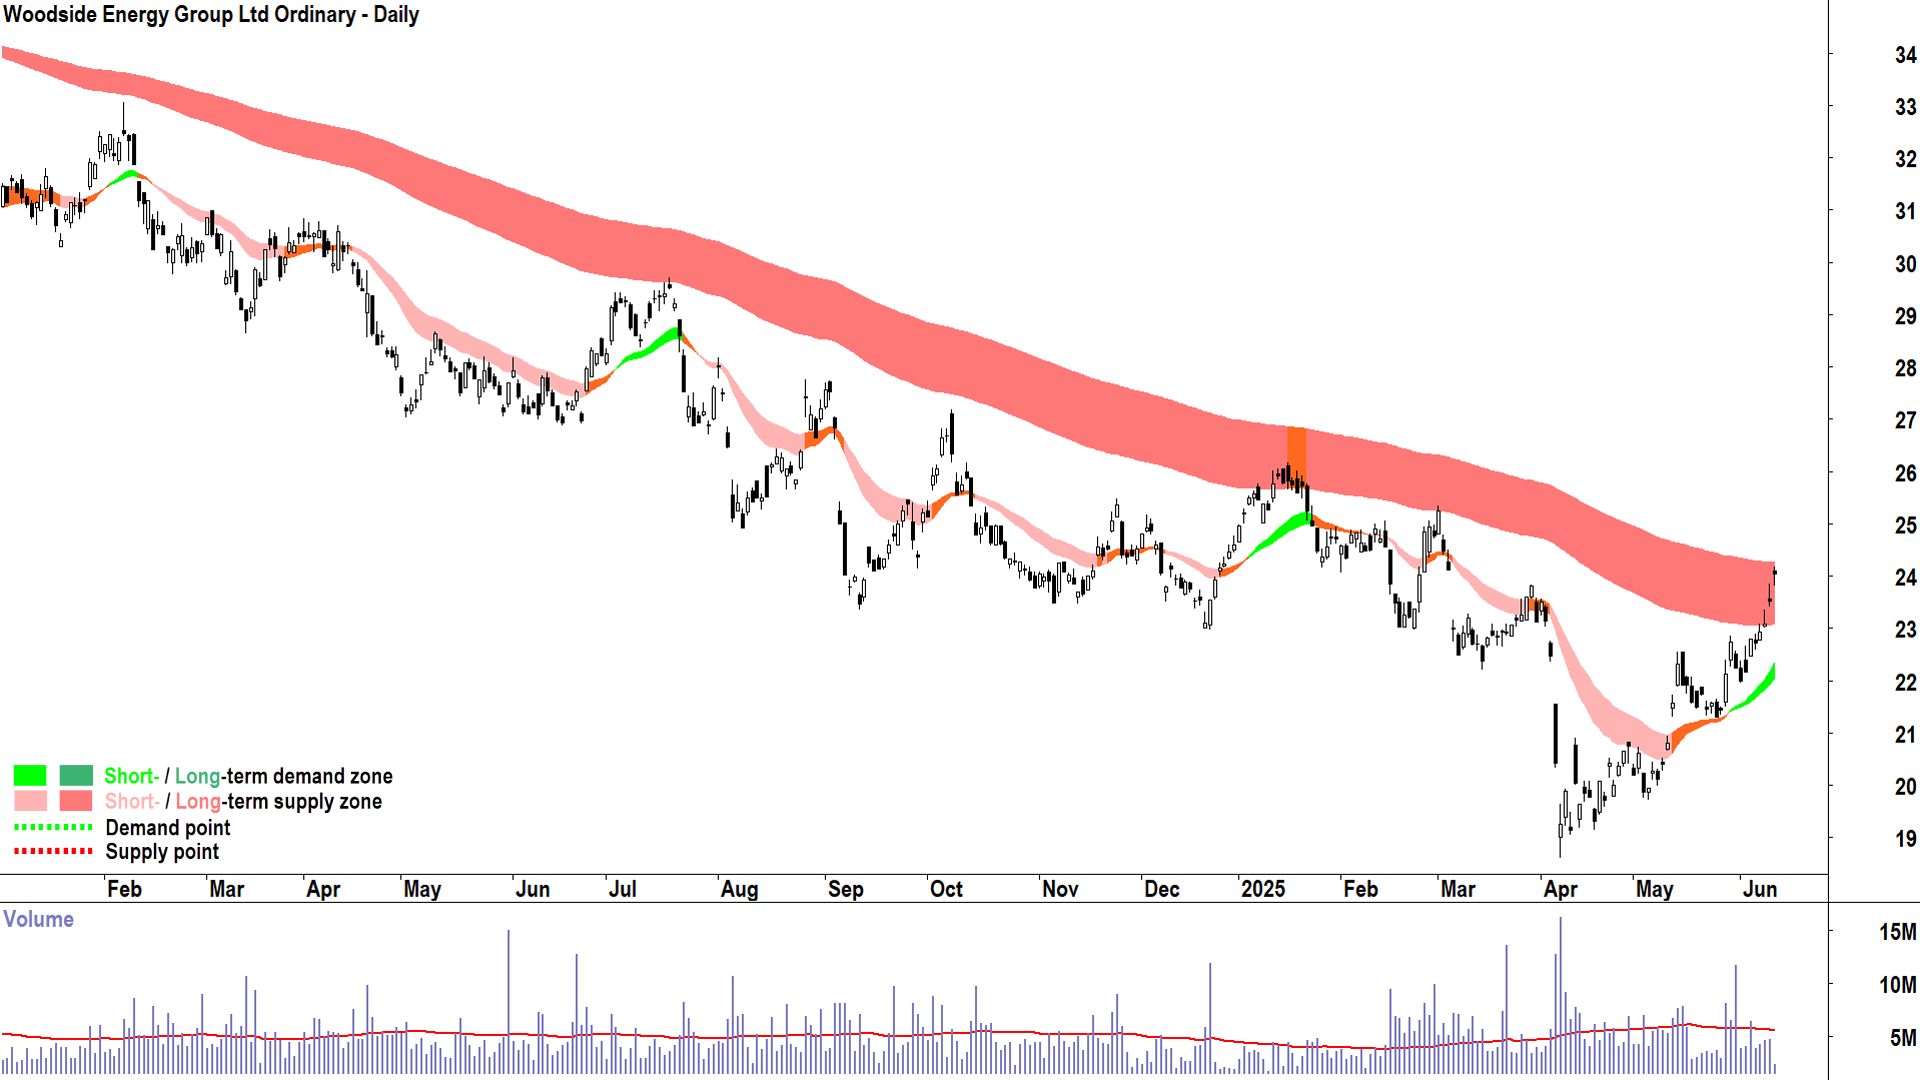
With respect to WDS’s technical analysis factors, I note:
- The short term trend is up, the long term trend is down
- The short term uptrend ribbon is acting as a zone of dynamic demand, but the long term downtrend ribbon has acted as a reliable zone of dynamic supply – WDS is presently trading in the long term trend ribbon
- The price action is rising peaks and rising troughs
- The candles are predominantly demand-side in nature in the short term, but predominantly supply-side in nature in the long term
The WDS technicals imply a neutral trend bias as the strong short term uptrend is counterbalanced by the well-established long term downtrend. If the price can trade above the long term trend ribbon and then demonstrate that it’s no longer acting as a zone of dynamic supply, but is rather as a zone of dynamic demand – then WDS would have ended its long term downtrend and could potentially be commencing a new long term uptrend.
As long as the WDS price does not close below the short term uptrend ribbon, the current short term uptrend remains intact and has a decent chance of transitioning the long term trend to at least neutral. Continued strong price action and candles will improve the likelihood of a subsequent transition to up.
Alternatively, a close below the short term trend ribbon would likely indicate a continuation of the prevailing long term downtrend. (Conclusion: From a technical perspective it’s make or break time for WDS!)
Broker Consensus
%20Broker%20Consensus%2012%20June%202025.png)
To obtain a Broker Consensus Rating, we assign a Rating Value of +1 to any broker rating better than HOLD/NEUTRAL/MARKETWEIGHT; a Rating Value of 0 for any broker rating equivalent to HOLD/NEUTRAL/MARKETWEIGHT; and a Rating Value of -1 to any broker rating worse than HOLD/NEUTRAL/MARKETWEIGHT.
We then take the average of all Rating Values and assign a Broker Consensus Rating of BUY to values +0.5 or above; a Broker Consensus Rating of HOLD for values between -0.5 and +0.5; and a Broker Consensus Rating of SELL for values -0.5 or below.
The Broker Consensus Target is simply the average of the target prices we have on file for each broker. Typically, brokers define their target price as a 12-month forecast, and each target price is based on a broker’s fundamental valuation assumptions. We have only assessed broker ratings and target prices within the last 3 months to account for recent relevance.
WDS’s average Rating Value is +0.50, resulting in a Broker Consensus Rating of BUY. WDS’s Broker Consensus Target is $25.45, this suggests brokers collectively believe the stock is around 8.2% undervalued based upon a last price of $23.52.
Santos (STO) – Quick Take
Key factors driving STO's 12–18-month underperformance
- Narrower production base: Heavier dependence on domestic gas contracts, less leverage to global oil price upside.
- Barossa controversy: Environmental and regulatory setbacks delaying the high-profile Barossa gas project.
- M&A fatigue: Investor unease with Santos’ attempted merger activity, notably the failed Oil Search combination and speculation over further consolidation.
Earnings Trends
%20-%20Price%20vs%20Earnings%20Per%20Share%20(EPS).png)
Again, STO’s short and long term price action matches its earnings trends. According to GuruFocus consensus estimates, STO’s EPS is expected to fall to $0.51 this financial year (FY25) but then rebound to $0.63 in FY26, and then to $0.69 in FY27.
Technical Analysis
%20chart%2012%20June%202025.png)
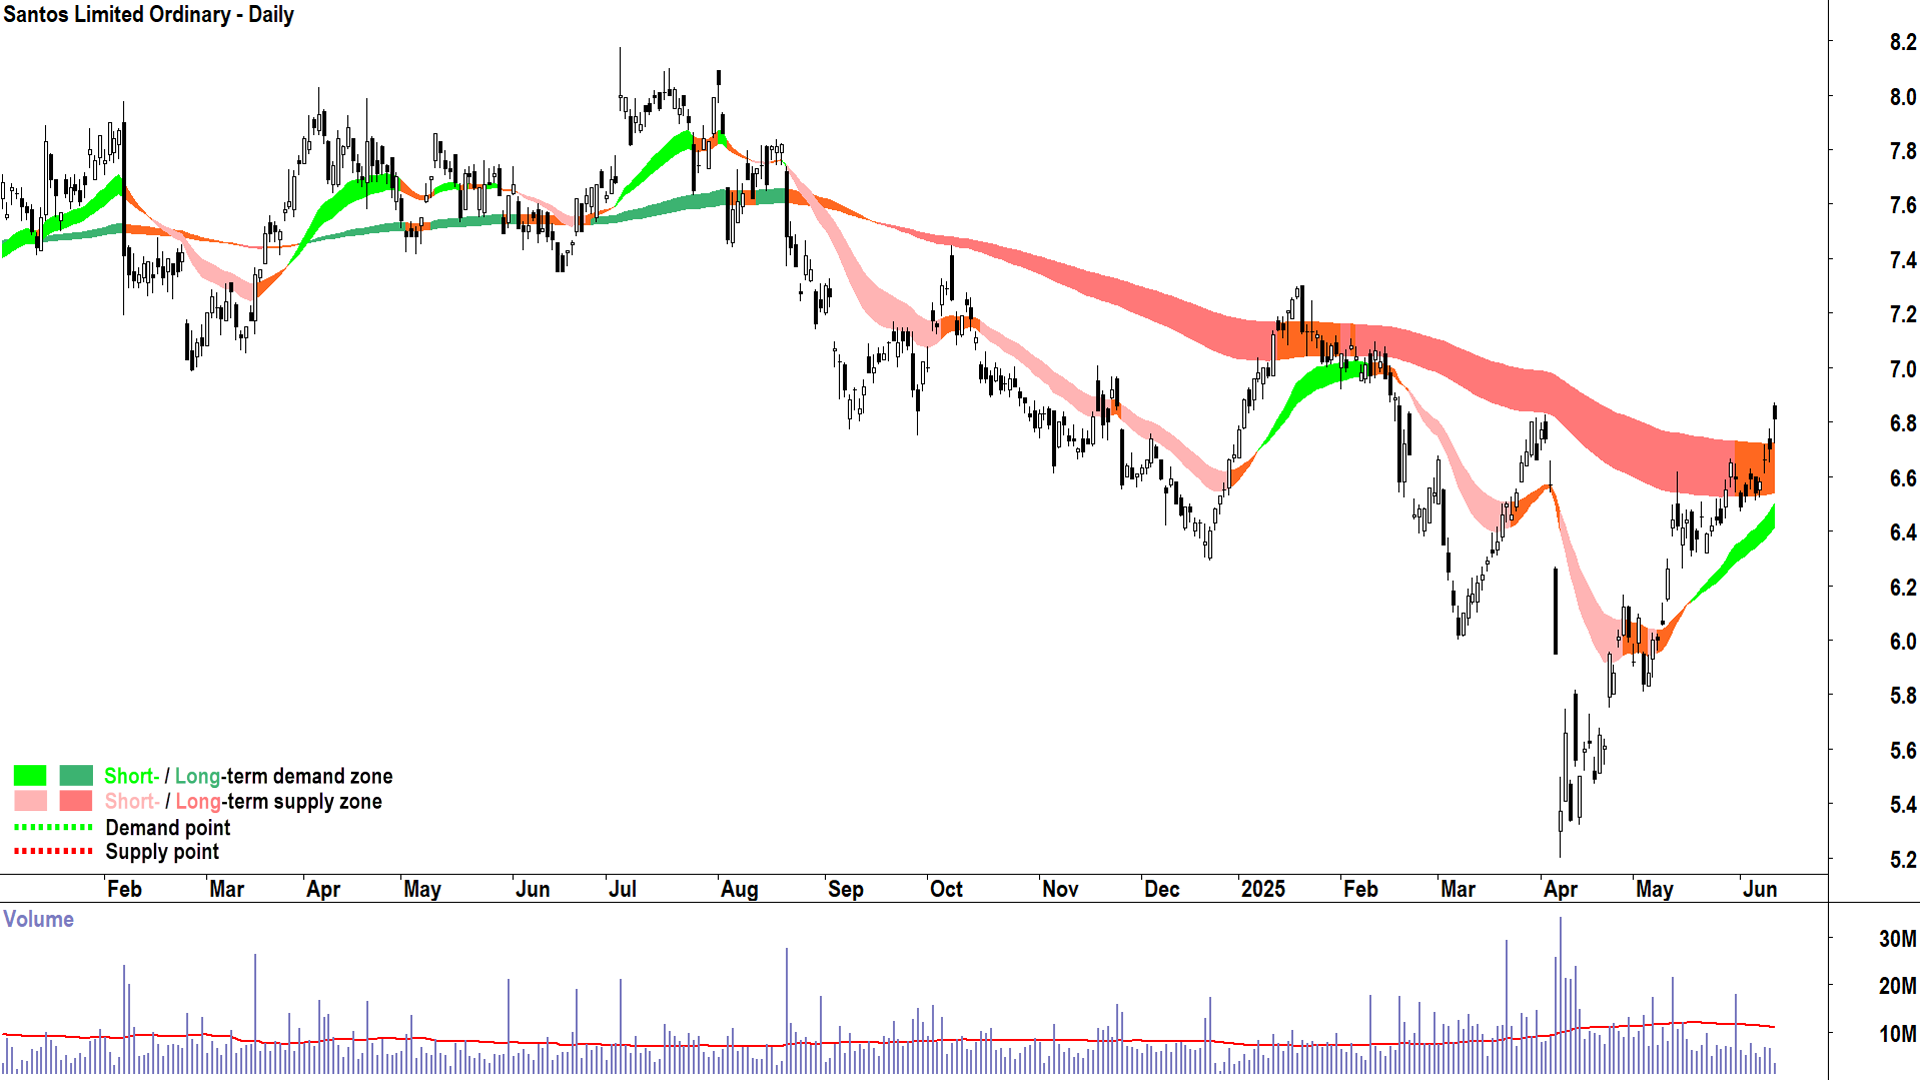
With respect to STO’s technical analysis factors, I note:
- The short term trend is up, the long term trend is neutral
- The short term uptrend ribbon is acting as a zone of dynamic demand, but the long term downtrend ribbon has acted as a reliable zone of dynamic supply – on a positive note, though STO is trading above the long term trend ribbon today for the first time since 20-Jan
- The price action is rising peaks and rising troughs
- The candles are predominantly demand-side in nature in the short term, but mixed in nature in the long term
The STO technicals imply a neutral-but-improving trend bias as the strong short term uptrend is counterbalanced by the neutral long term trend. If the price can continue to trade above the long term trend ribbon and then demonstrate that it’s no longer acting as a zone of dynamic supply, but is rather as a zone of dynamic demand – then STO would have ended its long term downtrend and will be commencing a new long term uptrend.
As long as the STO price does not close below the short term uptrend ribbon, the current short term uptrend remains intact and has a decent chance of transitioning the long term trend to up. Continued strong price action and candles will improve the likelihood of this transition.
Alternatively, a close below the short term trend ribbon would likely indicate a resumption of the prior long term downtrend. (Conclusion: From a technical perspective it’s make or break time for STO too!)
Broker Consensus
%20Broker%20Consensus%2012%20June%202025.png)
STO’s average Rating Value is +0.88, resulting in a Broker Consensus Rating of BUY. STO’s Broker Consensus Target is $7.47, this suggests brokers collectively believe the stock is around 11.5% undervalued based upon a last price of $6.70.
Conclusion – What to watch
Looking ahead, market attention will focus tightly on Thursday’s deadline and any signs of US or Iranian escalation. The situation is dynamic, and so too is the oil price. History shows that during periods of conflict, Brent crude can spike dramatically:
- Approx. 20% following the 2019 attacks on Saudi Arabia’s Abqaiq facility
- Over 25% during the lead-up to the 2003 invasion of Iraq
- Over 40% at the onset of Russia’s invasion of Ukraine in February 2022
With geopolitical risk premia building once again, oil remains the market’s most sensitive barometer of global instability. If we do get another flare up in the Middle East, then both WDS and STO could be set to extend their recent recovery.
Want more information on the terms used in Carl's technical analysis? Then check out his Technical analysis for beginners: ChartWatch Primer.
This article first appeared on Market Index on 12 June 2025.
Never miss an update
Enjoy this wire? Hit the ‘like’ button to let us know.
Stay up to date with my current content by
following me below and you’ll be notified every time I post a wire
Carl has over 30-years investing experience and has helped investors navigate several bull and bear markets over this time. He is a well respected markets commentator who specialises in how the global macro impacts Australian and US equities. Carl has a passion for technical analysis and has taught his unique brand of price-action trend following to thousands of Aussie investors.
........
Investing is risky. Inevitably you will endure losses. If you can't cope with losing, don't invest.

%20chart%2012%20June%202025.png)
%20chart%2012%20June%202025.png)
5 topics
4 stocks mentioned

Carl has over 30-years investing experience and has helped investors navigate several bull and bear markets over this time. He is a well respected markets commentator who specialises in how the global macro impacts Australian and US equities. Carl...
Carl has over 30-years investing experience and has helped investors navigate several bull and bear markets over this time. He is a well respected markets commentator who specialises in how the global macro impacts Australian and US equities. Carl...
Comments
Comments
Sign In or Join Free to comment