We bought the dip - now what?
The market is full of self-proclaimed experts that ‘saw’ the event before it happened and of course were positioned perfectly for it. The recent market blip was simply another example of a well-trodden path for the talking heads within the investment world. Let’s be frank, we all have a bias of talking our own book, our own philosophy and highlighting where we got things right, more so than where we got things wrong. It’s simply human nature and at Market Matters where certainly not immune from such a folly. That said, we did buy into the recent market weakness fairly aggressively and now as we sit more or less fully invested within our portfolio we’re now rightly pondering – what next for equities and when should we look to reduce our exposures? Here's our thoughts.
- Short-term – We are net bullish global equities targeting fresh all-time highs by many indices over the coming 1-2 months. We can easily see the ASX200 challenge the 6250 area minimum in March / April.
- Medium-term – We still believe a greater than 20% correction will commence this year for global stocks.
Our current plan remains to significantly increase our cash levels into market strength ideally around 6250, or higher for the ASX200. In our opinion “One of the keys to successful investing during 2018/9 will be being prepared to sell” – most investors weakest quality.
At this stage we believe US stocks in particular experienced a washout of weak longs and over committed short-volatility players but the major positions founded on value / economic optimism remain intact, we must maintain vigilance to evaluate when the interest rate “uncle” point is reached – historically bull markets are ended by Central Banks raising interest rates to fight inflation and then a recession usually follows. Investors should simply not forget we are potentially in the final stages of the second longest bull market in history.
The recovery by US stocks has been assisted by substantial buybacks from the likes of APPLE, Cisco and Mastercard with the fuel for the buying coming from the repatriation of profits from the US following Donald Trump’s Tax Package. Goldman Sachs estimates that the cash returned to shareholders from buybacks and dividends in 2018 will grow by $US1 trillion – what a perfect recipe for a stock market blow-off top!
Today we’ll bore into how we see local stocks moving over the next 8-weeks, into the dangerous “sell in May and go away” period.
1 Seasonality / Statistics
Assuming we are correct with our above mentioned view for stocks and they are headed higher over March / April, its time to extrapolate some fresh numbers to generate targets to help identify the optimum time to start reducing our stock market exposure, and potentially go short via ETF’s.
As we all know US stocks often provide the music to which global stocks dance, hence we ask how did they fare during the March / April period over the last 20-years:
- The average return for March / April is +2.7%, assuming February ended on Friday, not next Wednesday, that would extrapolate to 2820 for the S&P500, below our 3000 target area.
- However the numbers get far more exciting / bullish after a weak February, following a decline of 2.5% or more by US stocks the average return over March / April increases significantly to +4.7% - the S&P500 is currently down -2.7% this month.
- Hence if we extrapolate the numbers following a weak February the S&P500 target rises to 2876 i.e. fresh all-time highs but again below our preferred psychological 3000 area.
Now moving onto the ASX200.
When the ASX200 falls / drifts in January, like this year, the quarterly low occurs 80% of the time in the first 5-10 calendar days of February - we believe this occurred perfectly on the 9th at 5786.
- The average rally from the Q1 low into the April / May danger time is a huge 512-points / 10.7%.
- Assuming that we have seen the low for Q1 that extrapolates to a target of ~6300 taking the more conservative of the above 2 statistics.
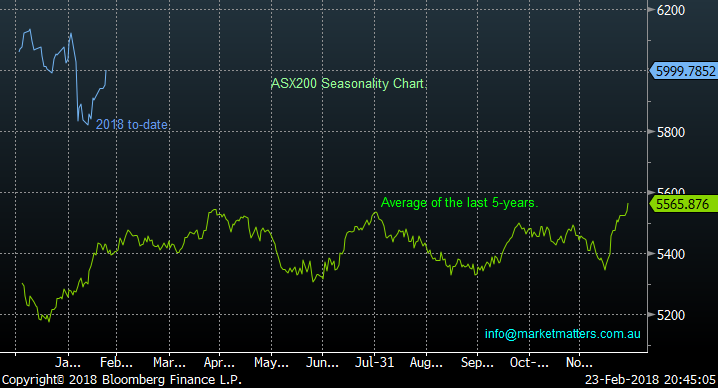
- Historically the top usually kicks in between mid-April and early May as the below seasonal chart illustrates perfectly.
With the ASX200 struggling to meaningfully break over 6000 since the GFC it’s pretty hard to comprehend the market soaring up towards 6300 but as we regularly say “investors must remain open-minded”.
ASX200 Seasonality Chart
For the ASX200 to rally in a major way over the coming months we need to see our “Big 4” banking stocks regain their mojo and claw back some / all of their significant losses of the last month i.e. our Banking Index is down almost -7% since the 10th of January. However, seasonally this is a very bullish time for our banks who did finally start to outperform last week.
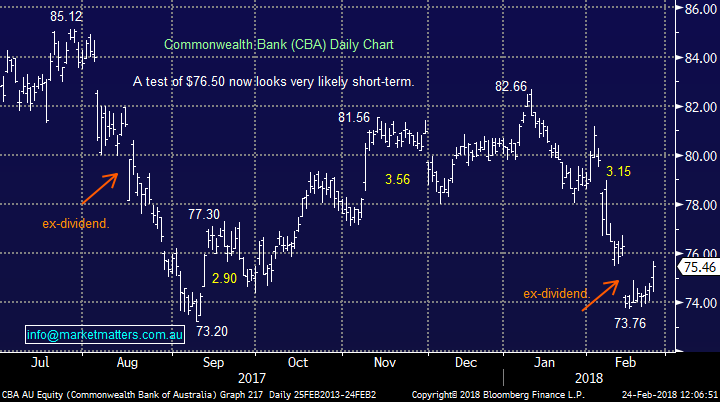
- Over the last 10-years CBA has rallied on average over +6.5% over March / April, with March being noticeably almost twice as strong as April.
- When we look at the other big 3 banks the average gain is on average actually higher, this makes sense as yield hungry investors start eyeing the looming dividend bonanza due in May.
Suddenly if we believe the “big 4” banks can rally say just +6% over the next 2-months then a 5% rally in the ASX200 towards 6300 becomes fairly easy to comprehend.
Summary – wherever we look from a seasonal / statistical perspective the numbers support our bullish view targeting 6250-6300 by the ASX200 in the next 2-months.
Commonwealth Bank (CBA) Daily Chart
2 Overseas Indices
No change, when we stand back and look at some major international indexes on a weekly basis they look very constructive for a rally into a potentially very important April / May top:
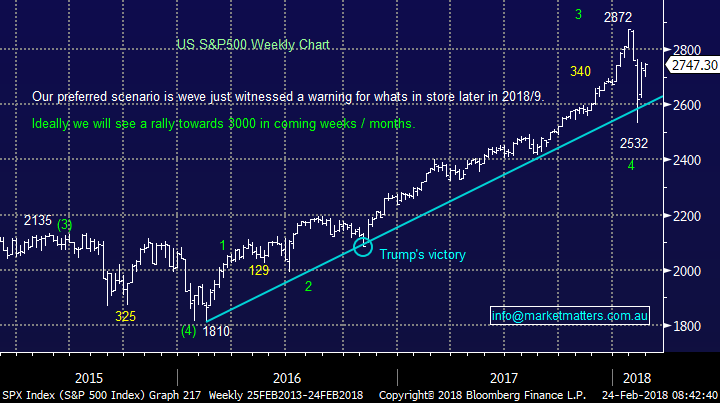
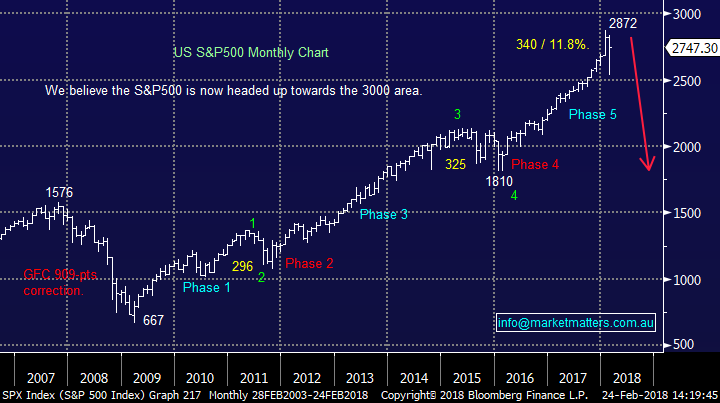
- The US S&P500 looks very constructive for a rally towards 3000 although the statistics currently suggest 2900 may terminate the advance.
- The US NASDAQ corrected over 12% very quickly but it’s regained over 85% of the losses, to be less than 2% below its all-time high, if it can just consolidate around current levels it will look primed for a move to fresh all-time highs.
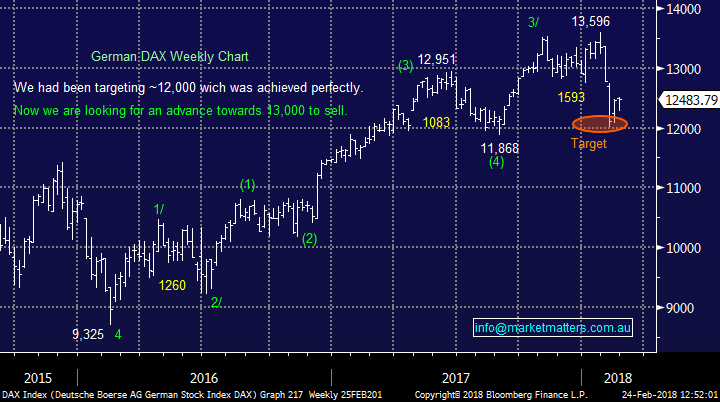
- The German DAX has been one of our favourite charts over recent months and although its recovery has been fairly muted compared to the US it’s still targeting a ~10% rally from Fridays close.
US S&P500 Weekly Chart
German DAX Weekly Chart
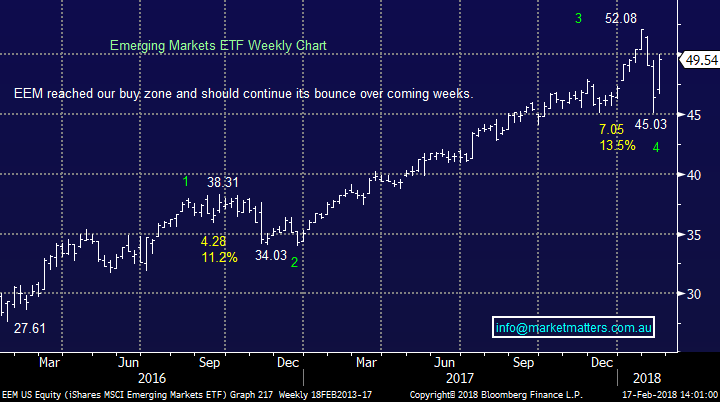
As MM subscribers know we watch the Emerging Markets (EEM) closely for 2 reasons at present, firstly they are highly correlated to our resources sector, and secondly because they have followed our technical path perfectly over the last 18-moinths.
- The EEM is targeting further gains of close to 10% which is very encouraging for our decent resources exposure – BHP has rallied over +5% since its panic sell-off, even after a disappointing result i.e. Fund Managers still like the sector!
Emerging Markets (EEM) Weekly Chart
3 Interest rates / bond yields
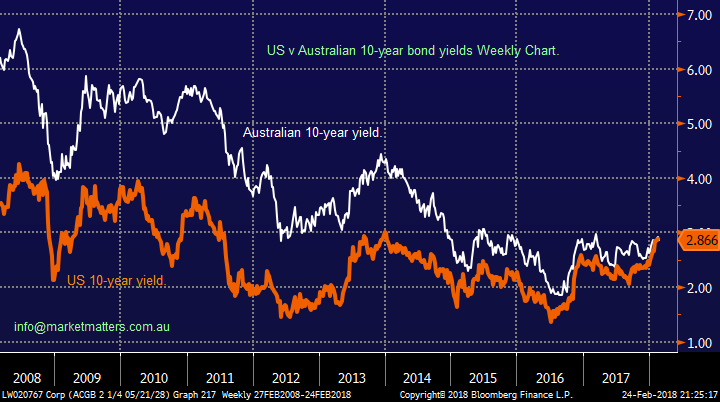
Last week US 10-year bond yields closed above our own, not something that we have really witnessed in a meaningful way for many years. The main takeout on this for us is that it illustrates our economy is not firing as strongly as the US.
If the US bonds are going to yield above our own and their economy is perceived to be safer than our own its hard not to see the “little Aussie battler” trade lower. With our target well under 70c – a big win for US earning companies.
Australian v US 10-year Bond Yields Weekly Chart
At MM we love to read, something we have in common with Warren Buffett, as we continually look for light bulb moments whether it be on a macro, or company basis (please note – we do not think we are, nor do we try to be Warren Buffet!!).
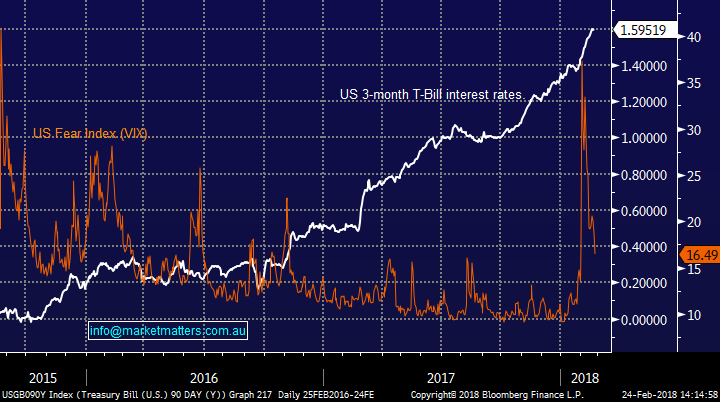
A leading correlation that we picked up on last Saturday for our Weekend Report which goes back a few decades was that between the Volatility Index (VIX) and the US 3-month T-Bill yields, as the VIX is inversely correlated to stocks this amounts to a correlation between US short-term interest rates and stocks. This makes sense because as interest rates rise they suck money from stocks as term deposits become an increasingly more attractive form of investment on a relative basis.
– Stocks regularly correct around 2-years after US T-Bills kick higher.
– In this case US rates kicked up in late 2015 and just over 2-years later volatility goes crazy and stocks plunge.
– Beware what comes next as rates significantly accelerate higher from September 2016 implying stocks will struggle again later in the year.
Basically this observation supports our long-term view that stocks will experience a +20% correction that should start in 2018.
US 3-month T-Bill v VIX Index Daily Chart
US S&P500 Monthly Chart
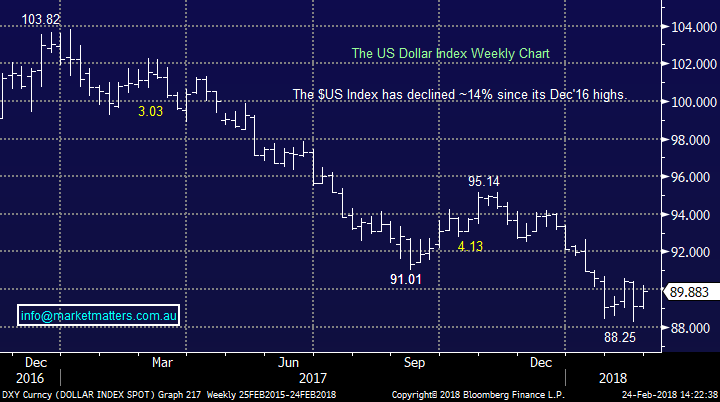
4 The $US
We’ve maintained our view on the $US which was the cornerstone of the MM Outlook piece for 2018.
No change, we are looking for a decent swing low in the $US, ideally just under 88, but its close!
The $US is close to a bottom which is likely to be bad news for the reflation trade i.e. resources.
NB The low may already be in place.
$US Index weekly Chart
Conclusion
On balance we still believe that stocks have found a short-term low that should be followed by a rally to fresh all-time highs by many indices.
However, we still believe that a +20% correction will unfold over 2018/9 and we must now give a revised 15% weighting to the possibility that the correction has already commenced i.e. take nothing for granted over coming weeks.
Have a great night
James & the Market Matters Team
The above is an extract from the Market Matters Weekend Report. For a free 14 day trial of our service CLICK HERE
Never miss an update
Enjoy this wire? Hit the ‘like’ button to let us know.
Stay up to date with my current content by
following me below and you’ll be notified every time I post a wire
James is the Lead Portfolio Manager & primary author at Market Matters, a digital advice & investment platform with over 2500 members that offers real market intel & portfolios open for investment. He is also a Senior Portfolio Manager at Shaw and Partners heading up a team that manages direct domestic and international equity & fixed-income portfolios for wholesale investors.

1 stock mentioned

James is the Lead Portfolio Manager & primary author at Market Matters, a digital advice & investment platform with over 2500 members that offers real market intel & portfolios open for investment. He is also a Senior Portfolio Manager at Shaw and...
Expertise
James is the Lead Portfolio Manager & primary author at Market Matters, a digital advice & investment platform with over 2500 members that offers real market intel & portfolios open for investment. He is also a Senior Portfolio Manager at Shaw and...
Expertise
Comments
Comments
Sign In or Join Free to comment