What do low return forecasts mean for funds?
The more realistic the view of what may lie ahead, the better the decisions we’ll make to prepare for it. Let’s consider our current forecasts. Our forecast methodology has been calibrated to capture both underlying structural trends and cyclical valuations. We compress these into a 3-year timeframe and express risk in probability of loss terms – a more meaningful risk metric than volatility.
Our current forecasts for broad asset class returns and risk are shown in figure 1:
Figure 1: 3 Year Return and Risk Forecasts (As at March 2017)

There are several key points to note from this:
- Overall returns are both relatively low (all less than 8% pa) and relatively compressed (mostly between 2% and 6% p.a. give or take). They are neither pessimistic nor optimistic but rather (in our view) realistic
- Projected returns from bonds and bond proxies (like A-REIT’s) remain particularly low, albeit slightly improved in the case of US and Australian government bonds
- The key US equity market offers investors limited return in absolute terms and not much different to that offered by US government bonds (where’s the risk premium?)
Implications:
If we are right (granted a big assumption but not inconsistent with other return forecasters), then the implication for typical balanced type portfolios (i.e. 60/40 or 70/30) over the medium term is problematic.
For example, multiplying our 3 year return forecasts by the typical Strategic Asset Allocation (SAA) effectively locks in a relatively low return (probably in the order of 5% nominal or 2.5% real) or about half what investors expect but with significant expected volatility (around 8% pa). There is downside risk to this number too given the combination of a high projected return from Australian equities (close to 8% p.a.) and the relatively high weight in a typical Australian balanced fund to Australian equities. If we are right on US equities then Australian equities may struggle more than we project in the short run given the heightened correlation of risk assets in stressed environments.
In figure 2 (below) we extend this analysis by tracking the projected returns of a fixed SAA portfolio (70/30) utilising our projected returns through time. This provides some basis (and confidence) that our return methodology gives us reasonable guidance as to returns over time. We have been using this methodology since the mid 2000’s and it has not been recast or retro-fitted. We have compared this to the actual 3 year returns from the Schroder Balanced Fund (SBF) over this time.
Figure 2: Schroder Balanced Fund (Actual Returns vs Projected Returns using our framework)
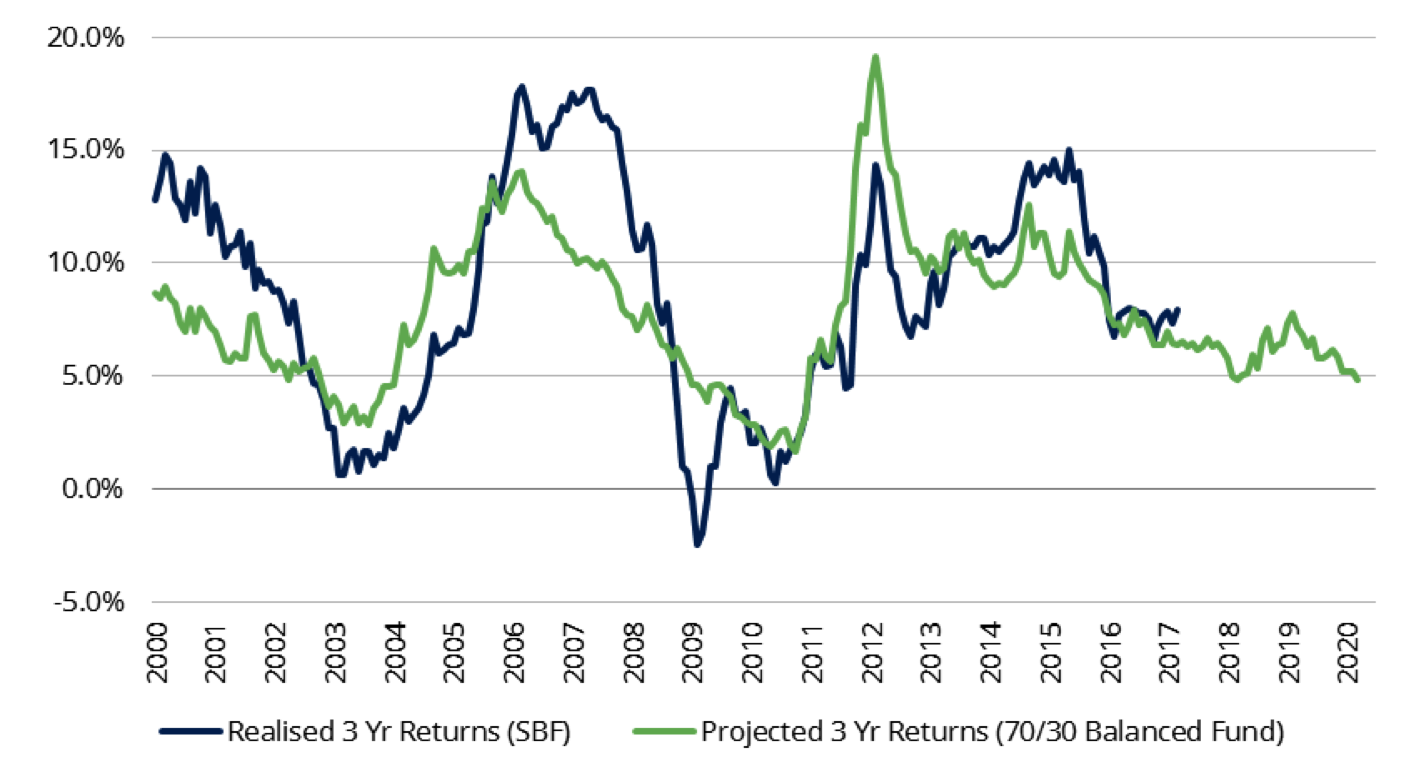
Source: Schroders
This analysis shows that our return forecasts (while not perfect) provide a reasonable guide to future returns over a rolling 3 year timeframe. As noted above this suggests we should expect nominal returns of around 5% pa over the next 3 years (2.5% real).
We also note that with the risk premium low and the likelihood of a rebuild in the risk premium high, significant downside / drawdown risk is likely.
Will Tactical Asset Allocation (TAA) make a difference?
An important consequence of the relatively fixed SAA structure of a balanced fund is that there is little even an aggressive SAA (maximising the use of the ranges) can do about this. This is because of the relatively narrow range of projected returns and the limited flexibility provided by narrow TAA ranges (+/- 10 or 15%). Adopting either an aggressive stance (taking growth asset exposure to its maximum), or a more defensive stance (significantly reducing risk) has only moderate impact on returns, albeit with a bigger impact on risk.
Figure 3 demonstrates this in the context of the SBF. Here we compare the SBF’s current asset allocation (57% Growth Assets, 28% Defensive Assets and 15% Diversifiers and Alternatives) with a maximum growth (70% Growth Asset) and maximum defensive (40% Growth Asset).
Figure 3: Implications of our return forecasts on the Schroder Balanced Fund
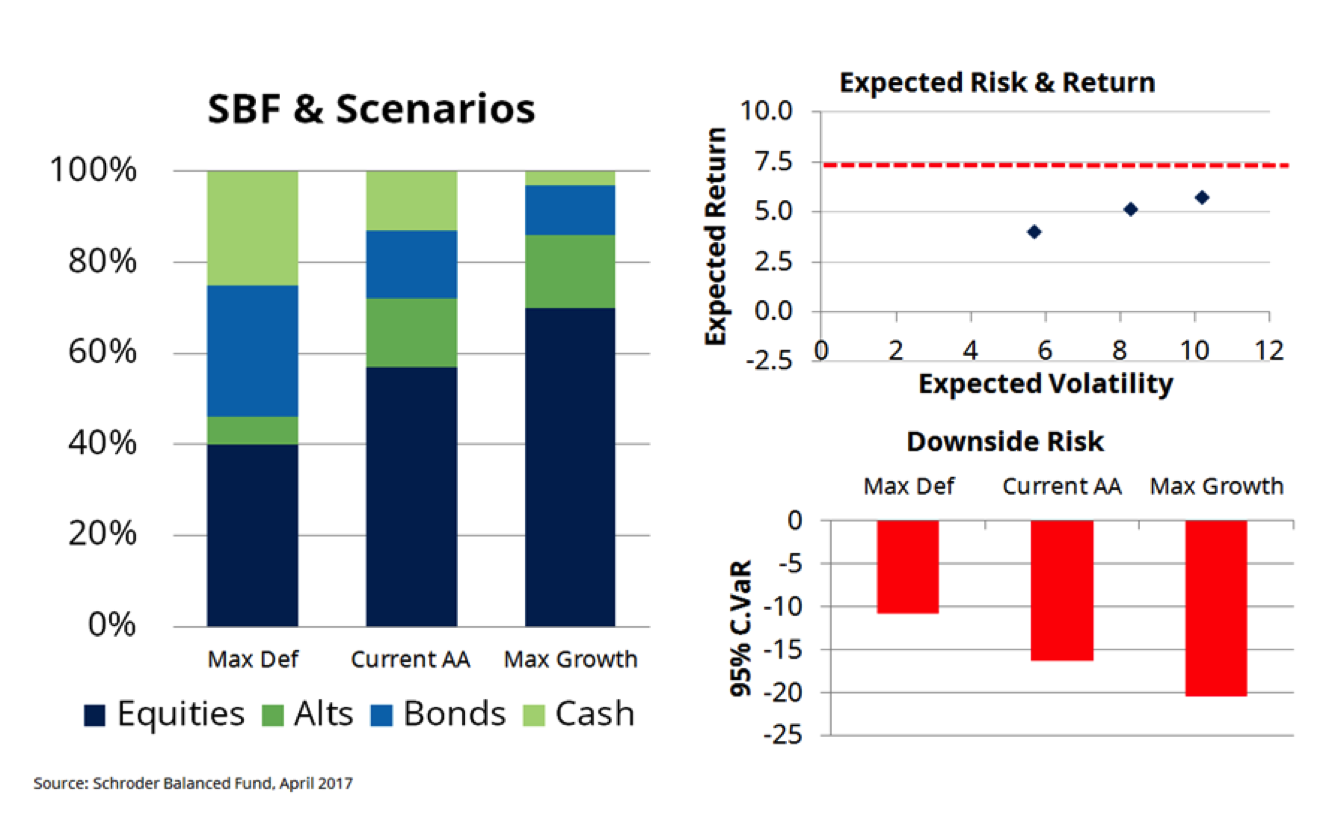
The most significant implication is that even a maximum growth allocation does little to close the “shortfall” gap between the returns proffered by the existing asset allocation and a CPI+5% target (a typical objective of these default type structures). On our numbers, the expected returns increase slightly 5% to 5.7%, with expected volatility increasing from 8% to 10%, while perhaps more importantly, the potential downside risk from around -16% to around -20%. In short, this implies minimal additional return for meaningful additional risk.
Conclusion
The point of this note is to highlight the embedded shortfall risk in a typical fixed Strategic Asset Allocation investment strategy (E.g. the typical Australian balanced fund), should returns be low, and clustered, as we currently project.
Aggressive asset allocation within narrow ranges is also unlikely to solve the problem given the structural anchoring to equity market outcomes and the relatively narrow tactical ranges in which asset allocation can be, and for that matter is able to be, adjusted. This is an inherent structural flaw within the Strategic Asset Allocation model.
The practical implication is that this significantly limits the ability of managers of these types of portfolios to “turn the dial” sufficiently in an environment of compressed and clustered returns or where equity returns are moderate.
While not covered in this article we would make the additional point that complex and illiquid alternatives are unlikely to provide the solution to the return shortfall as they are building off the same underlying market environment.
It is not our intention to be bullish or bearish, just realistic. If we are right, or even broadly right, then how we approach portfolio construction will matter a lot in terms of the outcomes we achieve. We do know that returns are unlikely to be linear, meaning that an active and unconstrained approach to asset allocation should be an important part of a strategy to close the shortfall gap implied by current valuations and subsequent returns. Of course we could be wrong, but as someone also said to me recently, “hope is not a strategy”.
Simon Doyle is Head of Fixed Income & Multi-Asset at Schroders. You can access further insights here: (VIEW LINK)
Never miss an update
Enjoy this wire? Hit the ‘like’ button to let us know.
Stay up to date with my current content by
following me below and you’ll be notified every time I post a wire
Simon is responsible for Schroders' Australian Fixed Income and Multi-Asset capabilities. He has direct portfolio management responsibility for the Schroder Real Return Strategy, Schroder Balanced Strategy and Schroder Fixed Income Core-Plus Strategy


Simon is responsible for Schroders' Australian Fixed Income and Multi-Asset capabilities. He has direct portfolio management responsibility for the Schroder Real Return Strategy, Schroder Balanced Strategy and Schroder Fixed Income Core-Plus Strategy
Simon is responsible for Schroders' Australian Fixed Income and Multi-Asset capabilities. He has direct portfolio management responsibility for the Schroder Real Return Strategy, Schroder Balanced Strategy and Schroder Fixed Income Core-Plus Strategy
Comments
Comments
Sign In or Join Free to comment
most popular
Investment Theme
If 24 LICs ran the Melbourne Cup, which ones would we back?
Affluence Funds Management