What Mattered Today; When will we sell Telstra?
First day back in the office after the Christmas break although we were reasonably active throughout the period increasing cash levels in the Platinum Portfolio to 26.5% - we’ll cover this below however the market was pretty well behaved over the Christmas period and again today, although we saw early strength today being sold into - a theme that we think will play out more and more as investors come back online. We typically see a bullish December, early part of January met with some selling which more often than not leads to a weaker start to each calendar year.
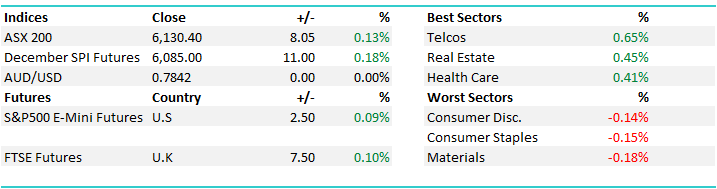
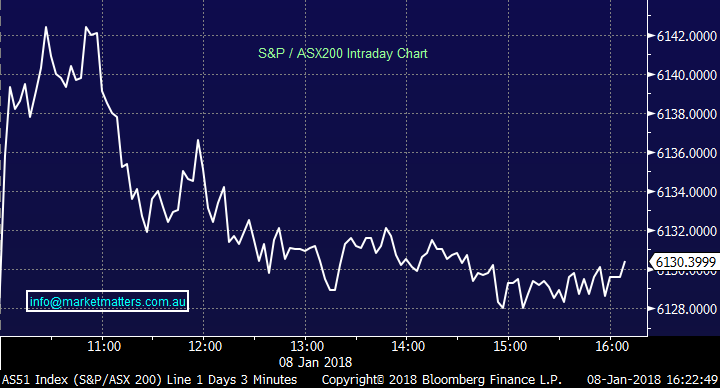
On the market today, we had an overall range of +/- 19 points, a high of 6143, a low of 6124 and a close of 6130, up 8pts or +0.13%
 ASX 200 Intra-Day Chart – morning optimism sold into
ASX 200 Daily Chart
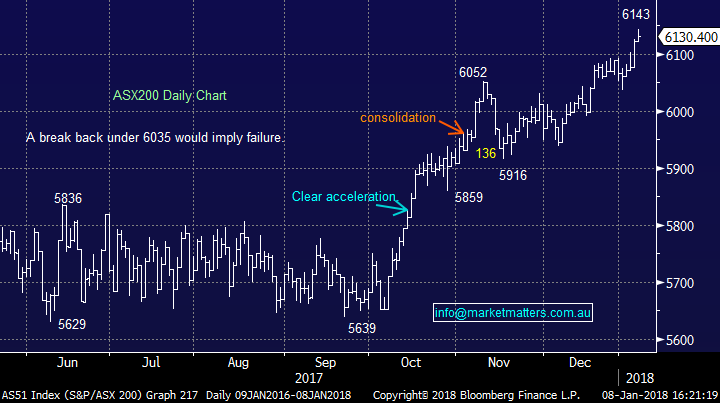
The market has simply been on an extended run north from the start of October putting on around ~8% to today’s high of 6143. Two observations worth noting. 1. All of the calendar 17 gains came at the end of the year 2. - We’re starting the year following a big Q4 gain which means we’re clearly susceptible to some profit taking, which will likely kick in once institutional managers get their feet under the desks, plan for the year ahead, look at funding redemptions and simply increasing cash given the mkts recent strength. The market does appear extended in the short term and we are wearing our sellers hat - with our buyers hat in the cupboard for now.
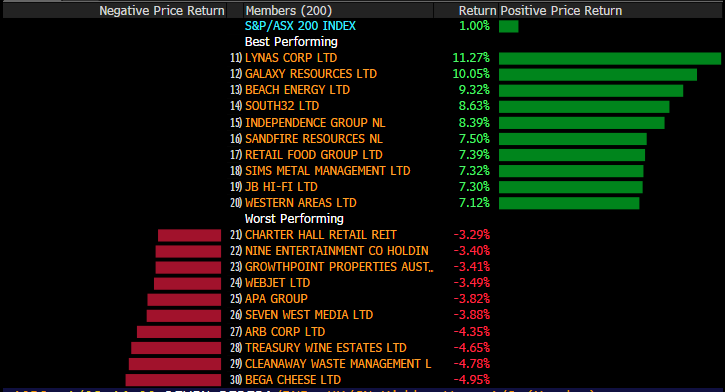
On the market today, some love once again finding its way into the unloved stocks / sectors of 2017 which can often be the case. Discretionary retailers were strong - Harvey Norman particularly so adding nearly 1% in an overall flat market. Interestingly enough, and this speaks to the idea that its worth considering sectors that are getting beaten up in the media, our two best performing holdings in the Income Portfolio are Harvey Norma and Nick Scali – companies that were no longer relevant in a post Amazon world (apparently).
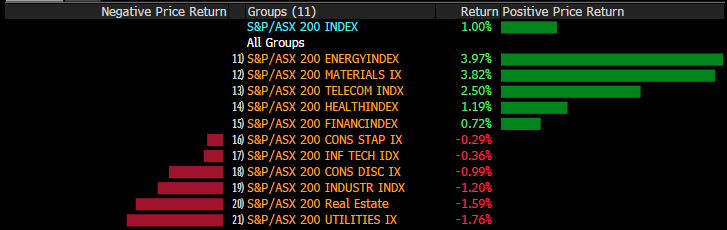
Looking at the sectors that have most strength since our last report on the 20th December, the Energy Sector was the place to be with our position in Woodside in both portfolios benefitting from continued strength in Crude. As we wrote in our 2018 Outlook this morning, we expect Crude to trade up to $US70/bbl this year dragging the energy names higher.
Elsewhere, despite strength in the overall market, the interest rate sensitive sectors, the Utilities and the Real Estate stocks have struggled since our last missive on the 20th of December.
In terms of the property sector, REITs finished 2017 underperforming the broader ASX equities index both for the month of December and on a calendar year basis, snapping a 3 year “winning streak". Relative performers over 2017 included CNI, ABP, PLG, GDI and CHC while relative underperformers were led by the large Retail landlords SCG and VCX. At this juncture, the sector remains expensive trading at a 29% premium to NTA (as at 31 Dec 2017), well above its longer term average of ~21%.
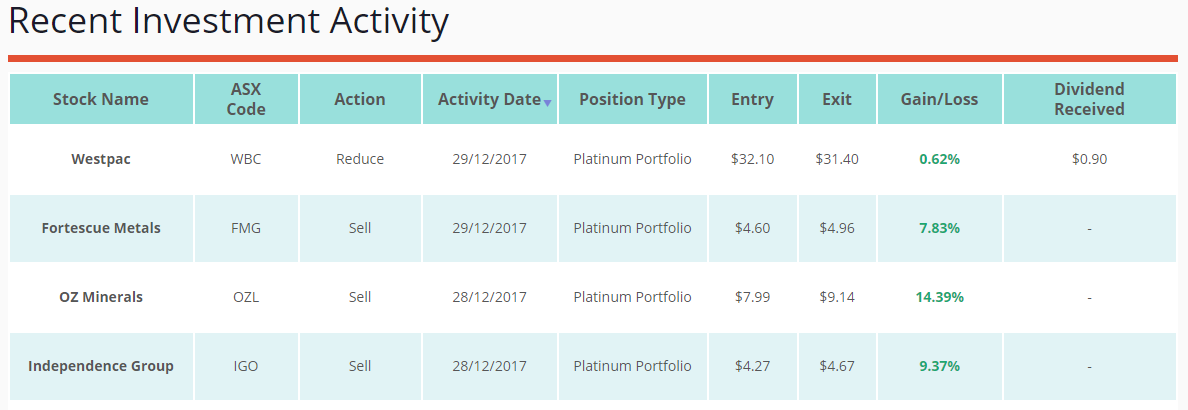
Now turning to specific stocks, the material names dominate the best performers over the period - we held Independence Group (IGO) in the Platinum Portfolio however used the prevailing strength to take profits. We also own Webjet which is down around 3.50% since our last report, however we remain keen on this holding, showing an ~8% paper profit.
In terms of the MM Portfolios, we listed these in the AM report this morning. To view all portoflios and to view our 2018 Outlook Report, simply sign up for a free 14 Day Trial - CLICK HERE
Over the break we took the following actions; All in the Platinum Portfolio
TOP MOVERS
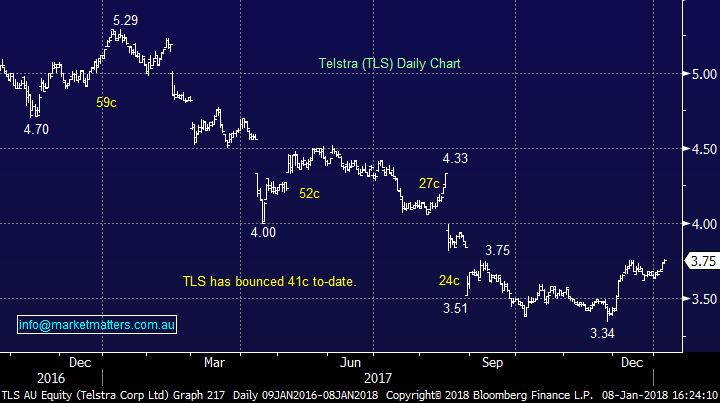
1. Telstra (TLS) $3.75 / 0.54%; We own TLS in both portfolios and are up in each. Our plan remains to be sellers on a move above $3.85, however we’d be keen buyers again below the 12 month low of $3.34
Telstra Daily Chart
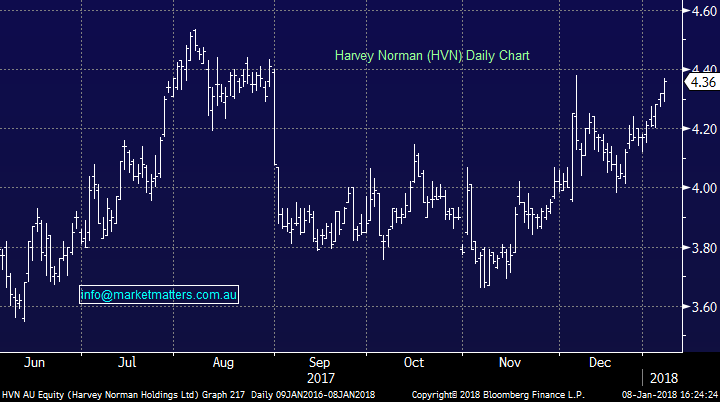
2. Harvey Norman (HVN) $4.36 / 0.93 %; We bought around $4 in the Income Portfolio and will be keen sellers closer to $4.60 - we’ve also picked up the dividend.
Harvey Norman Daily Chart
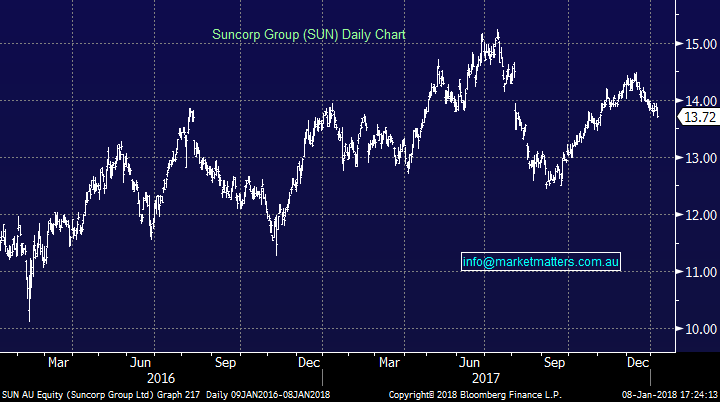
3. Suncorp (SUN) $13.72 / -1.15%; the company out today with a profit warning saying that their first-half results will take a hit courtesy of the hailstorm in Melbourne last month. The claims are primarily home and vehicle however it puts SUN over its cap. The coy has a total natural hazard cap at $360m however for the six months to December 31 they are currently sitting around the $410m mark which isn’t good but not a huge issue on initial look. Shares were obviously off but not a lot. We own SUN
Suncorp (SUN) Daily Chart

Have a great night
James & the Market Matters Team
Prices as at 08/01/18
Never miss an update
Enjoy this wire? Hit the ‘like’ button to let us know.
Stay up to date with my current content by
following me below and you’ll be notified every time I post a wire
James is the Lead Portfolio Manager & primary author at Market Matters, a digital advice & investment platform with over 2500 members that offers real market intel & portfolios open for investment. He is also a Senior Portfolio Manager at Shaw and Partners heading up a team that manages direct domestic and international equity & fixed-income portfolios for wholesale investors.

2 stocks mentioned

James is the Lead Portfolio Manager & primary author at Market Matters, a digital advice & investment platform with over 2500 members that offers real market intel & portfolios open for investment. He is also a Senior Portfolio Manager at Shaw and...
Expertise
James is the Lead Portfolio Manager & primary author at Market Matters, a digital advice & investment platform with over 2500 members that offers real market intel & portfolios open for investment. He is also a Senior Portfolio Manager at Shaw and...
Expertise
Comments
Comments
Sign In or Join Free to comment