When will the relief rally come?
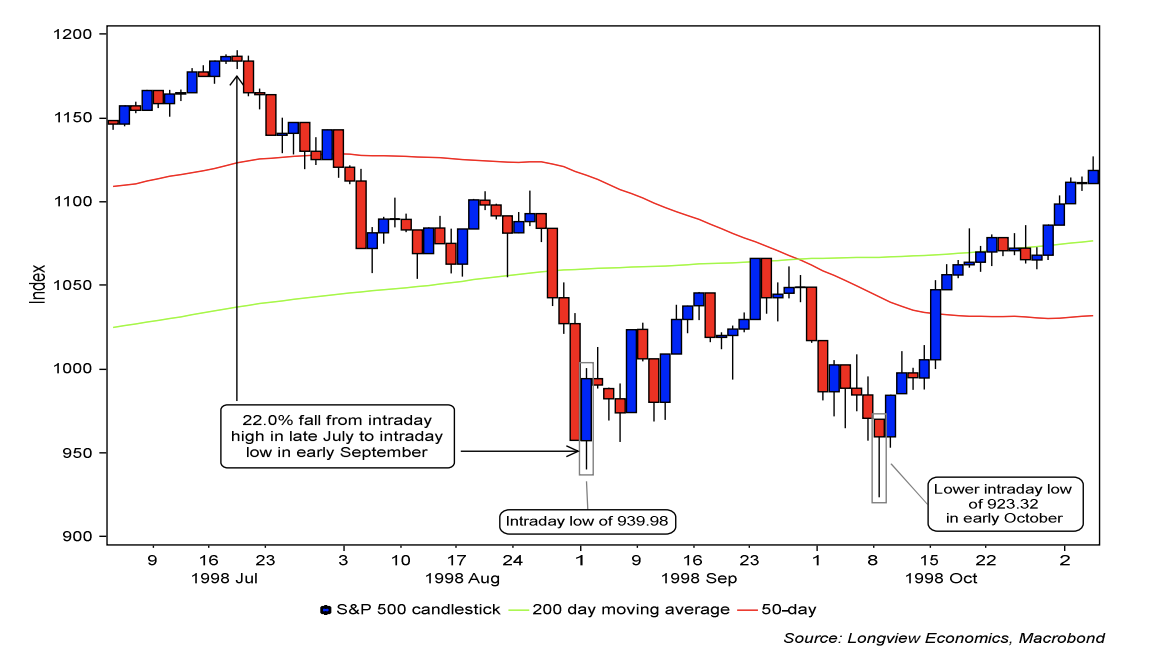
US equity markets clearly remain in the ‘Panic’ phase of this pullback. If history is any guide, that will soon be followed by a short-covering relief rally (possibly lasting several weeks, i.e. the ‘Relief’ phase of the pullback). Then, a final wave of selling is likely and, with that, a retest of the initial ‘wave one’ low (i.e. the ‘Demoralisation’ phase of the pullback).
An example of those key phases (and emotions) of a stock market crash is shown in Fig 1a.
Fig 1a: S&P500 candlestick chart: July – October 1998
While that framework is useful, there are still, though, a number of other key
questions facing tactical asset allocators (i.e. on a 1 – 6 month time frame)
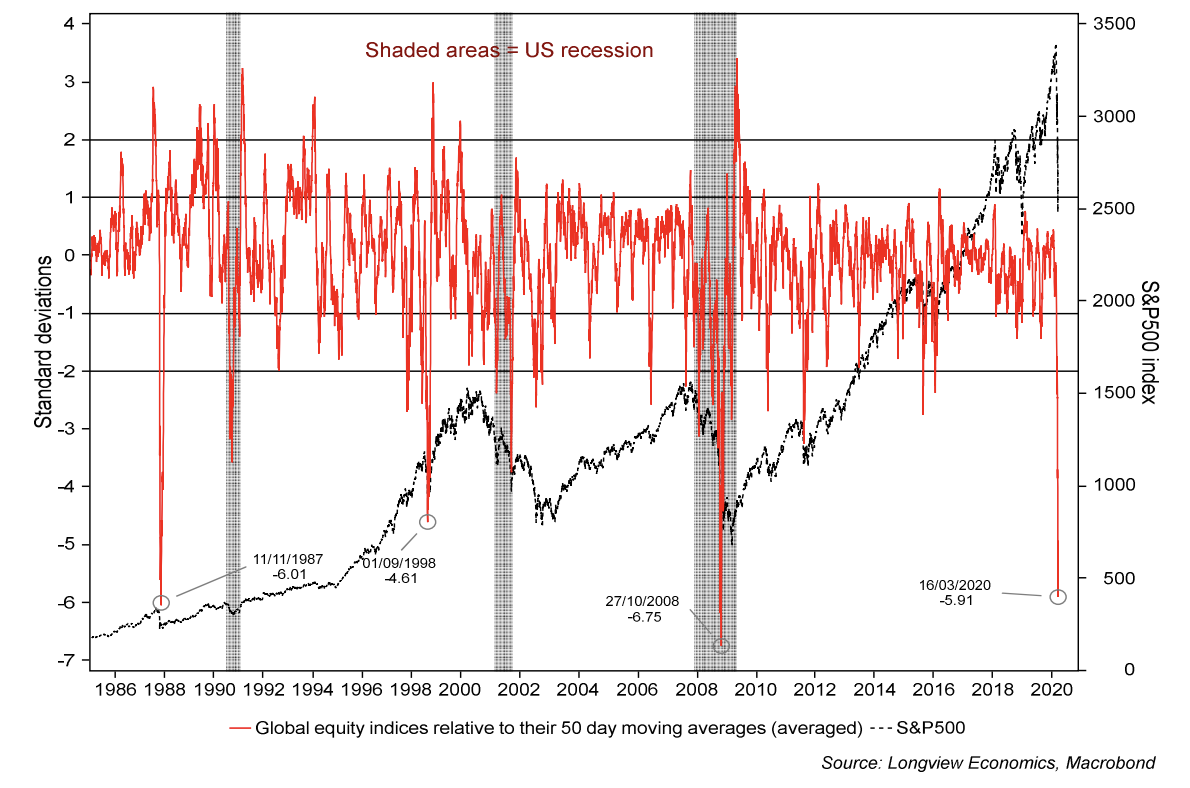
Fig 1: Global equity indices relative to their 50 day moving averages vs. S&P500
Most obviously: How advanced is this initial wave of ‘Panic’ selling?
And, in particular, what are the conditions necessary to stem downside
momentum in markets and set the stage for the next phase of this pullback
(i.e. the ‘Relief’ phase)?
A clear strong BUY message from our medium term models is clearly one of the key pre-conditions. Looking across a range of models, that condition has been met: A number of our indicators are now generating extreme (and record strong) BUY signals, as we show, for example, in fig 1, and in Section 1.
On its own, though, strong signals from the models are probably not ‘enough’. In particular, it’s likely that progress on three key fronts needs to occur (or at least start to be anticipated by markets) in order for a relief rally to begin in earnest.
Those key fronts are:
(i) Rising confidence in how and when COVID-19 will be contained in the West;
(ii) Evidence of targeted, global, fiscal policy response: In particular markets need to see evidence that the US, EZ* and probably China are moving towards an aggressive (bazooka style) fiscal package**, which includes a backstop to limit the demand shock spreading into a permanent supply side shock (i.e. offset the loss of business revenues and the likely rise in unemployment); and
(iii) policy to restore order to markets (which is already being addressed by the major global central banks, especially the Fed). In that respect, the Fed has further tools at its disposal and will likely enact them as required.
We therefore recommend remaining tactically NEUTRAL risk/equities (for now) and OW cash in our strategic portfolios (as implemented on 9th March).
*NB Germany & the UK have already announced aggressive fiscal measures/small business
support. The ECB has also announced targeted lending support via the banking system for
SMEs (as has the BoE).
**Key elements would include guarantees and backstops for industries directly at risk from the
lockdown as a result of the virus.
Section 1: Models at Historic Levels
Price action in recent weeks is some of the most dramatic of the past 100 years. In particular, this US stock market crash is now similar in size to that of October 1987 and 2008. With that, our medium term models have reached historic levels, and can be categorized into three key groups, as follows:
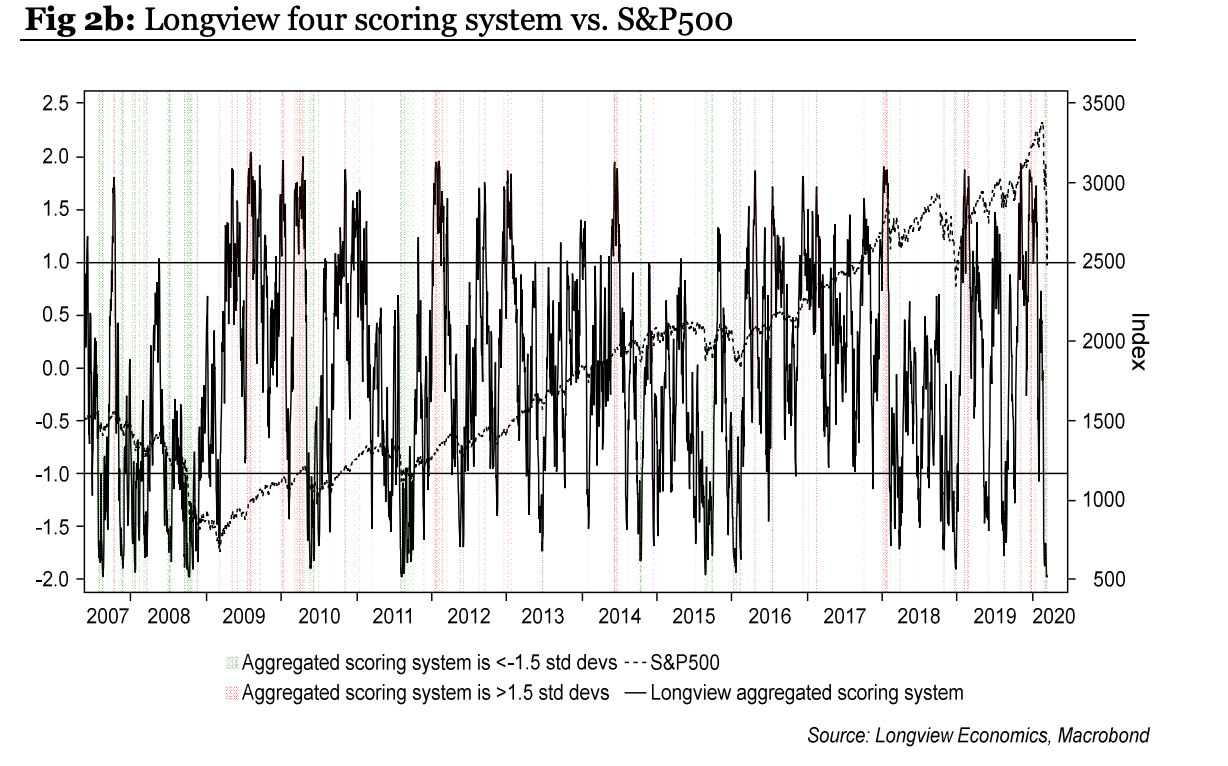
1. Risk appetite models are generating some of their strongest signals since they were built. Our combined medium term risk appetite model (i.e. RAG1 + RAG2), for example, has generated its strongest BUY signal since the model’s inception in 1995. With that, our scoring system, which aggregates signals from several key risk appetite models, is generating one of its most extreme readings on record (see fig 2b).
2. Technical models are generating some of their most extreme
signals of the past several decades. Our overextended model, for
example, which scores and aggregates 50 key country equity indices relative
to their own trend, is giving its most extreme reading since the 1987 crash
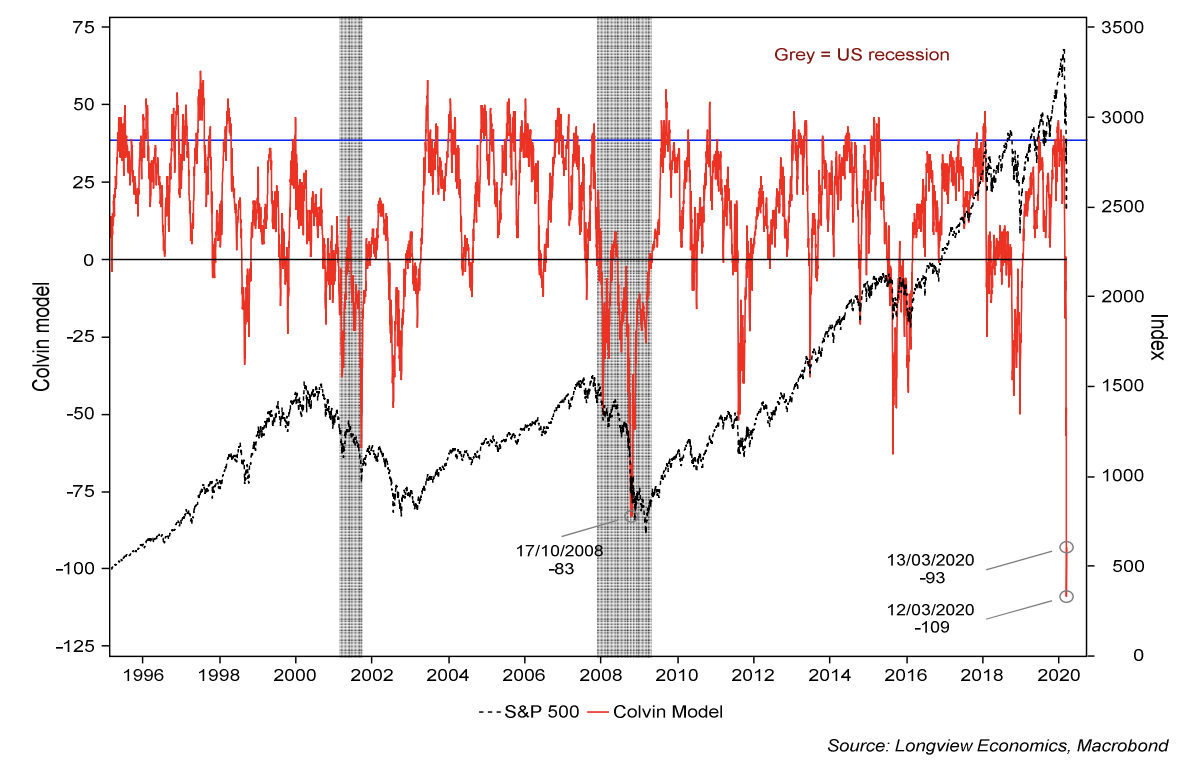
(fig 1). Equally, the Colvin model, a measure of breadth across global
markets, is generating its strongest reading on record (i.e. since 1995, see fig
2). A similar (extreme) picture is also clear at a single stock level, while other
models, including our medium term technical scoring system for the
S&P500, are at multi-decade extreme readings.
Fig 2: Colvin model (global over-extendedness indicator) vs. S&P500
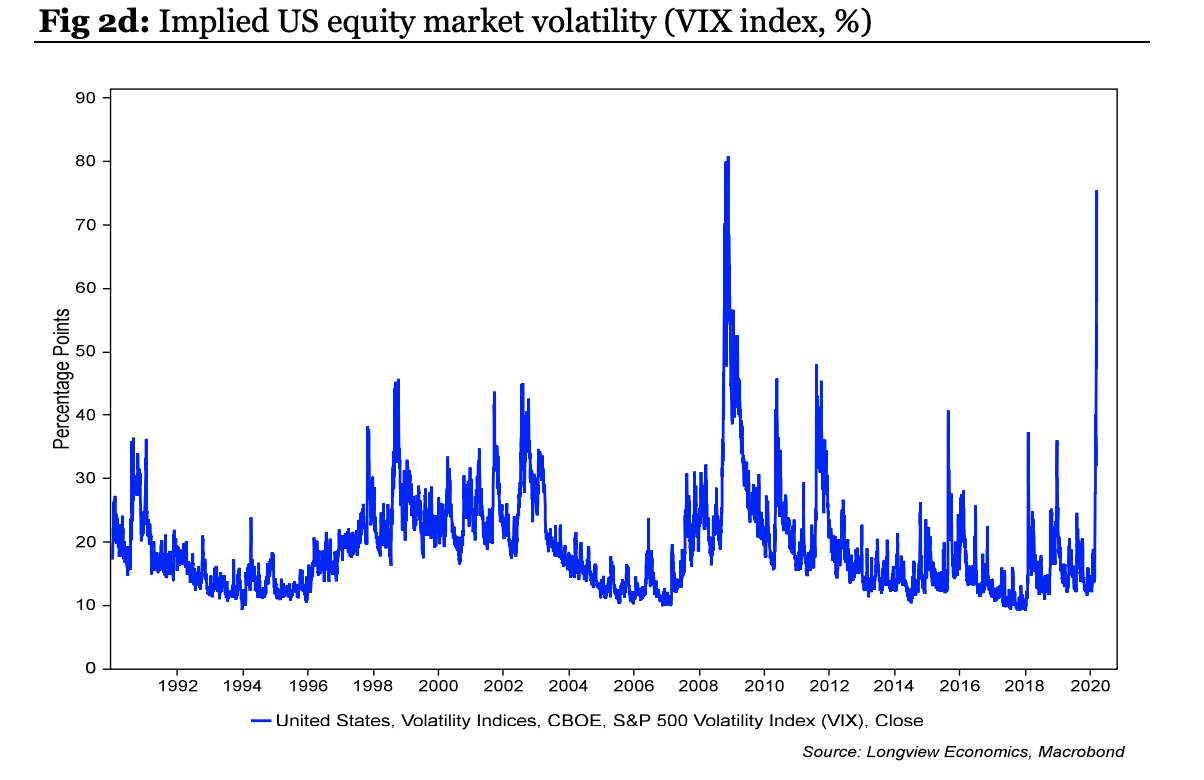
3. Fear and portfolio hedging have risen to extreme/high levels. Simplistically, as measured by the VIX, levels of fear and panic are now akin those reached in the height of the GFC (fig 2d). Reflecting those high levels of fear, portfolios are now extremely well protected to the downside. Our medium-term put to call ratio, for example, has reached its highest level since 2007 (and it’s second-highest level on record, see fig 2e). In that respect, the pressure on investors to sell equities has significantly reduced in recent days/weeks.
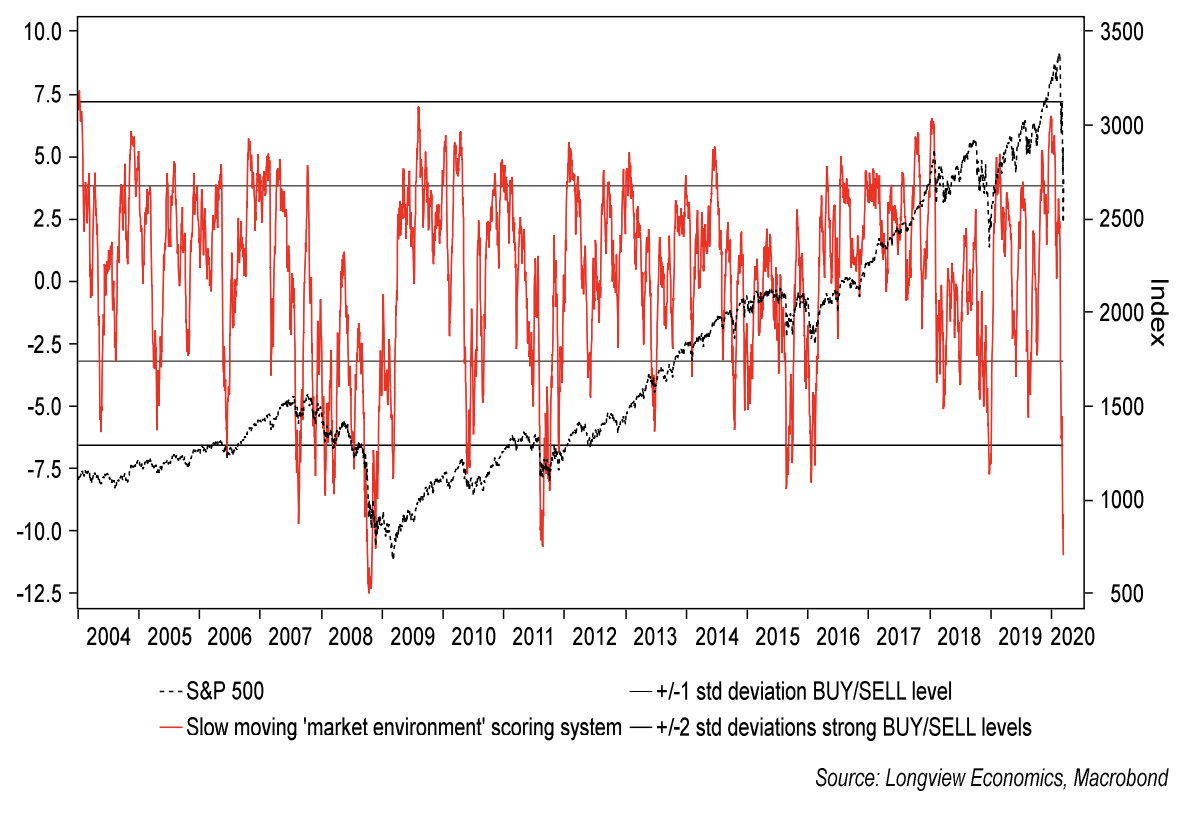
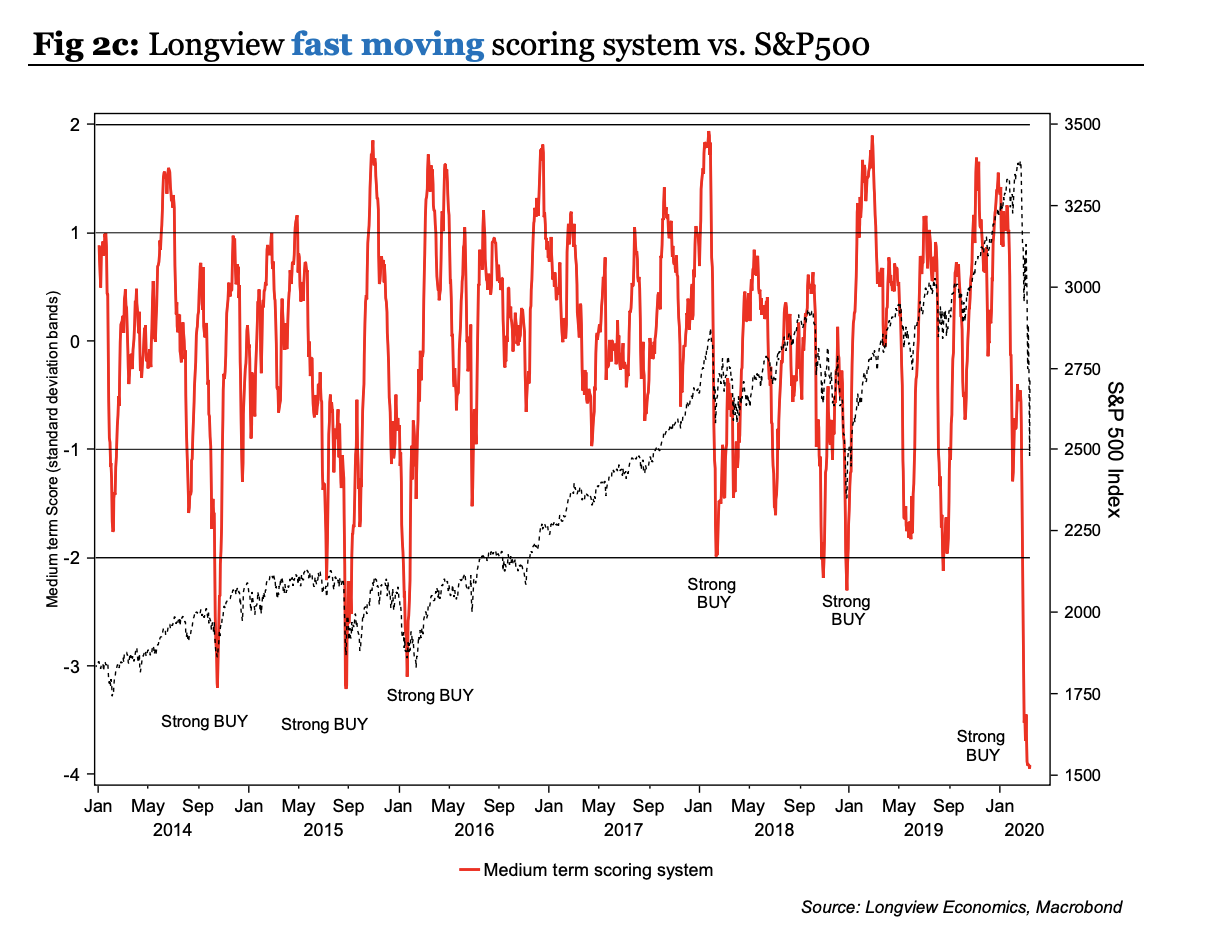
Summarizing those (and other) categories of indicator, both our fast and slow medium-term scoring systems are back at multi-year low levels (see figs 2a & 2c below).
Overall, therefore, and whilst those extreme signals do not preclude further downside in equity markets in coming trading days, they indicate that the probability of markets making a ‘wave 1’ low soon (if it has not already occurred) is high.
Fig 2a: Longview slow-moving scoring system vs. S&P500
Risk appetite scoring systems: Extreme readings
Fear & Downside Hedging Models – extreme readings

Never miss an update
Enjoy this wire? Hit the ‘like’ button to let us know.
Stay up to date with my current content by
following me below and you’ll be notified every time I post a wire
Harry Colvin specialises in global asset allocation, macro themes, and commodities. He has built and developed Longview's commodity research process, timing models, trade recommendations and research products.

2 topics

Longview Economics
Harry Colvin specialises in global asset allocation, macro themes, and commodities. He has built and developed Longview's commodity research process, timing models, trade recommendations and research products.
Expertise
No areas of expertise
Longview Economics
Harry Colvin specialises in global asset allocation, macro themes, and commodities. He has built and developed Longview's commodity research process, timing models, trade recommendations and research products.
Expertise
No areas of expertise
Comments
Comments
Sign In or Join Free to comment