Will debt focused Listed Investment Trusts close the discount?
Will we return to NAV?
That is a hard question to answer, but there is still a lot of meat on the bone here – both in terms of capital upside but also cash yield.
Overall, debt focused Listed Investment Trusts (LITs) have performed well from March lows. Cash distributions have remained largely stable and as illustrated in Figure 1, which has rebased so that 23 March 2020 prices are equal to 100, price performance has been robust. An investment in any debt LIT at the lows would be between 35% to 80% higher on a capital basis alone. This may be inconsequential for IPO participants, who are all still underwater from a price perspective, but not necessarily on a total return basis.
Figure 1. Debt LIT Price
Performance – Normalised*
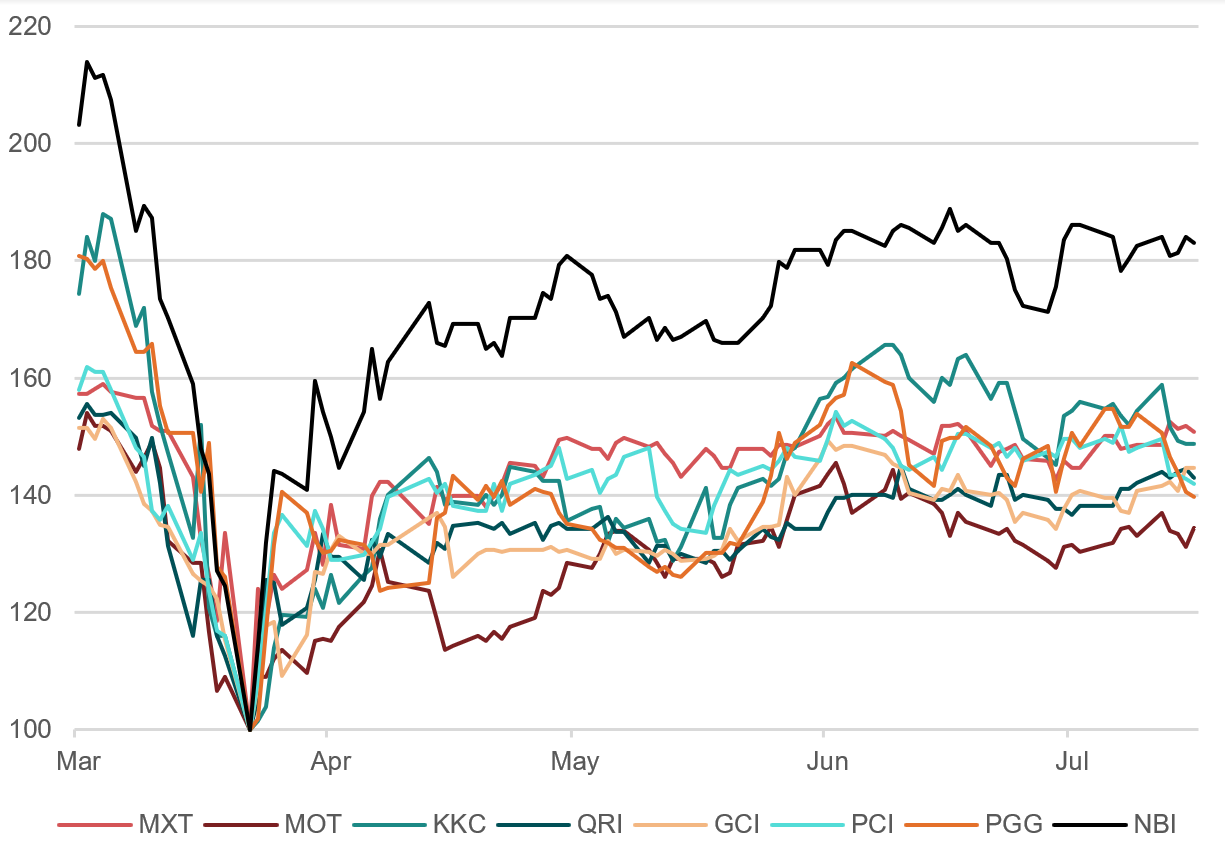
Source: BondAdviser. As of 17 July 2020.
*Where price on 23 March rebased to equal 100. Excludes any cash distribution component of returns.
LIT discounts to NAV have rightly attracted significant media attention. Whilst there are several mechanisms for this discount to be eliminated, including speculation, buybacks, or conversion to an active ETF/unlisted unit trust, it is possible some LITs may indefinitely trade at a discount. This is not unlike how several Business Development Companies (BDC) trade in the US.
As per Figure 2, discounts to NAV imploded during
March . This was largely due to:
- Fear driven selling;
- Margin selling; and
-
NAVs of private debt assets
remaining unchanged – in line with subjective valuation policies where securities
are not marked-to-market.
The premiums of early 2020 are still some way off, however,
as we outline below, the optics on income and/or capital gains for several LITs
continue to demand attention.
Figure 2. YTD Stacked Area Price/NAV
Time Series*
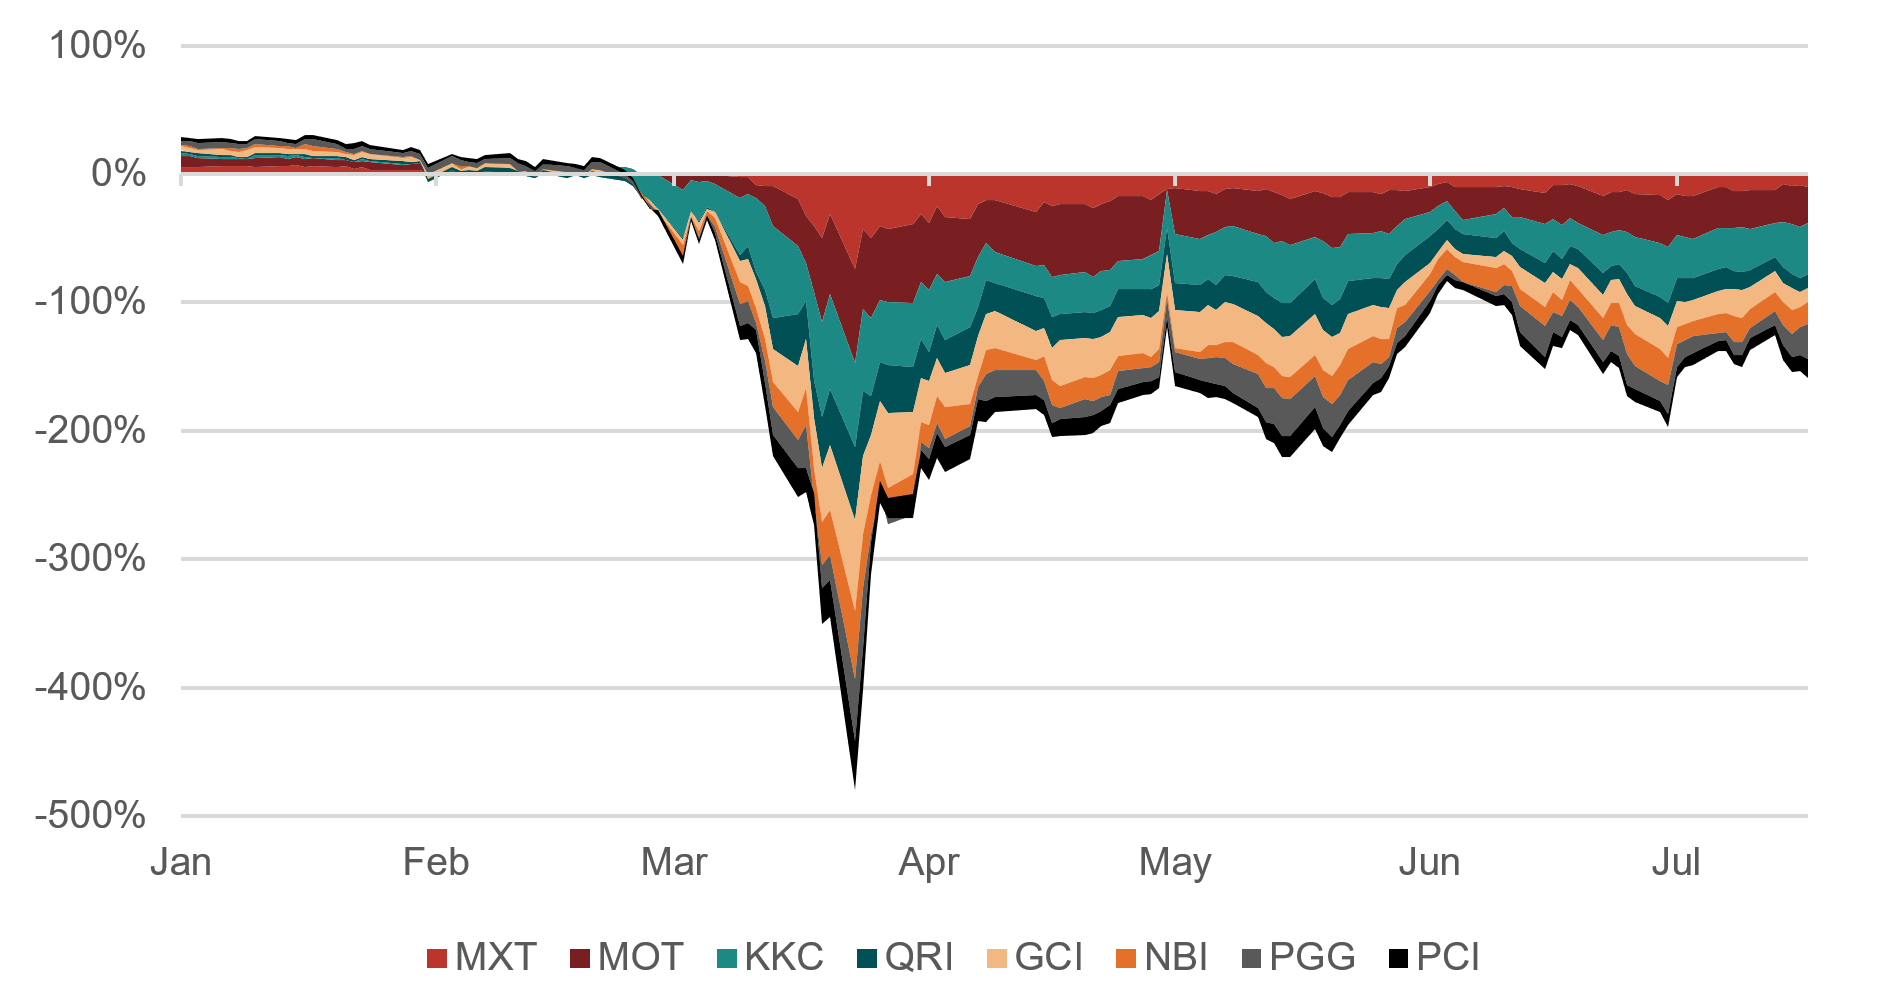 Source: BondAdviser, Bloomberg. As of 17 July 2020. *Sum of the nominal
premium/discount of labelled LITs.
Source: BondAdviser, Bloomberg. As of 17 July 2020. *Sum of the nominal
premium/discount of labelled LITs.We will avoid repeating the technical elements of our modelling from LIT up in Flames? However, we urge readers to review as needed. In outlining some of the assumptions used; our implied price modelling has used credit data from the GFC to derive a price estimate. This modelling has a 1-year horizon and does not account for illiquidity. Probability of default, loss given default and credit rating migration probabilities are the key drivers of our model. This analysis is backwards looking should not be treated as a forecast of expected future prices.
Upon the COVID-19 induced sell-off in March, our initial expectations for several debt-related LITs have held-up well, which we illustrate below on an individual basis.
Given COVID is a 1-in-100 year event, our initial price estimates looked at a 1% cumulative probability of simulations. Our new price range estimate incorporates this initial price estimate as the lower-bound, with the upper-boundary using a 50% cumulative probability.
We do not make assumptions on where the economic recovery will fit on the spectrum of best- to worst-case. This new implied price range simplistically represents a worst-case and middle-case recovery. For those technically inclined, it is the price boundary of simulations such that the integral area post 1% CDF is equal to 0.49.
Pick your poison here. If you are glass half full on the recovery, anything below the upper-boundary appears attractive. Conversely, the glass half empties should view anything above the lower-boundary as rich. Should the pandemic result in credit migrations and loss given default outcomes that are statistically significant in differing to the GFC, this analysis would be spurious for predictive purposes.
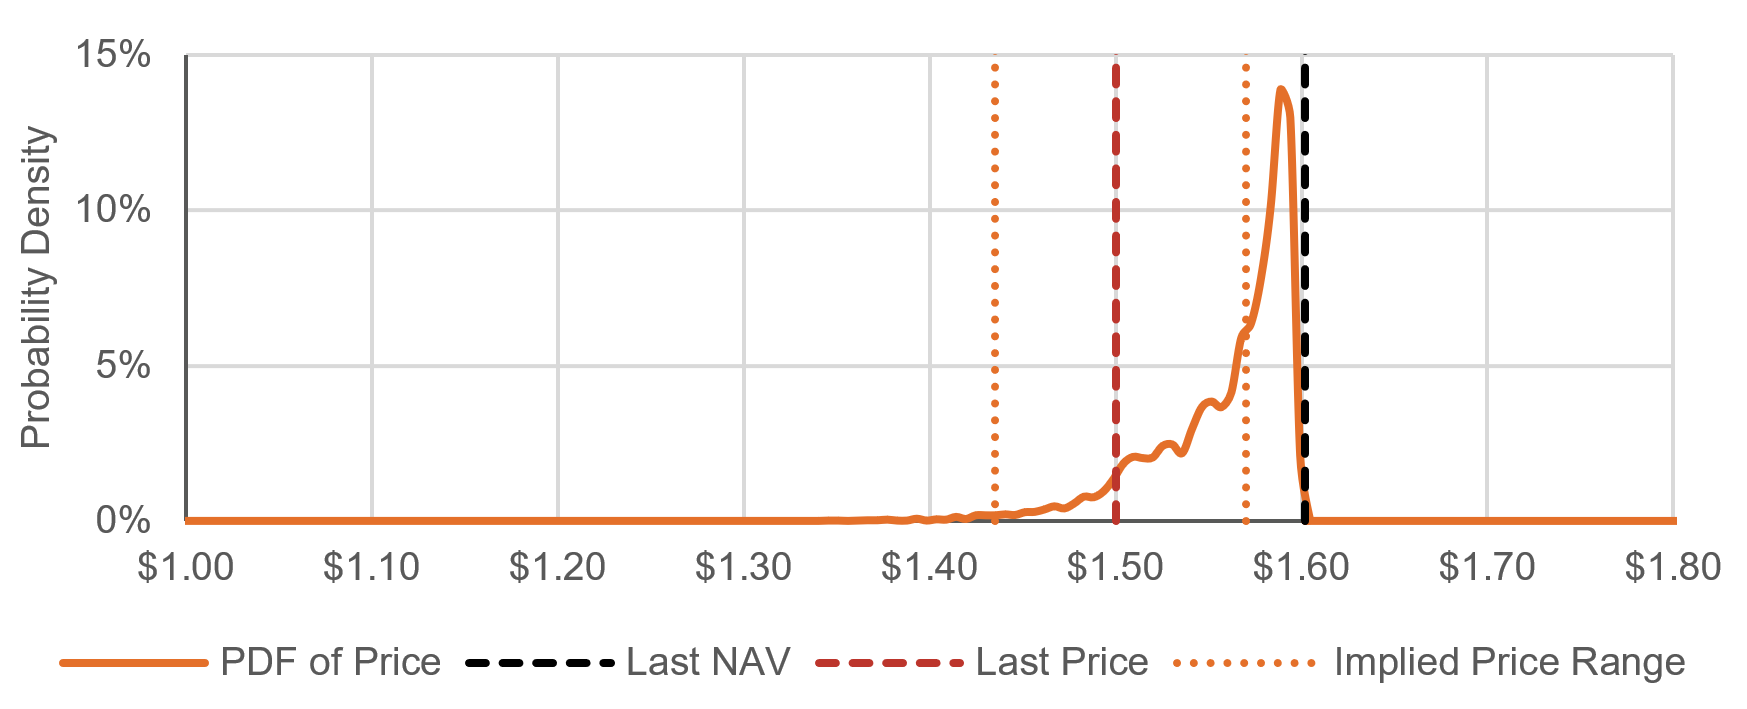
MCP Master Income Trust (MXT)
Figure 3. MXT Price
Performance – Normalised*
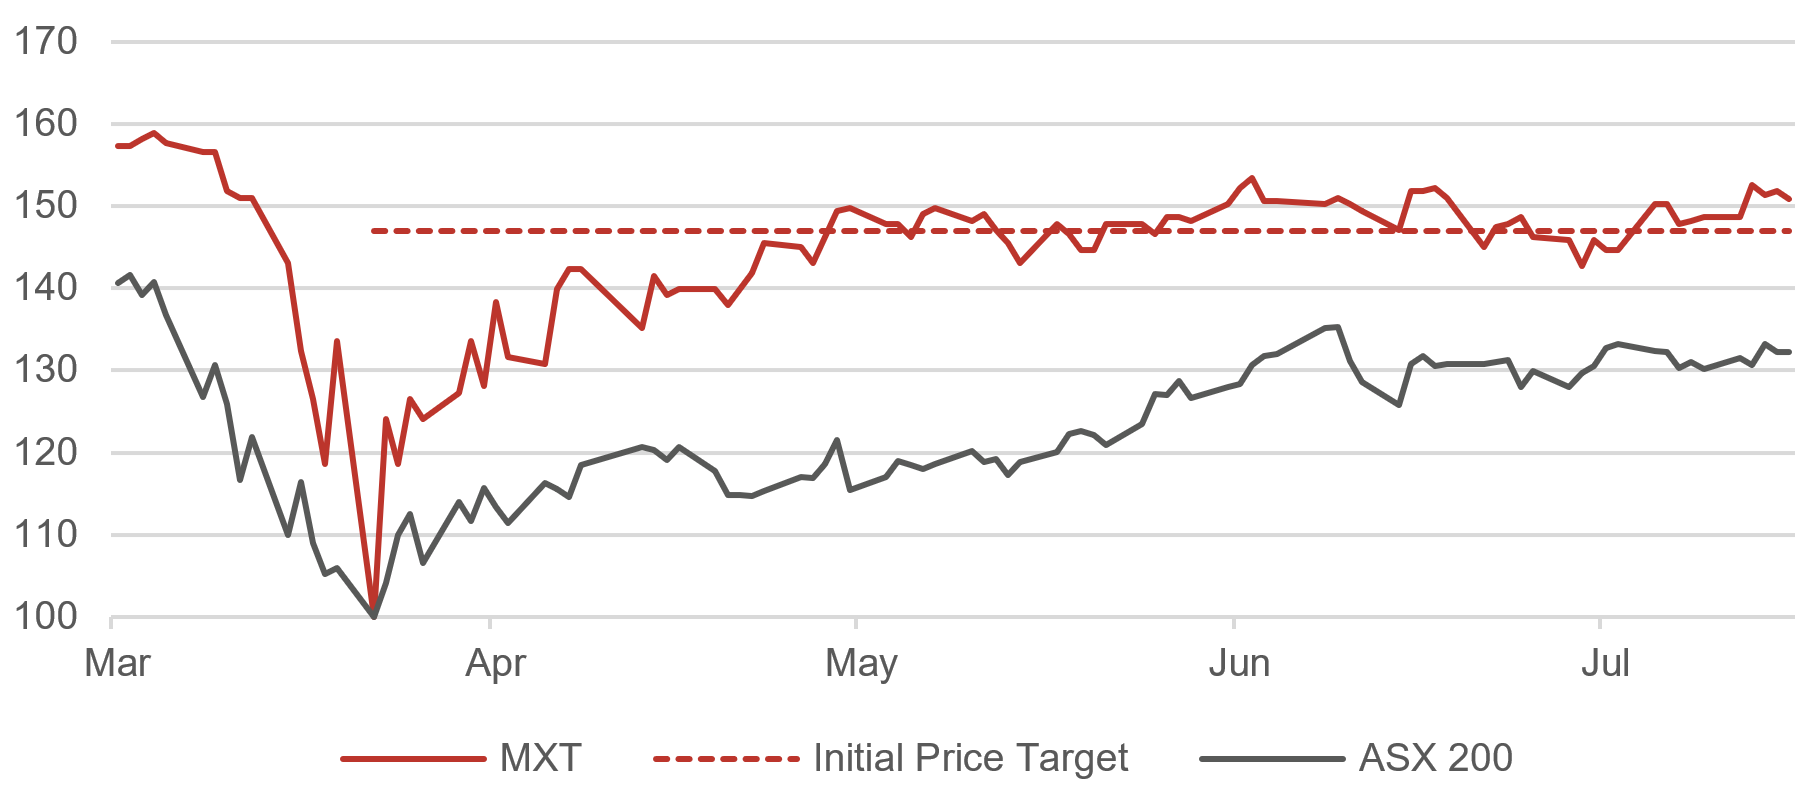
Source: BondAdviser, Bloomberg. As of 17 July 2020.
*Where price on 23 March rebased to equal 100. Excludes any cash distribution component of returns.
MXT provides exposure to the Australian corporate loan market. It has a net (after fees) target return of the RBA cash rate plus 3.25% p.a. We expect MXT to be resilient to capital loss, given on a look-through basis, it contains over 140 unique borrowers, mitigating the impact of any single adverse outcome.
Our initial expectations of a worst-case single year simulation price of $1.85, have proved to be well supported by the market. This has represented a >45% capital gain since mid-March, as illustrated in Figure 3 (noting we use the ASX 200 only as a relative comparison scale between LITs).
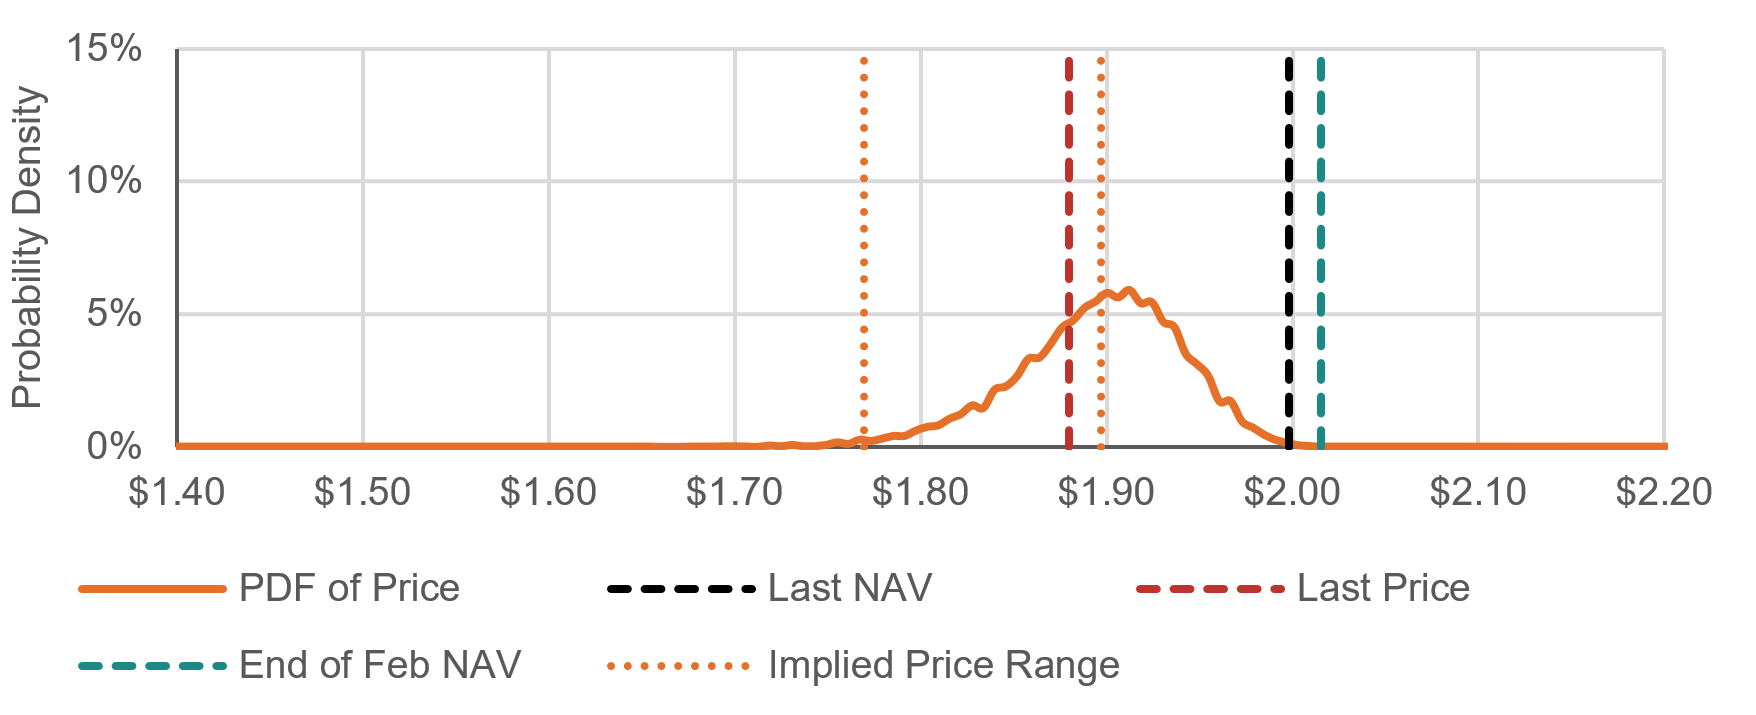
Figure 4. MXT Implied Price
/ PDF for GFC Simulation
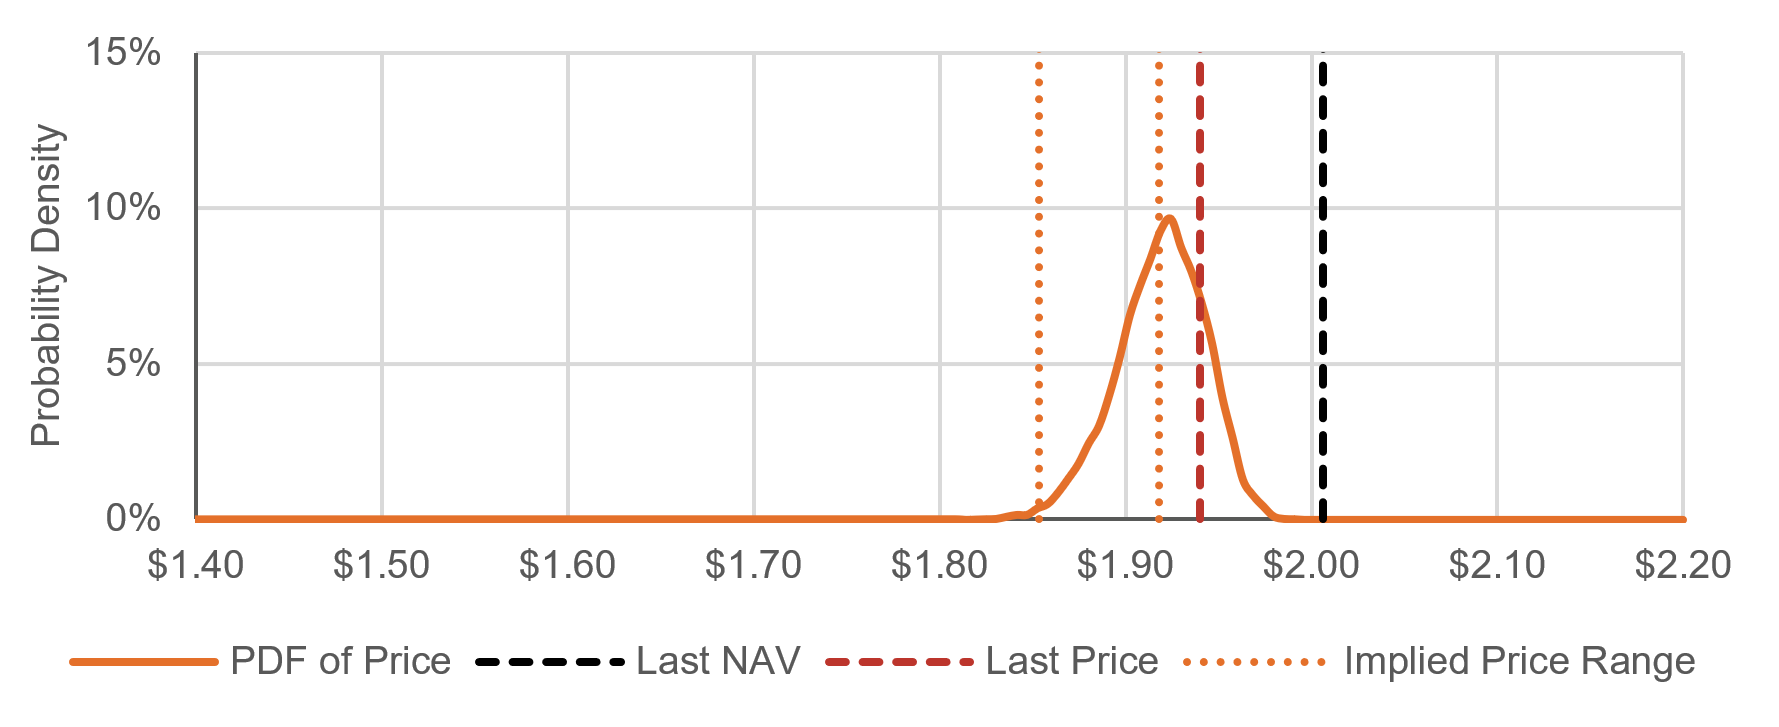 Source: BondAdviser. As of 17 July 2020. Immaterial difference between
Last and End of February NAV.
Source: BondAdviser. As of 17 July 2020. Immaterial difference between
Last and End of February NAV.At a last price of $1.94, MXT trades closest to NAV of $2.01 - the smallest discount in the credit LIT sphere. It is not unreasonable to suggest impairments to NAV, however, should MXT return to NAV, this would represent a 3.6% capital gain, with a distribution yield of 5.85% (using LTM cash distributions divided by last price). MXT trades higher than our upper-boundary of $1.92 and we recognise investor confidence here is stronger compared to other LITs due to (1) track-record of stable cash distributions, (2) Metrics’ buy-back ability; and (3) the recent launch of an unlisted managed investment scheme that may hold units of MXT and invests in the Metrics product universe.
We continue to view Metrics as the pre-eminent
private debt manager in Australia. Although the optics may not be as meaty,
this is indicative of the safer nature of investments. MXT continues provides
diversified exposure to corporate loans, offering an attractive yield and
stable monthly income stream.
Neuberger Berman Global Corporate Income Trust (NBI)
Figure 5. NBI Price
Performance – Normalised*
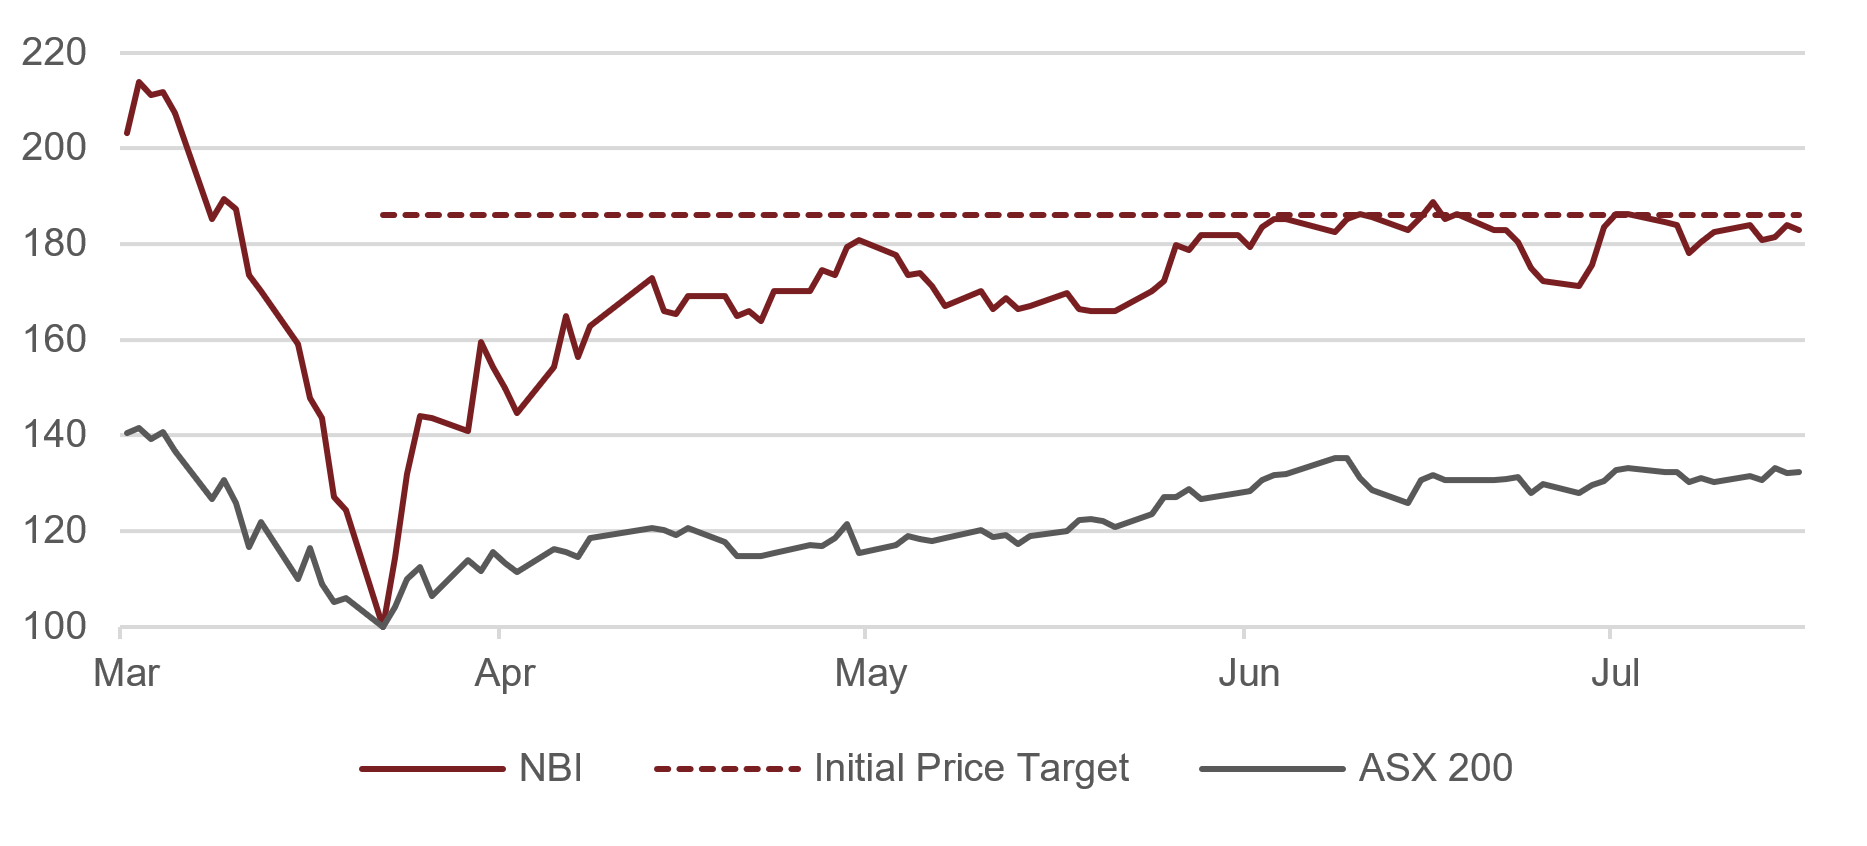
Source: BondAdviser, Bloomberg. As of 17 July 2020.
*Where price on 23 March rebased to equal 100. Excludes any cash distribution component of returns.
NBI provides exposure to the global high-yield bond market. It has a net target return of 5.25% p.a. Neuberger Berman’s success with this strategy is well documented. Its non-investment grade credit platform has only experienced 1 default since 1998, whereas the global high-yield market has experienced over 1,500 defaults in the same period.
Our expectations of a worst-case single year simulation price of $1.75^, has also been firmly supported. This has represented a >80% capital gain as seen in Figure 5. This is the largest capital return of any LIT under our coverage. Even with these gains, NBI currently trades below the lower boundary of our implied price range. At a price of $1.72, NBI trades at a 9% discount to NAV with an attractive distribution yield of 6.31% (using LTM cash distributions divided by last price). Our implied price range for NBI falls between $1.75 and $1.84.
Figure 6. NBI Implied Price
/ PDF for GFC Simulation
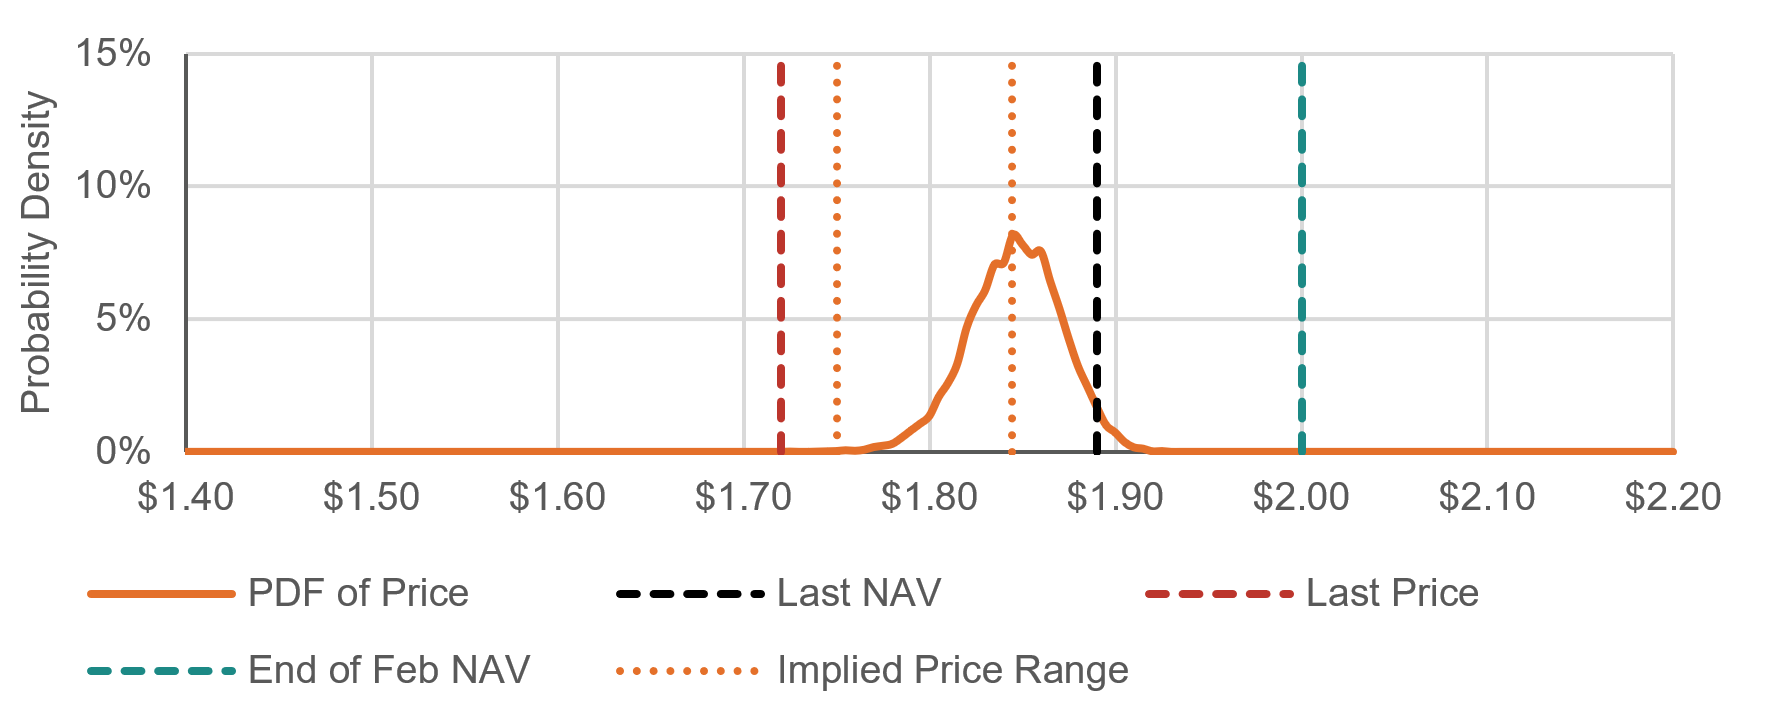 Source: BondAdviser. As of 17 July 2020.
Global high yield credit spreads have tightened from March high levels of 1000+bps into about 600bps. Spreads remain elevated (400bps at start of 2020), compensating for an expected rise in default rates, albeit pricing (and indeed NAV) is suggestive of a better economic recovery than first expected. As we initially pointed out, illiquidity was a large factor in the blow-out to credit spreads but the Fed’s actions have proved calming.
Qualitas Real Estate Debt Income Fund (QRI)
Figure 7. QRI Price
Performance – Normalised*

Source: BondAdviser, Bloomberg. As of 17 July 2020.
*Where price on 23 March rebased to equal 100. Excludes any cash distribution component of returns.
QRI provides exposure to a portfolio of senior and mezzanine loans across the commercial and residential real estate market in Australia. It has a net target return of 8% p.a. Qualitas has a 12-year track record of alternative financing across the spectrum of real-estate lending.
Figure 8. QRI Implied Price
/ PDF for GFC Simulation
 Source: BondAdviser. As of 17 July 2020. Immaterial difference between
Last and End of February NAV.
Source: BondAdviser. As of 17 July 2020. Immaterial difference between
Last and End of February NAV.Our initial expectations of a worst-case simulation price of $1.44 sits close to a last price of $1.50. This has represented a >40% capital gain as per Figure 7. QRI now sits near the middle of our implied price range of $1.44 - 1.57. Given assets are not marked-to-market and essentially held at par until subjectively impaired, the NAV has not budged. As the impact of COVID is felt through the broader economy, impairments to CRE loans becomes more likely. However, should QRI return to trading at NAV, this would represent a 7% capital gain. QRI has a healthy distribution yield of 6.54% (using LTM cash distributions divided by last price), but this may fall alongside the 1.25% reduction in the RBA cash rate since May 2019.
Although QRI has failed to meet its target net return of 8% p.a. since inception, we are pleased that management has exercised restraint in not moving up the risk curve in search of yield. In June, QRI completed a 3,503 unit on market buyback, which, whilst nominal, is positive for indicative future support of the price.
Our modelling for QRI is more complicated (subject to additional error) because no internal or external credit ratings are available for the underlying securities. We assign a proxy rating based on pricing and S&P’s mapping for CMBS based on LVRs. In our worst-case scenario we assume all securities map to a sub-investment grade rating.
KKR Credit Income Fund (KKC)
Figure 9. KKC Price Performance – Normalised*
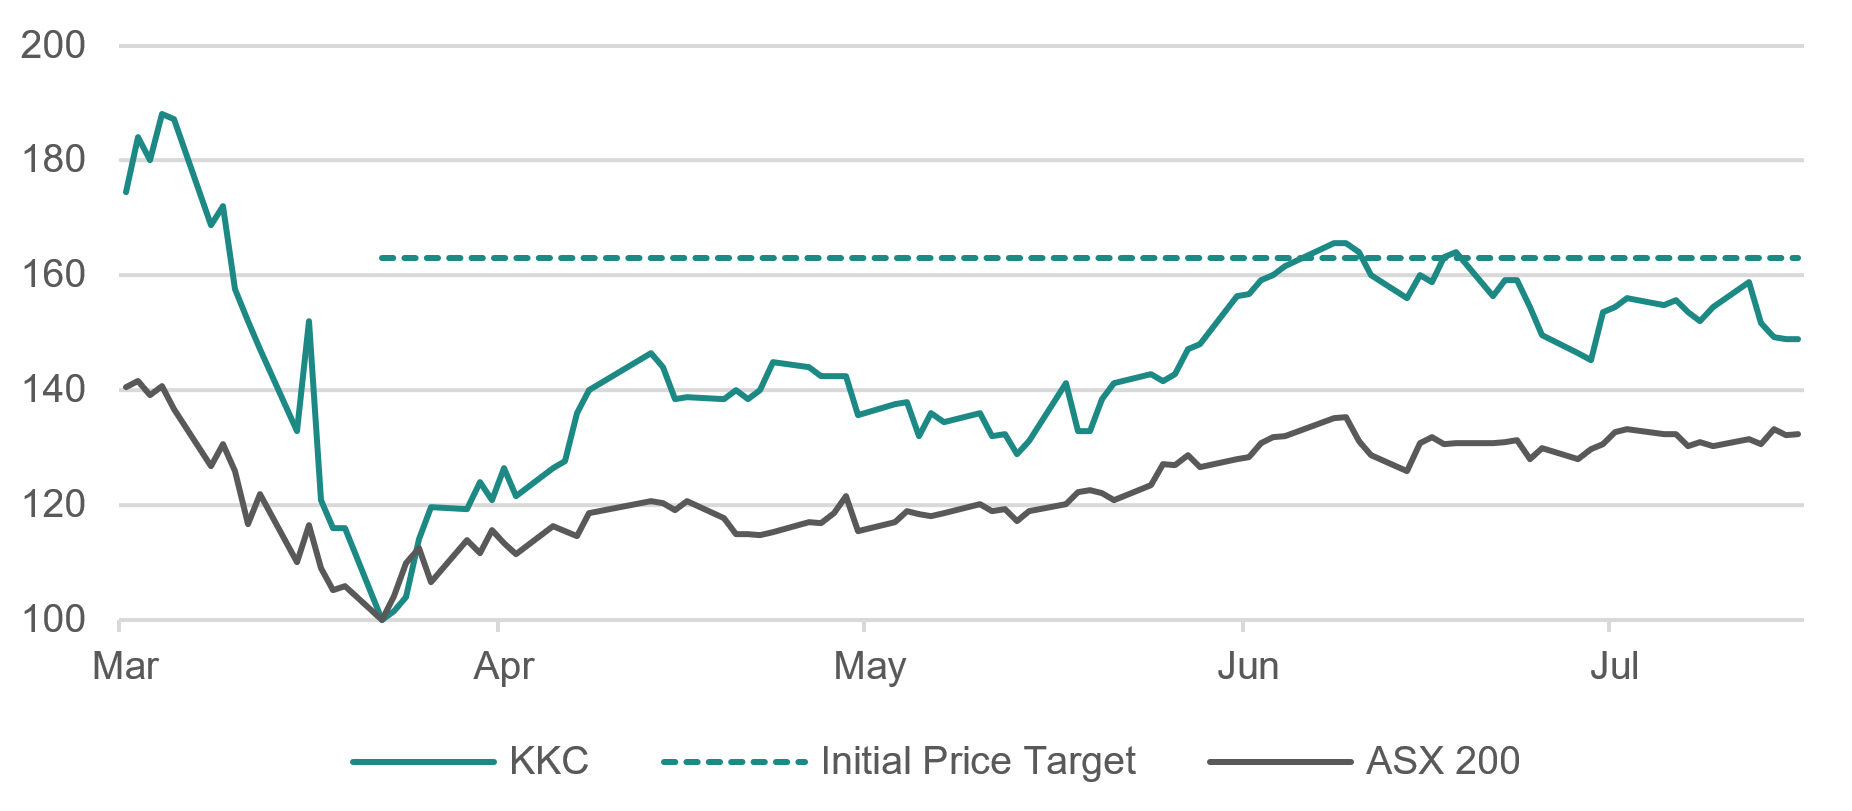
Source: BondAdviser, Bloomberg. As of 17 July 2020.
*Where price on 23 March rebased to equal 100. Excludes any cash distribution component of returns.
KKC provides exposure to KKR’s credit product suite, including the flagship global credit opportunities fund (GCOF) and the European direct lending fund (EDL). It has a net target return range of 6-8% p.a.
Trading in KKC reached our initial expectations of a worst-case simulation price of $2.04 in mid-June, although it has subsequently retracted to a last price of $1.88. This still represents a >40% capital gain as demonstrated in Figure 9.
Figure 10. KKC Implied
Price / PDF for GFC Simulation
 Source: BondAdviser. As of 17 July 2020.
 KKC sits below the lower boundary to our implied price range of $2.04 to $2.28 by 9% and trades at a 17% discount to NAV. KKC has remained out of favour since its upsized IPO in November 2019, and given the low distribution yield of 3.23% (using YTD annualised cash distributions divided by last price) it is easy to understand why. As at 30 June, given the yield to maturity and current yield on the underlying assets of KKC is 10.4% and 7.3% respectively, we expect KCC to find some support should distributions stabilise. Positively, KKC has approval to buy-back 10% of issued units – representing some 37 million units. To date, KKC has only purchased ~720,000 units. However, as the spread between price and NAV persists, we think it is a logical step for KKC, through the responsible entity, or KKR through its balance sheet, to purchase more outstanding units.
The ramp-up of EDL continues, but at a slow pace, making up 15% of KKC. GCOF continues to hold a high proportion of CCC rated assets (look through to 34% of KKC), which, whilst opportunistic, is at our comfort limit. Positively, KKC remains minimally exposed to the oil industry with only a 4% energy sector allocation.
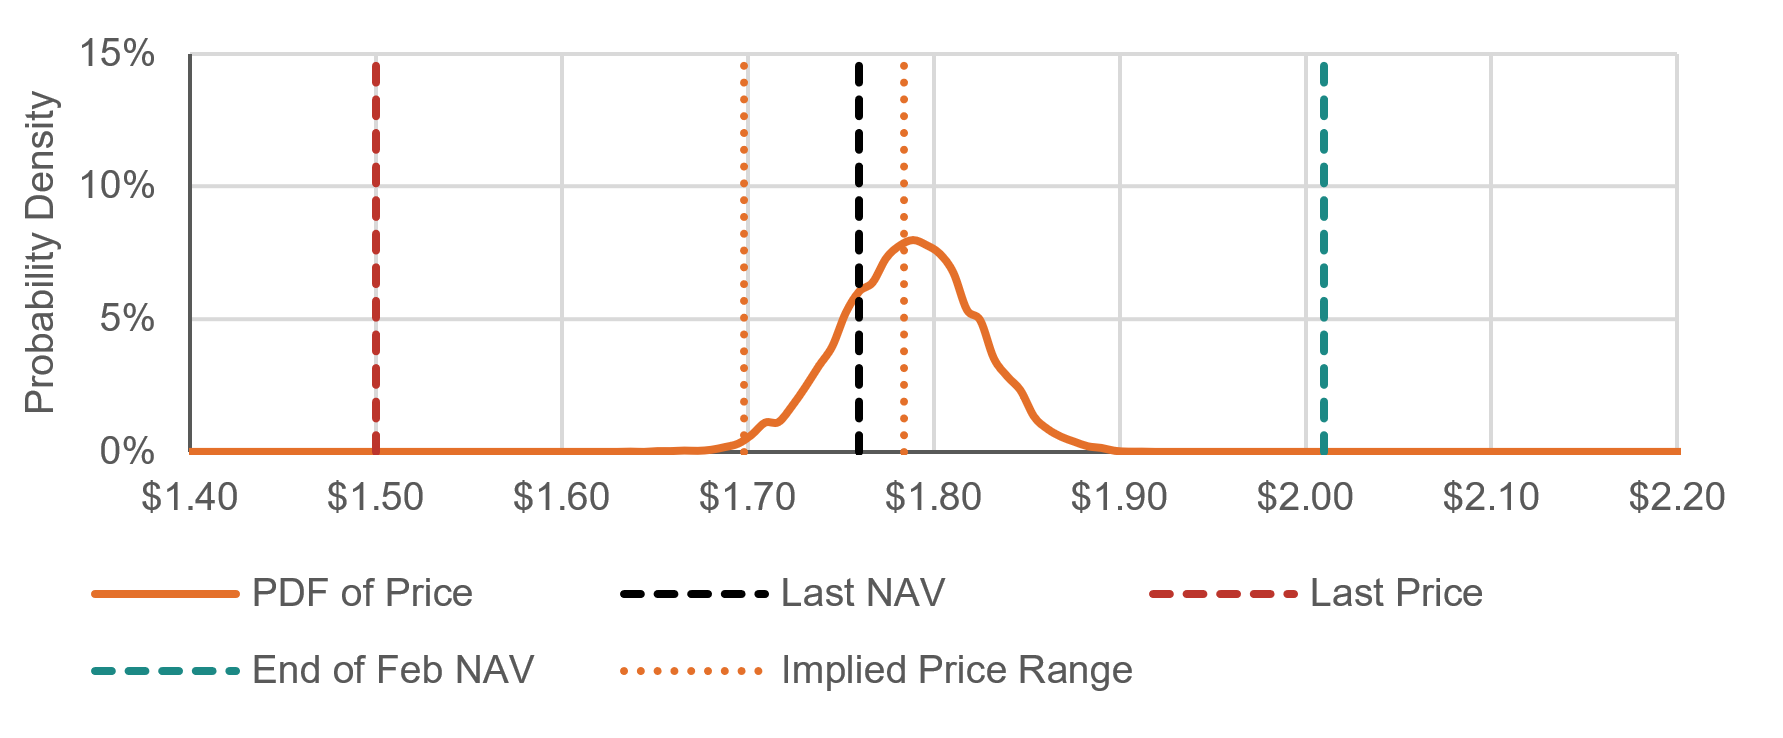
Partners Group Global Income Fund (PGG)
Figure 11. PGG Price Performance – Normalised*
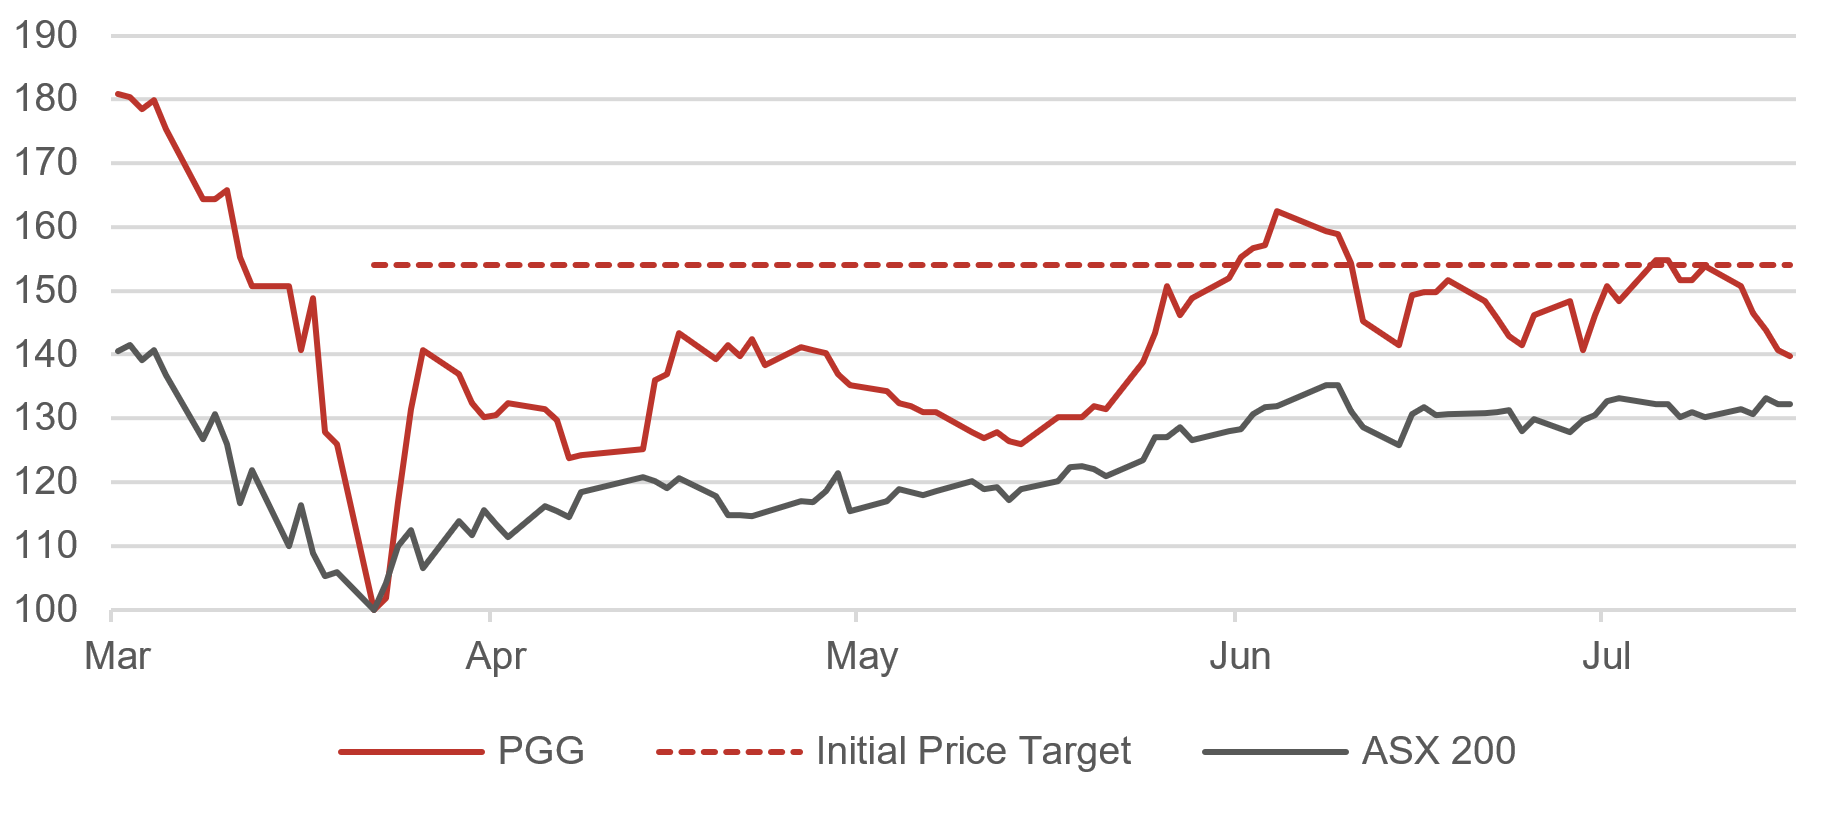
Source: BondAdviser, Bloomberg. As of 17 July 2020.
*Where price on 23 March rebased to equal 100. Excludes any cash distribution component of returns.
PGG provides exposure to a global portfolio of private loans across the capital structure. This is predominantly made of up first lien leveraged loans. It has a net target return of RBA cash rate plus 4% p.a.
Trading in PGG reached our initial expectations of a worst-case simulation price of $1.70 in early-June, although it has subsequently fallen to a last price of $1.50. This still represents a >40% capital gain since March, as demonstrated in Figure 11.
With an implied price range of $1.70 - 1.77, PGG sits outside the lower boundary to our price range by 13%. This is the most of any LIT under our coverage. This also represents a 15% discount to NAV. PGG has an attractive distribution yield of 6.80% (using YTD annualised cash distributions divided by last price).
On a quantitative basis, the value optics here are arguably the most robust. However, we remain cautious with the leverage loan market, given the erosion of covenant controls and deteriorating debt metrics that has occurred over the past ten years. For clarity, our unease is in the broadly syndicate market in the US. More recently and offsetting these concerns, has been the unprecedented ‘nationalisation’ in public credit markets by the US Federal Reserve and additional extensive fiscal support. This will effectively delay the default cycle and result in far fewer defaults than initially expected. This is a considerable positive which underwrites our comfort in PGG through COVID.
Figure 12. PGG Implied
Price / PDF for GFC Simulation
 Source: BondAdviser. As of 17 July 2020
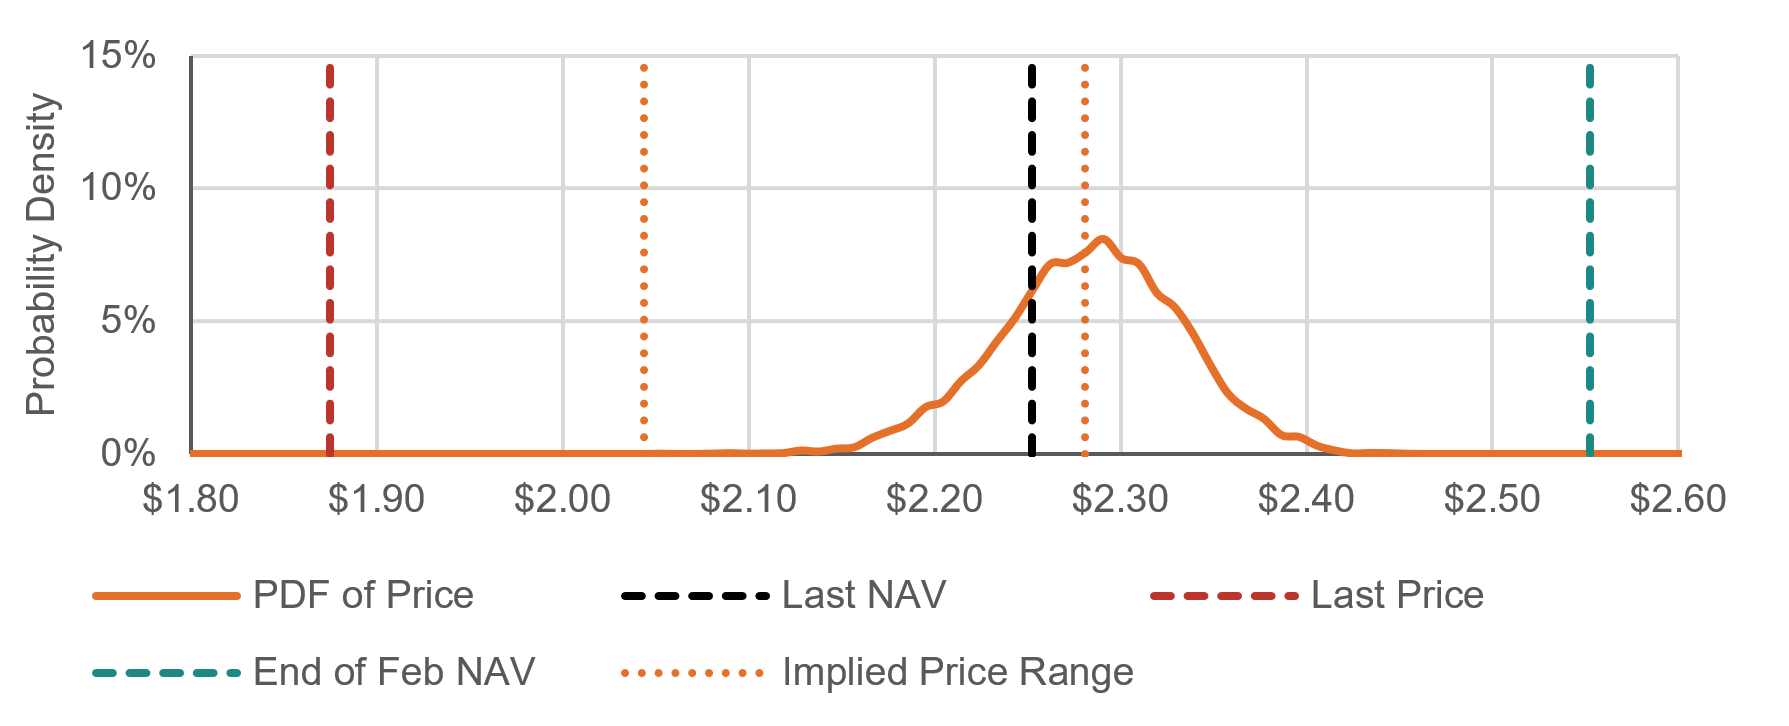
Gryphon Capital Income Trust (GCI)
Figure 13. GCI Price Performance – Normalised*
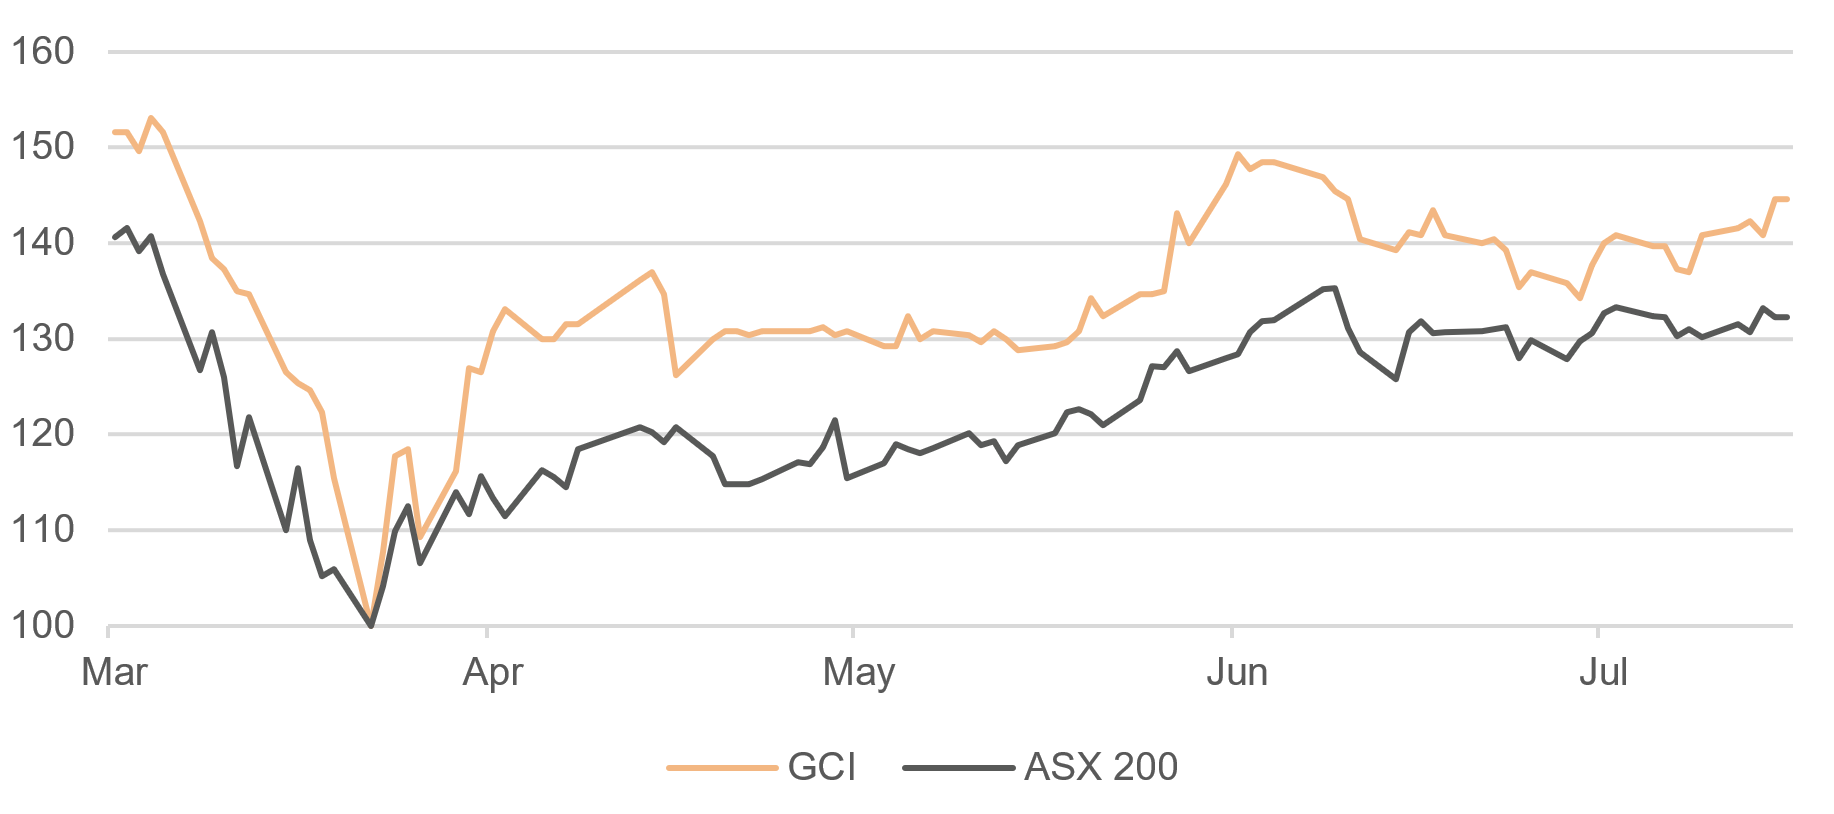 Source: BondAdviser, Bloomberg. As of 17 July 2020.
 *Where price on 23 March rebased to equal 100. Note no modelling was performed on GCI in March to determine a price target – this was due to outdated analysis compared to our current quantitative methodology.
GCI is designed to provide investors with exposure to the domestic securitisation market, primarily through residential mortgage-backed securities (RMBS). It has a target net return of RBA cash rate plus 3.50% p.a.
We did not include GCI in LIT Up in Flames? However, as illustrated in Figure 13, performance has been strong since mid-March, returning >40% in capital gains.
The last price of $1.88 sits at the upper end of our implied price range of $1.77 - 1.90. Our modelling for GCI is more complicated and subject to additional error due to (1) complexity in simulating securitisation portfolios; and (2) extrapolation of stratified historical data sets for Asia-Pacific structured finance, credit migrations and defaults. This may not be reflective of the comparable Australian investible universe. Given such, our modelling is likely to be more conservative (i.e. punitive) in its implied price assessment.
Figure 14. GCI Implied
Price / PDF for GFC Simulation
 Source: BondAdviser. As of 17 July 2020.
 GCI trades at a 6% discount to NAV, with a distribution yield of 4.32% (using LTM cash distributions divided by last price).
In Australian prime RMBS, no dollar of principal has ever been lost. GCI is 74% prime RBMS, with 7% in non-conforming RMBS and 14% in ABS. Although a complicated product, GCI has the safest weighted average credit rating of all LITs in our coverage.
Perpetual Credit Income Trust (PCI)
Figure 15. PCI Price
Performance – Normalised*
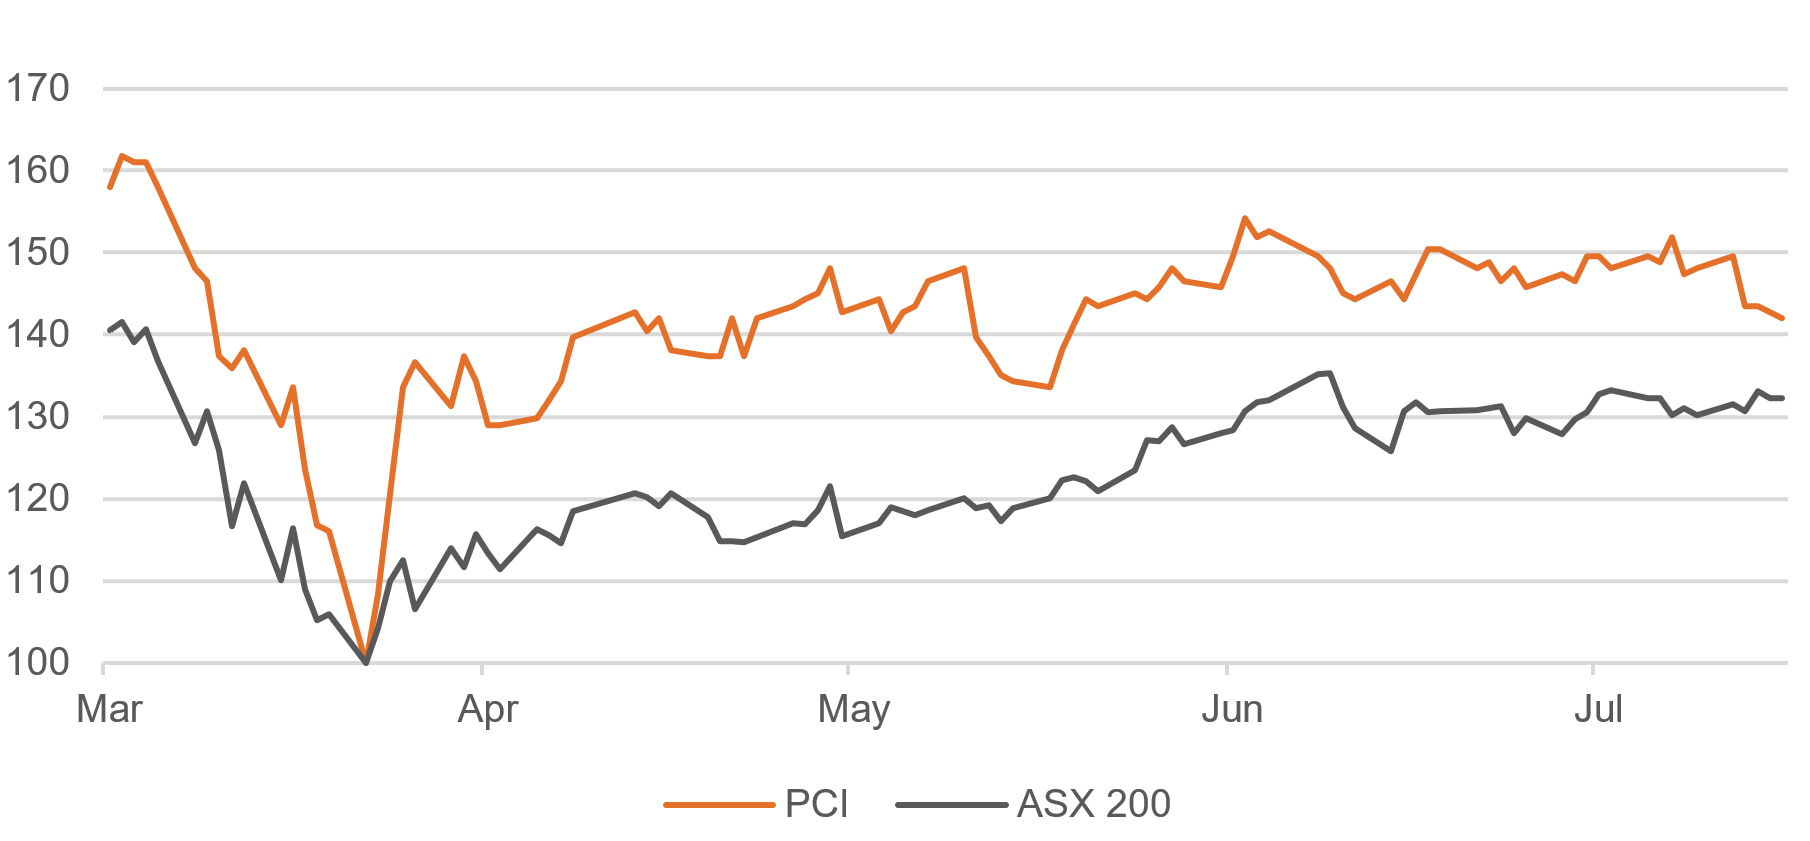
Source: BondAdviser, Bloomberg. As of 17 July 2020.
*Where price on 23 March rebased to equal 100. Note no modelling was performed on PCI in March to determine a price target – this was due to outdated analysis compared to our current quantitative methodology.
PCI is designed to give investors diversified exposure to the domestic corporate loan and bond market. It has a target net return of RBA cash rate plus 3.25% p.a. Derivatives may be used as part of the investment strategy.
We did not include PCI in LIT Up in Flames? However, as illustrated in Figure 15, performance has been strong since mid-March, returning >40% in capital gains.
Figure 16. PCI Implied
Price / PDF for GFC Simulation
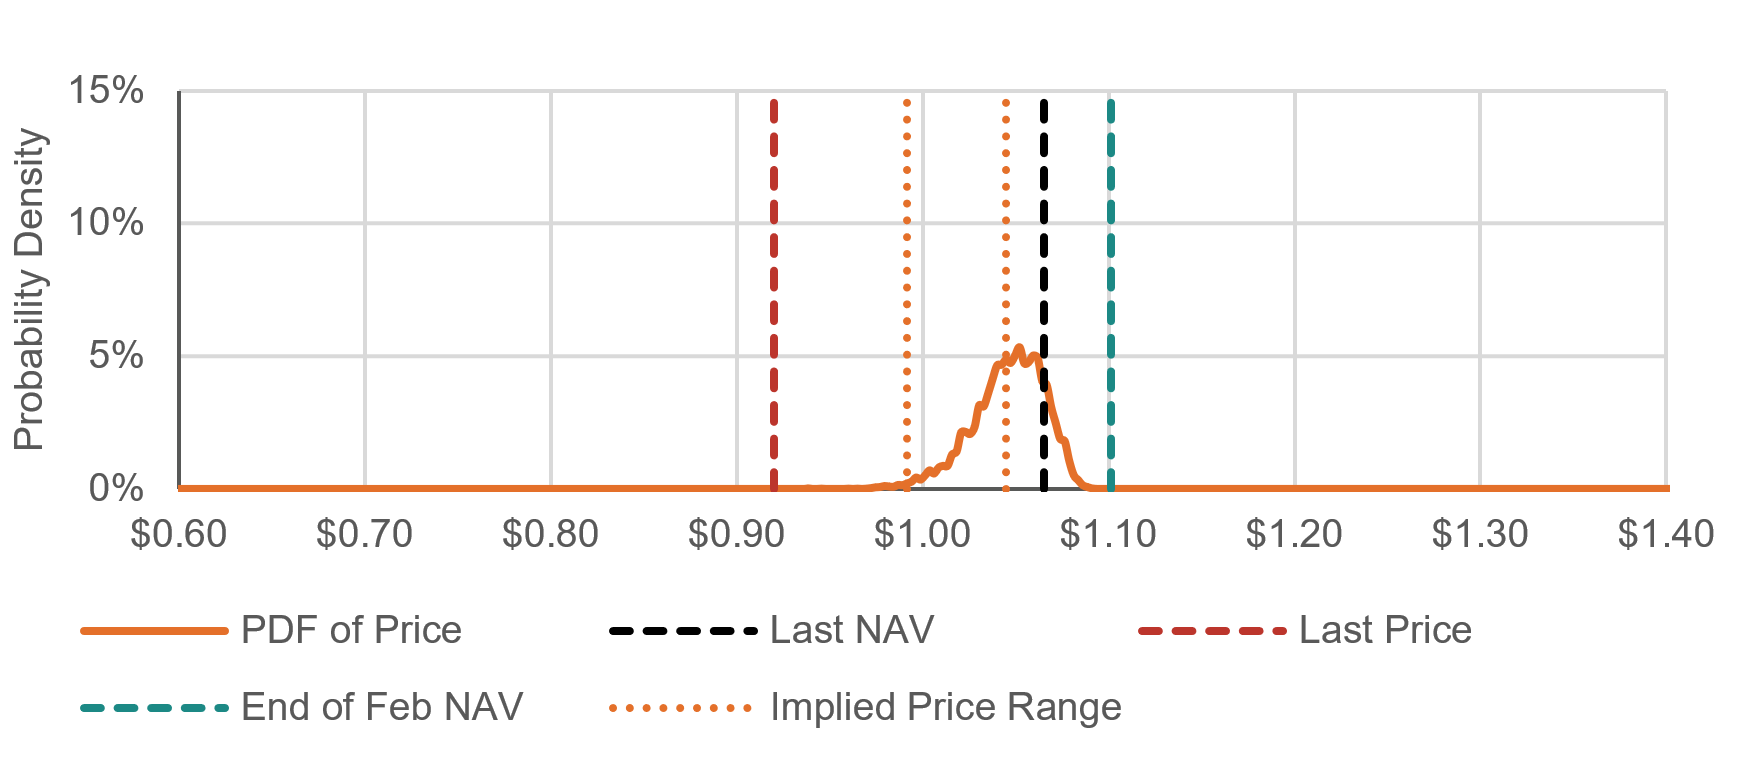 Source: BondAdviser. As of 17 July 2020.
 The last price of $0.92 sits below our implied price range for PCI being $0.99 - 1.05. With a 14% discount to NAV and 8% upside to our implied lower boundary, PCI looks oversold for a portfolio that is primarily investment grade. PCI offers a healthy distribution yield of 4.63% (using LTM cash distributions divided by last price).
Our modelling for PCI is more complicated and therefore subject to additional error due to (1) complexities outlined above (see GCI) in modelling RMBS (~15% of the portfolio); and (2) no internal or external credit ratings were provided for the syndicated loan assets (~20% of portfolio). We assign a proxy rating based on pricing – and in our worst-case scenario we assume all syndicated loan securities map to a sub-investment grade rating.
Where does that leave us?
With all credit LITs trading at a discount to NAV, investor confidence is evidently strained. We cannot answer if LITs will trade above NAV again, however, at current prices, we believe there are options for (1) opportunistic participants, which can take advantage of some of the discounts to NAV; and (2) income participants, to take advantage of the considerably larger yields than alternatives, albeit, with commensurately higher risk. Whilst there is meat on the bone still, there is no free lunch.
A summary of our observations on a security basis:
- MXT has remained well supported, trading closest to its NAV vs other credit LITs. Whilst the quantitative optics are not undervalued like in March, strategic (>12 month) exposure, to a diversified portfolio of corporate loans, remains attractive on a risk-adjusted carry basis.
- NBI trades marginally under our lower bound. Neuberger Berman has a long track record in high yield bonds and cash distribution performance is indicative of this. Possibility remains to take advantage of capital upside. This is not risk-free, high yield bonds are sub-investment grade for a reason. However, global diversification mitigates idiosyncratic risk.
- QRI sits inside our implied price range. The impact to the Australian economy and housing remain difficult to forecast. Whilst comfortable with the security, we would opt to be more opportunistic before accumulating further. Buyback currently has been all tip and no iceberg, so we want to see further action here if the cash proportion of the portfolio increases.
- KKC trades marginally under our lower bound, indicating opportunistic value may be present. With a thin buyback worth $1.5 million at an average price of $1.97 completed, we expect more quantum and consistency of on-market buybacks should trading at a discount to NAV continue. With a high proportion of CCC assets, this is a high-risk strategy despite the GCOF track record. We want to see consistency in cash distributions. Not ideal as an income product currently.
- PGG trades with the best quantitative optics based on our implied target range, sitting 12% under our lower boundary for implied price. PGG has been consistent in paying high cash distributions, however, that is because leverage has increased both returns and risk. With the Fed underwriting investment grade, and in some cases sub-investment grade credit markets, systemic risk seems tempered. NAV has fallen considerably since February. Opportunity remains to lower unit average cost.
- GCI sits inside our implied price range. Like QRI, impact to local economy and housing is difficult to grasp. We remain comfortable with the security and positively note the tack to increasing prime RMBS exposure. For a weighted average investment grade product, the running yield is attractive.
- PCI trades under our lower boundary for implied price by a meaty 7%. Value is present here for opportunistic and strategic investors in a portfolio that is largely investment grade. Higher concentration to Australian credit market than peers.
- We note the exclusion of Metrics managed MOT, due to an outdated analysis compared to our current quantitative methodology. MOT, whilst risker than its cousin MXT, (1) trades at a more significant discount to NAV and (2) has a higher cash distribution rate.
^Note the published LIT Up in Flames? contained an editing error for NBI, stating discount to implied capital upside was 46%. This should be 86%. Figure 2 in LIT Up in Flames? correctly identified this NBI implied price of $1.75, representing an 86% implied capital upside figure ($1.75/$0.92).
About BondAdviser
BondAdviser is a leading provider of credit research, data, investment management and advisory services. Drawing on deep expertise, we work in partnership with clients to guide them through the challenges global credit markets can present. Unaligned to any financial services organisation, our clients trust us for our unbiased research, insights and advice. All underpinned by our proprietary data and rigorous analytical processes.Click here to visit our website.
Never miss an update
Enjoy this wire? Hit the ‘like’ button to let us know.
Stay up to date with my current content by
following me below and you’ll be notified every time I post a wire
As Head of Investment Solutions, Charlie is a portfolio manager for BondAdviser’s SMAs, IMAs and model portfolios. He is a voting member of BondAdviser’s Investment Committee, and Credit Committee.
........
General Disclosures
BondAdviser has acted on information provided to it and our research is subject to change based on legal offering documents. This research is for informational purposes only.
This information discusses general market activity, industry or sector trends, or other broad-based economic, market or political conditions and should not be construed as research or investment advice.
The content of this report is not intended to provide financial product advice and must not be relied upon as such. The Content and the Reports are not and shall not be construed as financial product advice. The statements and/or recommendations on this web application, the Content and/or the Reports are our opinions only. We do not express any opinion on the future or expected value of any Security and do not explicitly or implicitly recommend or suggest an investment strategy of any kind.
The content and reports provided have been prepared based on available data to which we have access. Neither the accuracy of that data nor the methodology used to produce the report can be guaranteed or warranted. Some of the research used to create the content is based on past performance. Past performance is not an indicator of future performance. We have taken all reasonable steps to ensure that any opinion or recommendation is based on reasonable grounds. The data generated by the research is based on methodology that has limitations; and some of the information in the reports is based on information from third parties.
We do not guarantee the currency of the report. If you would like to assess the currency, you should compare the reports with more recent characteristics and performance of the assets mentioned within it. You acknowledge that investment can give rise to substantial risk and a product mentioned in the reports may not be suitable to you.
You should obtain independent advice specific to your circumstances, make your own enquiries and satisfy yourself before you make any investment decisions or use the report for any purpose. This report provides general information only. There has been no regard whatsoever to your own personal or business needs, your individual circumstances, your own financial position or investment objectives in preparing the information.
We do not accept responsibility for any loss or damage, however caused (including through negligence), which you may directly or indirectly suffer in connection with your use of this report, nor do we accept any responsibility for any such loss arising out of your use of, or reliance on, information contained on or accessed through this report.
© 2020 Bond Adviser Pty Ltd. All rights reserved.

1 topic
8 stocks mentioned

As Head of Investment Solutions, Charlie is a portfolio manager for BondAdviser’s SMAs, IMAs and model portfolios. He is a voting member of BondAdviser’s Investment Committee, and Credit Committee.
As Head of Investment Solutions, Charlie is a portfolio manager for BondAdviser’s SMAs, IMAs and model portfolios. He is a voting member of BondAdviser’s Investment Committee, and Credit Committee.
Comments
Comments
Sign In or Join Free to comment