TOL - 2nd Jul, 2026
4 ASX stocks we like despite the macro uncertainty
We believe the widening valuation gap between large and small caps has created compelling opportunities. Here are four high conviction ideas
 Add us as a preferred Google source
This wire was prepared by Robert Gregory (Portfolio Manager) and Rushil Paiva (Senior Equity Analyst) at Glenmore Asset Management.
Volatility in global markets has been rife in recent months, fueled by geopolitical tensions, erratic policy setting, AI-driven disruption and inflationary pressures leading to shifts in global interest rate expectations.
This has culminated in ASX-listed large caps outperforming small-mid caps, as investors sought their perceived safety in an uncertain environment. Figures 1 & 2 show that movements in the ASX 50 over the past 3 years have been predominantly driven by P/E multiple expansion, coupled with minimal positive revisions to earnings growth. On the other hand, the ASX Small Ordinaries Index (‘Small Ords’) has seen its P/E multiple compress despite forecasted earnings growth remaining strong.


Historically the Small Ords has traded at a premium relative to the ASX 50, due to its higher earnings growth profile. However, following recent market movements, the Small Ords is currently trading at a -9% discount. This is despite having a forecasted +27% earnings growth over the next year vs an expectation of ~2% for the ASX 50.
Over the last 20 years, when the Small Ords has traded at a -15% discount to the ASX 50, returns over the subsequent months have favoured small caps, as per the following:
- 3 Months: +2.5% to +4.0% - Initial "catch-up" trade as risk appetite returns.
- 6 Months: +6.0% to +9.0% - broadening of market participation beyond large-caps.
- 12 Months: +12.0% to +18.0% - re-rating of small-cap multiples to historical averages.
With this in mind, we believe the recent underperformance has created some interesting opportunities within the small-mid space. The Glenmore Australian Equities fund is style neutral, meaning we believe stocks can be undervalued due to underappreciated growth prospects or be cheap on conventional metrics. We apply a strong quality filter during our due diligence process and typically search for companies with durable business models, strong management teams and robust profitability and cash flow generation.
Arena REIT (ASX: ARF)
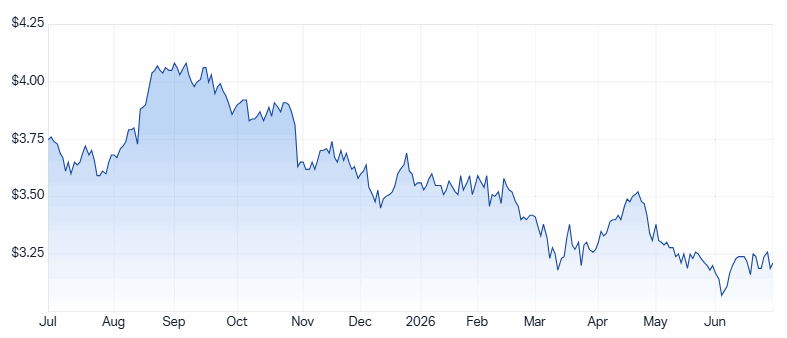
ARF is an internally managed Australian real estate investment trust that develops, owns, and manages social infrastructure properties, primarily early learning centres (ELC) and healthcare facilities. ARF owns ~270 childcare centres across Australia. The company provides investors with income through long-term, inflation-linked leases with operators in essential service sectors. Charter Hall Social Infrastructure REIT (ASX: CQE) is a peer on the ASX although has less pure childcare exposure at ~65% of its portfolio.
ARF is a stock that has been held by the fund for significant amounts of time over the nine years of the fund’s life, with our buying or selling typically driven by valuation rather than changes to the company’s fundamentals.
What first attracted us to ARF?
- ARF as the landlord, has what we view as very high-quality leases, known as “triple net” where the tenant pays rent plus three major operating expenses: property taxes, building insurance and maintenance/repairs – resulting in rental revenue being able to be essentially fully passed through as distributions to ARF shareholders
- Favourable lease structure, with ~95% of FY26-29 rent reviews contracted to CPI, higher of CPI, an “agreed fixed amount” or market reviews. Historically this has led to distribution growth of +3-5% p.a.
- Long life leases – portfolio WALE (weighted average lease expiry) of ~17 years
- Low gearing – ARF’s gearing is ~23% allowing plenty of capacity to fund new developments
These positive attributes above have resulted in ARF consistently delivering superior distribution growth relative to its ASX REIT peers.
ARF currently has a 29 project ELC development pipeline (forecast total cost of $228m) which helps boost earnings growth. ARF prefers to develop ELC’s internally rather than acquire existing ELC’s in an auction process. The company targets a weighted average initial yield on cost of 6.0%, which is around a 50-60 basis points spread over the existing ARF portfolio yield of 5.4%.
The fund exited ARF in September 2025 on valuation grounds when the stock price reached ~$4 (~15% premium to its NAV at the time of $3.46), however with the stock price falling to ~$3.30 recently, we have re-entered the stock which is now a significant holding for the fund.
Figure 3 below shows ARF’s stock price versus its net asset value over the last 10 years.

Valuation
As at 31 December 2025, ARF’s NAV was $3.64, which compares with the current stock price of $3.30, hence the stock is trading at a ~10% discount to NAV. Historically ARF has traded at a premium to its NAV due to its favourable characteristics we have discussed above, so it is an interesting point currently.
At a stock price of $3.30, ARF trades on FY27 PE of 15.7x and a distribution yield of 6.1%. We expect the distribution to grow between 3-5% per annum over the next three years.
We believe the stock price has fallen in recent months due to two factors: the rise in inflation in Australia (with flow-on implications for higher interest rates), and the recent negative developments around weak occupancy and also child safety in childcare centres.
Whilst the rise in interest rates is largely cyclical and should ease once Australian CPI is back within the targeted 2-3% range, the issues of child safety are more important for the sector, as there have been declines in occupancy levels in the last 12 months, industry-wide.
In terms of the current headwinds facing childcare operators, there is no doubt they are quite significant:
- Increased costs due to inflationary pressures, in particular wage costs (staff costs are 50-60% of the cost base of a childcare centre)
- Cost-of-living pressures (eg, interest rates, petrol prices) have resulted in parents being more cost-conscious with regard to childcare
- Increased supply of long day care centres
- Falling birth rates
- Parent confidence has been impacted by serious child safety incidents
We believe the above issues facing childcare operators are significant but manageable, particularly given that the industry is an essential service for so many Australian families and, as a result, likely to continue to receive material government support.
In summary, we believe ARF as a landlord is well positioned to continue to collect rent and pay that out as distributions to its shareholders in a reliable and consistent manner. The current discount to NAV screens attractively given ARF has historically traded at a premium to NAV.
New Hope Coal (ASX: NHC)
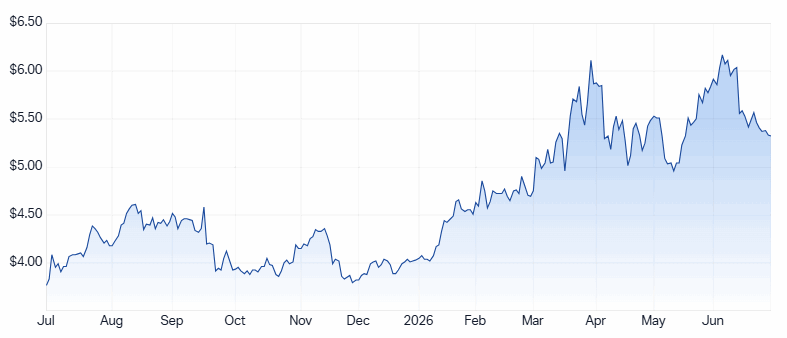
NHC is an Australian-based resources company with two operating thermal coal mines, 80% owned Bengalla (NSW) and 100% owned New Acland (QLD). CEO Rob Bishop has been at NHC since 2019 and CEO since 2022. We believe board and management quality are very strong.

In our view, the key positive attributes of NHC’s mines are:
- Low cost
- Bengalla has an FOB cash cost (ex royalties) of ~A$81/t
- New Acland – FOB cash cost (ex royalties) of ~A$100/t, moving down towards A$95/t in the next few years
- Long mine lives
- Bengalla – tier 1 asset with a +25 year mine life
- New Acland – mine life of 12-15 years
Whilst NHC’s two operating mines produce thermal coal, the company also has a 26% interest in the Malabar coking coal project (QLD). Malabar will be an underground coal mine, which once in production, should add to NHC’s growth profile. These low-cost, highly cash-generative mines have allowed NHC to be a very strong dividend-paying company, which is a key attraction of the company.
In looking at consensus forecasts for the thermal coal price, most broking firms and investment banks have quite conservative prices factored into their earnings forecasts. Currently, the spot thermal coal price is ~US$140/t, whilst consensus forecasts for the next three years are more in the range of US$100/t to US$120/t.
Whilst in the very long-term it is reasonable to assume thermal coal’s share of the energy mix declines, we believe it is likely to remain a key source of base load power for at least the next 5-10 years. Given the lack of meaningful supply globally, combined with steady demand (particularly from Asia), a rally in prices from current levels would not be a surprise.
In addition, from an investor sentiment perspective, on the ASX, thermal coal, in our view, is a relatively unloved commodity in contrast to more exciting commodities such as uranium, copper, lithium, and gold.
This all plays into an attractive backdrop where if the thermal coal price performs strongly, the stock prices of producers such as NHC could react very favourably.
Cuscal (ASX: CCL)
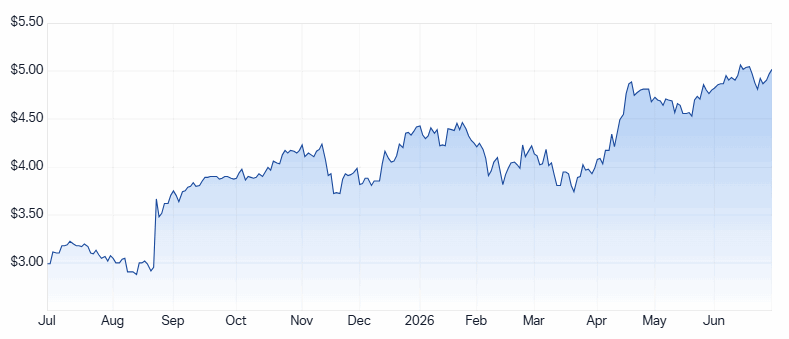
Cuscal is a core holding in the portfolio due to its unique combination of defensive characteristics coupled with a strong growth outlook. We believe this will result in it performing as a steady long-term earnings compounder.
By way of background, the company provides a link between payment rails (e.g. the likes of Visa and Mastercard) and banking institutions and merchants. In this context, the services it provides are both essential and complex, creating a sticky customer base (that has seen <1% revenue churn over the past 4 years) and defensive earnings profile.
Whilst the company has only been listed on the ASX for less than two years, it has a long history dating back to 1966. In this context, we see it as having a very well-established business model and has cemented itself as the largest B2B payments infrastructure company in Australia, outside of the Big 4 banks.
In saying that, the company has hit the ground running as a listed entity via the highly synergistic acquisition of its smaller competitor, Indue; and the recently completed acquisition of Paymark, which materially accelerates its expansion in New Zealand.
We expect the company will be able to sustain high single-digit to low double-digit organic growth over the medium-term, further supplemented by recent acquisitions.
Whilst having attractive defensive characteristics, we forecast CCL to achieve a 3-year EPS CAGR of >18%, which is more than double the projected EPS growth rate of the ASX 300 Industrials Index (~7% p.a.) over the same period. Despite this, CCL trades on a forward 12-month multiple of ~18x vs ASX 300 Industrials at ~20.0x. In this context, we believe CCL’s growth profile provides justification for a longer-term re-rating.

Shape Australia (ASX: SHA)
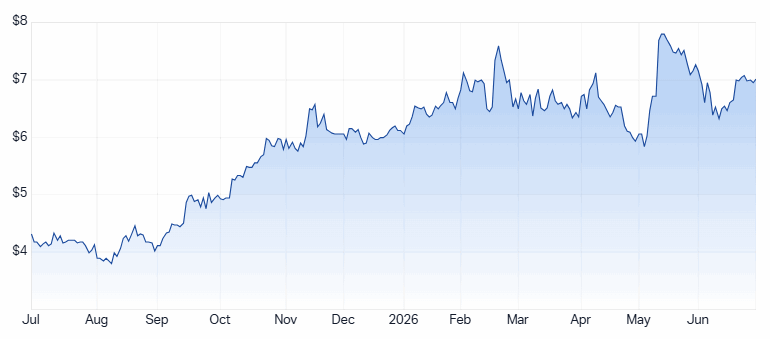
Shape Australia Corp is the market leader in the Australian commercial fit-out and refurbishment sector. The business was founded over 35 years ago and produced an enviable track record of consistent revenue and profitability growth. Despite being the market leader, SHA’s market share remains below 10%, highlighting the long runway of growth that remains.
In our view, SHA has a clearly differentiated operating model relative to its listed peers (including soon-to-be-listed FDC Consolidated). SHA’s core fit-out and refurbishment segment is supported by a resilient cycle of commercial lease expiries, which provides more predictable project volumes relative to many other construction sectors.
The nature SHA’s work tends to have a short duration, with close to ~88% of contracts completed in under 12 months, providing protection against cost escalation risks. In addition, ~85% of its work is completed inside buildings and therefore not exposed to the weather-related risks that have consistently hampered other contractors over time.
Over the past 5 years, SHA’s business has grown exponentially. The company is guiding to FY26 revenue of $1.175b - $1.225b, which at the mid-point is equivalent to nearly double the level recorded in FY22. We expect FY26 earnings to be more than triple the level achieved in FY22, highlighting the material margin expansion over the same period. Looking forward, we expect this trend to continue, supported by a near record high backlog of $680m, further expansion into higher margin sectors (such as Modular construction) and accretive M&A.
SHA operates a capital-light business, producing strong free cash flow generation and a sector-leading Return on Equity of 62% (vs the peer average of 26% in FY25). Its balance sheet remains rock solid, having over $136m of cash and marketable securities as at 31 December 2025, leaving it well placed to execute upon further accretive transactions.
Taking these factors into account, we forecast SHA to achieve a 3-year EPS CAGR of >10% (between FY26-29). The company currently trades on an FY27 cash adjusted P/E of ~12.5x, which we view as undemanding given its strong projected earnings growth and balance sheet position.

Never miss an update
Enjoy this wire? Hit the ‘like’ button to let us know.
Stay up to date with my current content by
following me below and you’ll be notified every time I post a wire
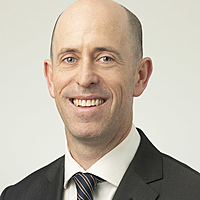
Robert is the founder and Portfolio Manager of Glenmore Asset Management, which commenced in 2017. The Glenmore Australian Equities Fund is a long only fund focussed on investing in high quality businesses for the long term. Since inception in 2017, the fund has returned ~17% per annum (net of fees) and has been consistently one of the top performing funds in Australia.
........
Glenmore Asset Management Pty Ltd (“Glenmore AM”), [ABN 87 608 172 014 (AFSL 485 588)] believes the statements contained in this document, to the extent it is aware, to be reliable & accurate at the time of its production. However, the information in this document is general in nature and does not take into account your personal circumstances, financial needs or objectives. Statements contained in this document are not general or personal advice and should not be considered as a recommendation in relation to an investment in the Fund or that an investment in the Fund is a suitable investment for any specific person. You should seek independent financial/legal advice and read this presentation in conjunction with the relevant Information Memorandum available on our website prior to acquiring a financial product. Glenmore AM, its directors and employees do not accept any liability for the results of any actions taken or not taken on the basis of information contained in this document, or for any negligent misstatements, errors or omissions.
.jpg)
4 topics
5 stocks mentioned
1 fund mentioned
1 contributor mentioned
.jpg)
Robert is the founder and Portfolio Manager of Glenmore Asset Management, which commenced in 2017. The Glenmore Australian Equities Fund is a long only fund focussed on investing in high quality businesses for the long term. Since inception in...
Expertise
Robert is the founder and Portfolio Manager of Glenmore Asset Management, which commenced in 2017. The Glenmore Australian Equities Fund is a long only fund focussed on investing in high quality businesses for the long term. Since inception in...
Expertise
Comments
Comments
Sign In or Join Free to comment