A better way to size up income funds

Alwyn Hung
Mason Stevens
Selecting investments solely on return falls squarely into the “buyer beware” bucket. However, when comparing the plethora of fund investment opportunities in the market, the majority of us tend to focus solely on historic investment performance to rank each of the available investment opportunities.
It is easy to fall into the trap of not paying much regard to the scope of the investment mandate, types of investments that make up a fund’s portfolio, and the risks associated with each investment and the portfolio as a whole. Seth Klarman, CEO & PM of Baupost Group, put it well when he said:
“Most investors are primarily oriented toward return and how much they can make but pay little attention to risk and how much they can lose”
When seeking to align investment objectives, historic IRR must be considered together with investment risks (versus return expectations) and the investment time horizon, in the context of the investor’s broader investment objectives.
While other considerations need to be assessed, there are two important quantitative measures that provide further insights as to the risk tolerance of the investment opportunity, as well as its likely behaviour under different market conditions.
They are the fund’s Standard Deviation and a risk-adjusted return measure, with the Sharpe Ratio being the industry-standard measure.
A fund’s Standard Deviation is a measure of price dispersion. That is, the dispersion of a fund’s historic unit prices or net asset values. The higher the standard deviation, the more vulnerable the fund is to erratic performance, as underlying investments, individually and collectively, tend to exhibit more volatile behaviour. This is important to an investor that has limited tolerance to capital loss as well as being a factor when considering both the time horizon and timing of an investment.
The Sharpe Ratio is calculated as the average return earned in excess of the risk-free rate per unit of volatility or total risk, where volatility can be measured through the portfolio’s Standard Deviation. The Sharpe Ratio allows an investor to effectively compare different investment opportunities on a like-for-like basis.
This is even more important when evaluating fixed income funds
The importance of a fund’s Standard Deviation and Sharpe Ratio when assessing an investment opportunity is no more evident than when evaluating the broad range of fixed income funds available to an investor.
Unlike for equities where fund research houses are able to sub-categorise funds within the asset class, fixed income funds tend to be lumped under a single category. Therefore, when an investor looks at IRR as the sole performance criterion, they are often not comparing each fund on a level playing field.
Why? Because the fixed income asset class is one of the broadest asset classes in the market, resulting in varying investment mandates and strategies.
On one end of the spectrum, there are funds that solely concentrate on interest rates through investing in highly rated government securities.
At the other end of the spectrum, you could find a high-yield fund that looks at investing in small to medium cap companies and/or companies that have high levels of indebtedness (highly leveraged).
It is “chalk and cheese” comparing these two types of fund. The former has a direct link to the macro-economic environment, whereas the high-yield investment opportunity is linked to the performance of the specific companies in the portfolio.
The table below compares different types of fixed income funds and their 3-year IRRs, Standard Deviations and Sharpe Ratios:
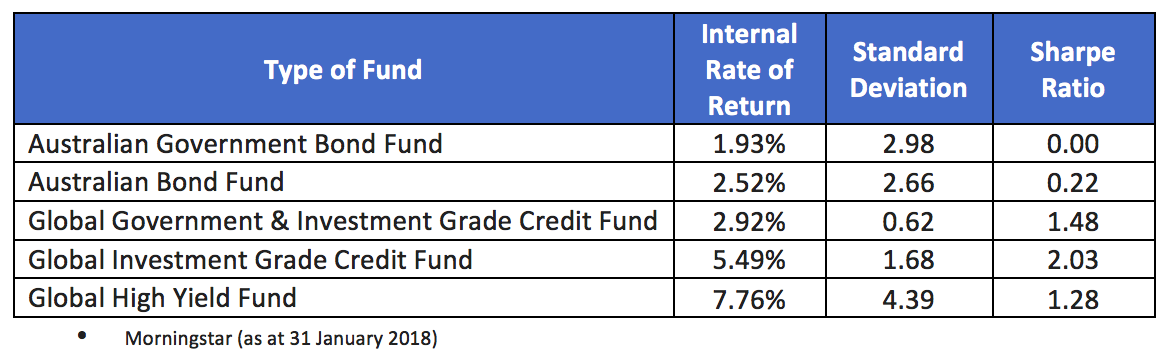
As can be seen from the table, while the Global High Yield Fund has performed best when only using IRR as the comparison, the volatility (or dispersion) of returns for this fund, as measured by Standard Deviation, is between 0.47x and 1.26x greater than its peer group, signaling a low level of return consistency and a higher level of investment risk.
This is not necessarily what an investor needs when investing in a defensive asset class such as fixed income.
Sharpe ratio tells the full story
A more revealing insight comes from comparing the risk-adjusted returns of each fund via their Sharpe Ratios.
When comparing the Global High Yield Fund to the Global Investment Grade Credit Fund, for example, the performance of the latter fund is far greater on a risk-adjusted basis (i.e. its Sharpe Ratio is much higher).
In other words, the higher 3-year IRR performance of the Global High Yield Fund does not justify the additional risk relative to the lower risk investment-grade only funds.
Being oriented only towards return doesn’t paint a complete picture. “Buyer beware” applies if you use only IRR as your sole investment selection criteria.
Never miss an update
Enjoy this wire? Hit the ‘like’ button to let us know.
Stay up to date with my current content by
following me below and you’ll be notified every time I post a wire
Alwyn has more than 20 years’ finance and a strong track record developed during senior roles at Dixon Advisory, HSBC and ABN AMRO Bank. Alwyn holds a Bachelor of Economics and Commerce from the Australian National University.

3 topics
Alwyn Hung
Portfolio Manager, Fixed Income
Mason Stevens
Alwyn has more than 20 years’ finance and a strong track record developed during senior roles at Dixon Advisory, HSBC and ABN AMRO Bank. Alwyn holds a Bachelor of Economics and Commerce from the Australian National University.
Alwyn Hung
Portfolio Manager, Fixed Income
Mason Stevens
Alwyn has more than 20 years’ finance and a strong track record developed during senior roles at Dixon Advisory, HSBC and ABN AMRO Bank. Alwyn holds a Bachelor of Economics and Commerce from the Australian National University.
Comments
Comments
Sign In or Join Free to comment
most popular
Equities
The Magnificent Seven can’t carry the market forever
Pzena Investment Management