Australian Housing: Don't Panic

Chris Rands
Yarra Capital Management
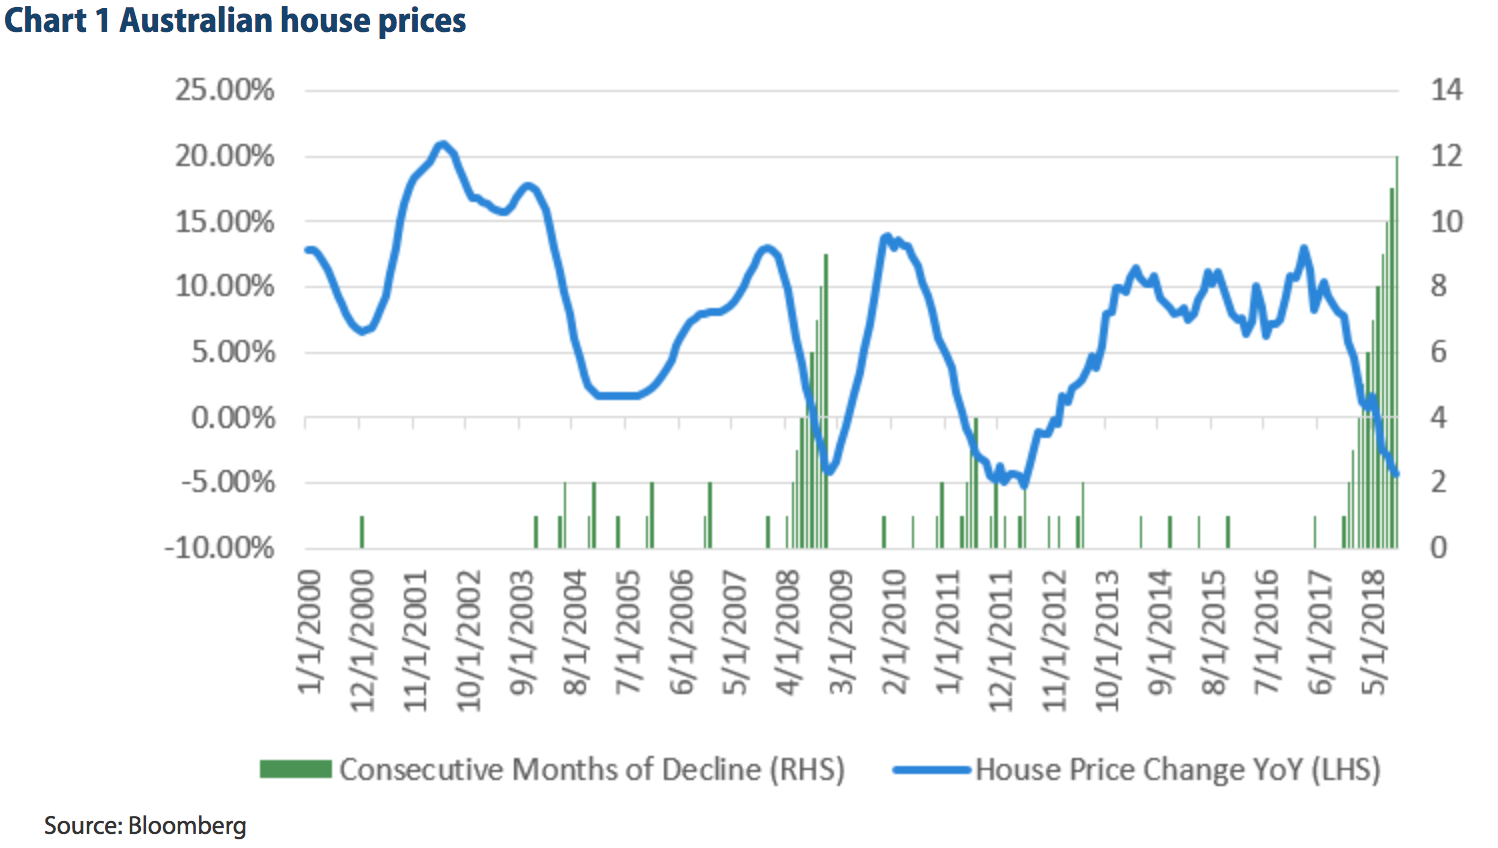
Over the past year, Australian house prices have seen 12 consecutive months of decline, the longest streak of persistent falls in over 20 years. House prices are now ~4% lower than this time last year — the weakest performance in the housing market since 2012.
While the performance of house prices has been poor, we don’t believe this is reflecting housing stress. Rather, it is due to tightening lending standards, which are constricting credit supply. While this means house prices can continue to fall over the next 12 months, it reduces the risk of a crisis occurring through the housing sector. To analyse this, we look at debt service ratios, prepayments, loan to valuations, arrears and household stress levels.
Debt service ratios
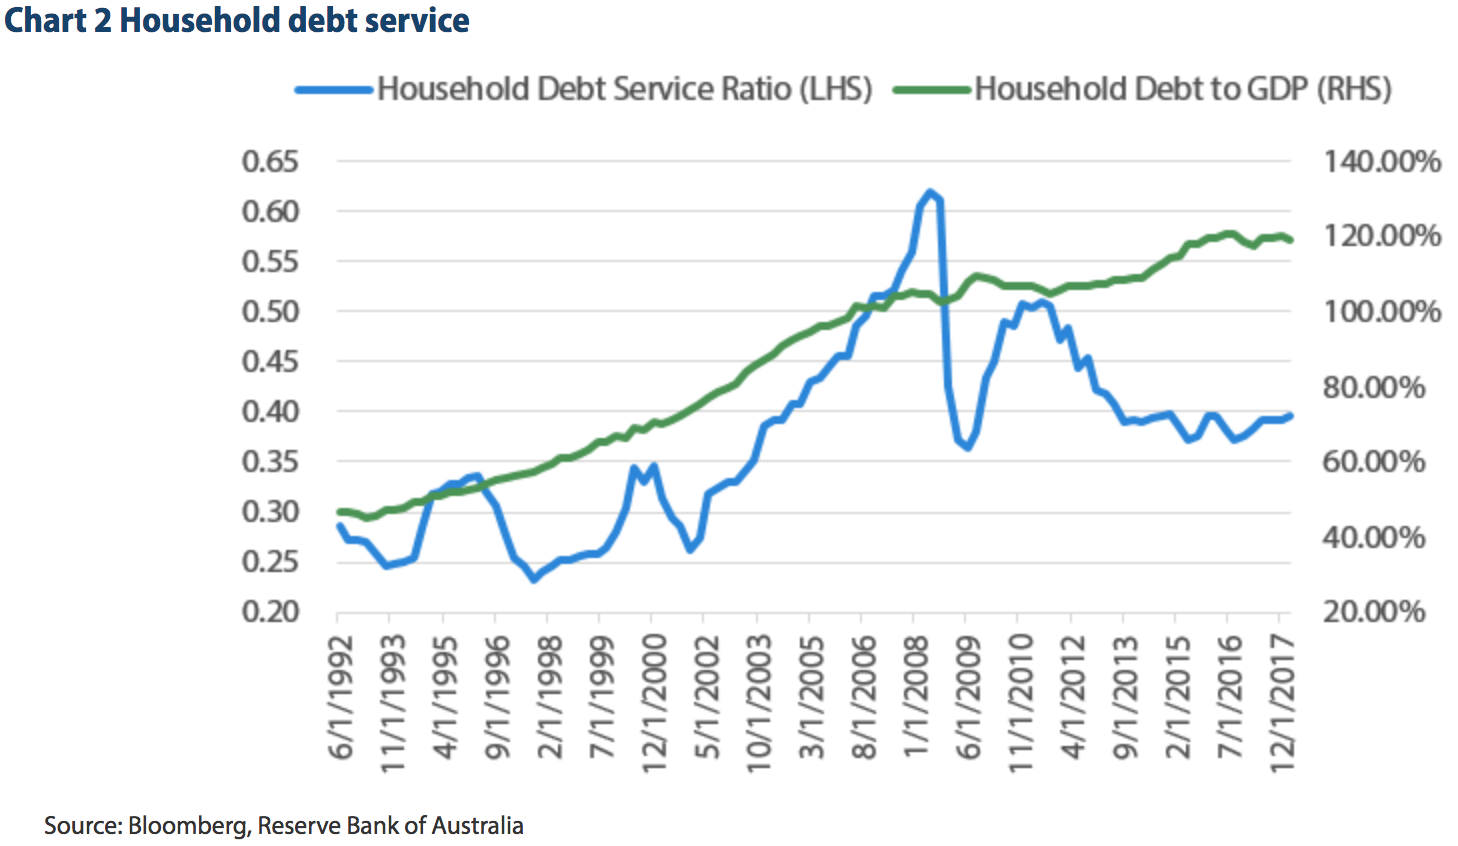
One of the most common criticisms of the Australian housing market is that it is funded by huge household debt. This is undoubtedly true as household debt is approximately 120% of Gross Domestic Product (GDP), which in the developed world, is only surpassed by Switzerland.
However, this measure by itself misses a key component of housing affordability — the rate of interest paid on that debt. While household debt levels are at historically high levels, the cost of servicing that debt is at an all-time low. This idea is captured in the debt service ratio of households, as shown in Chart 2 below. This ratio shows that while household debt is high, the ability to repay that debt is by no means stretched and that the household debt serviceability remains around the long-term average.
The Reserve Bank of Australia (RBA) echoed this message in their October 2018 Financial Stability Review: “Total payments as a share of income have remained broadly in line with their levels over recent years”. This means that while households are highly indebted, it is unlikely that they are struggling to repay what they owe in the current interest rate environment.
Prepayments and equity
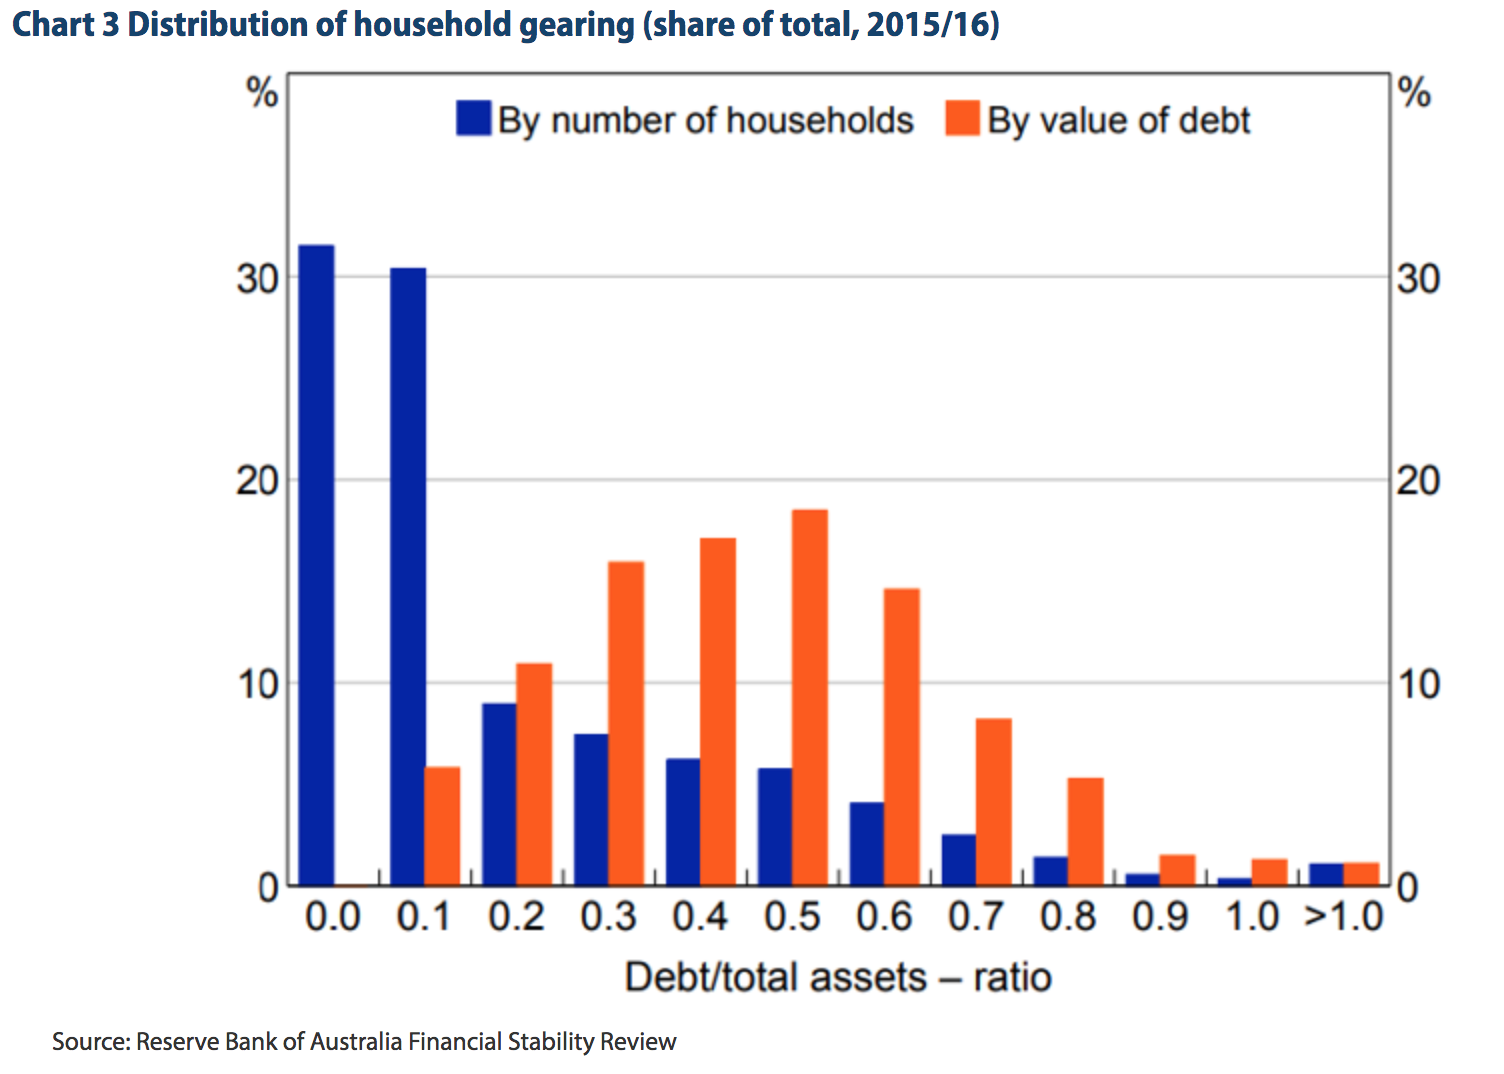
Given household debt service metrics remain around average levels, it is also important to look at the distribution of household debt to determine if vulnerabilities exist. One way to measure this is through loan-to-valuation ratios, which measure the level of debt compared to the value of the asset. Vulnerabilities here involve households with greater than 80% debt, with the households most at risk being those with over 100% debt, which results in negative equity.
From this perspective, the current distribution of debt looks relatively robust. RBA statistics show that only a small percentage of borrowers have loan-to-value ratios above 90%, while the majority (approximately 60%) have a loan-to-value ratio of less than 10%. This means the moderate declines we’ve seen in the housing market will not create a situation of negative equity for a meaningful share of borrowers. This situation differs from the United States in the mid 2000s, where loans where written at up to 120% of the housing value, creating a large vulnerability to even moderate declines in prices.
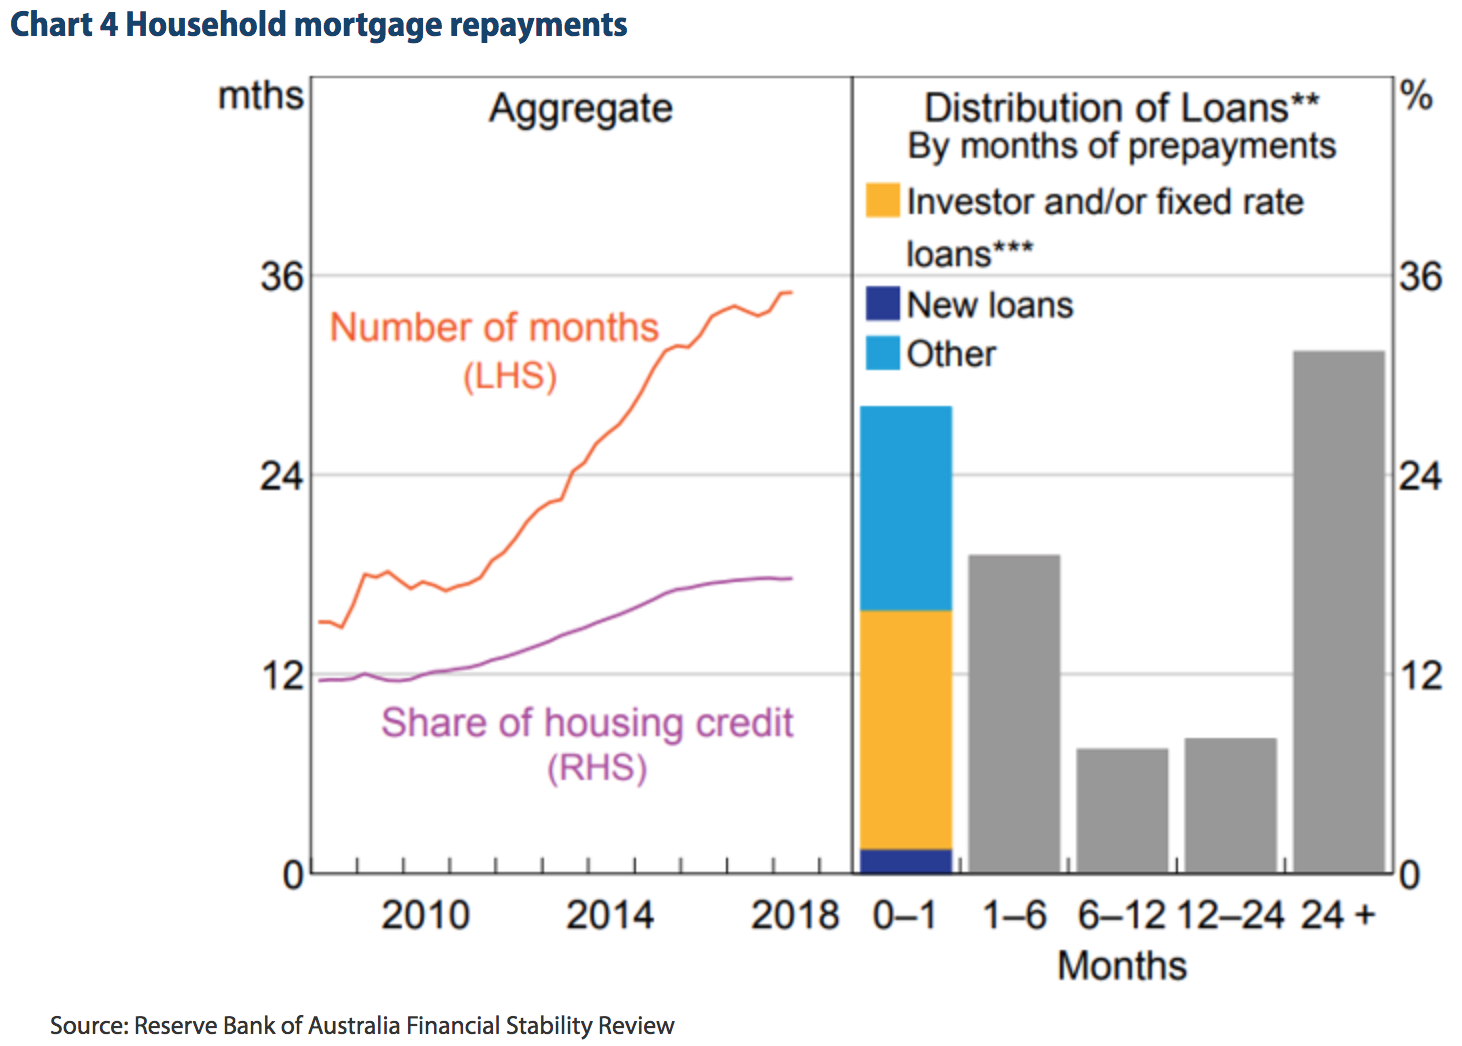
In addition to this, many households in Australia are ahead of their scheduled repayments. This is thanks to the floating nature of the Australian housing market — when interest rates fall, loan repayment amounts are not automatically adjusted downwards. This means households have the ability to repay principal outside their scheduled payments by maintaining the original payment amounts.
RBA statistics show that the average borrower is almost 36 months ahead of their required payments. Of the borrowers who are not ahead of schedule; approximately half are investors or fixed rate borrowers, who do not have the same incentives to repay ahead of schedule, and new loans that have not had time to accrue prepayments. This means for the vast majority of borrowers in Australia there remains considerable buffers against mortgage stress should their situation deteriorate.
Household stress and arrears
Overall, the combination of these statistics suggest that the decline in house prices in Australia is not a demand side or housing affordability problem, but potentially related to tighter lending standards coming through the banking sector. A signal of this is that there are no real signs of household stress or mortgage arrears.
The Australian Bureau of Statistics (ABS) releases a measure of financial stress using indicators on households such as ‘Unable to raise $2,000 in a week for something important’. While these statistics are not particularly timely, the 2016 results show that overall there are few signs of stress in households when compared with prior years.
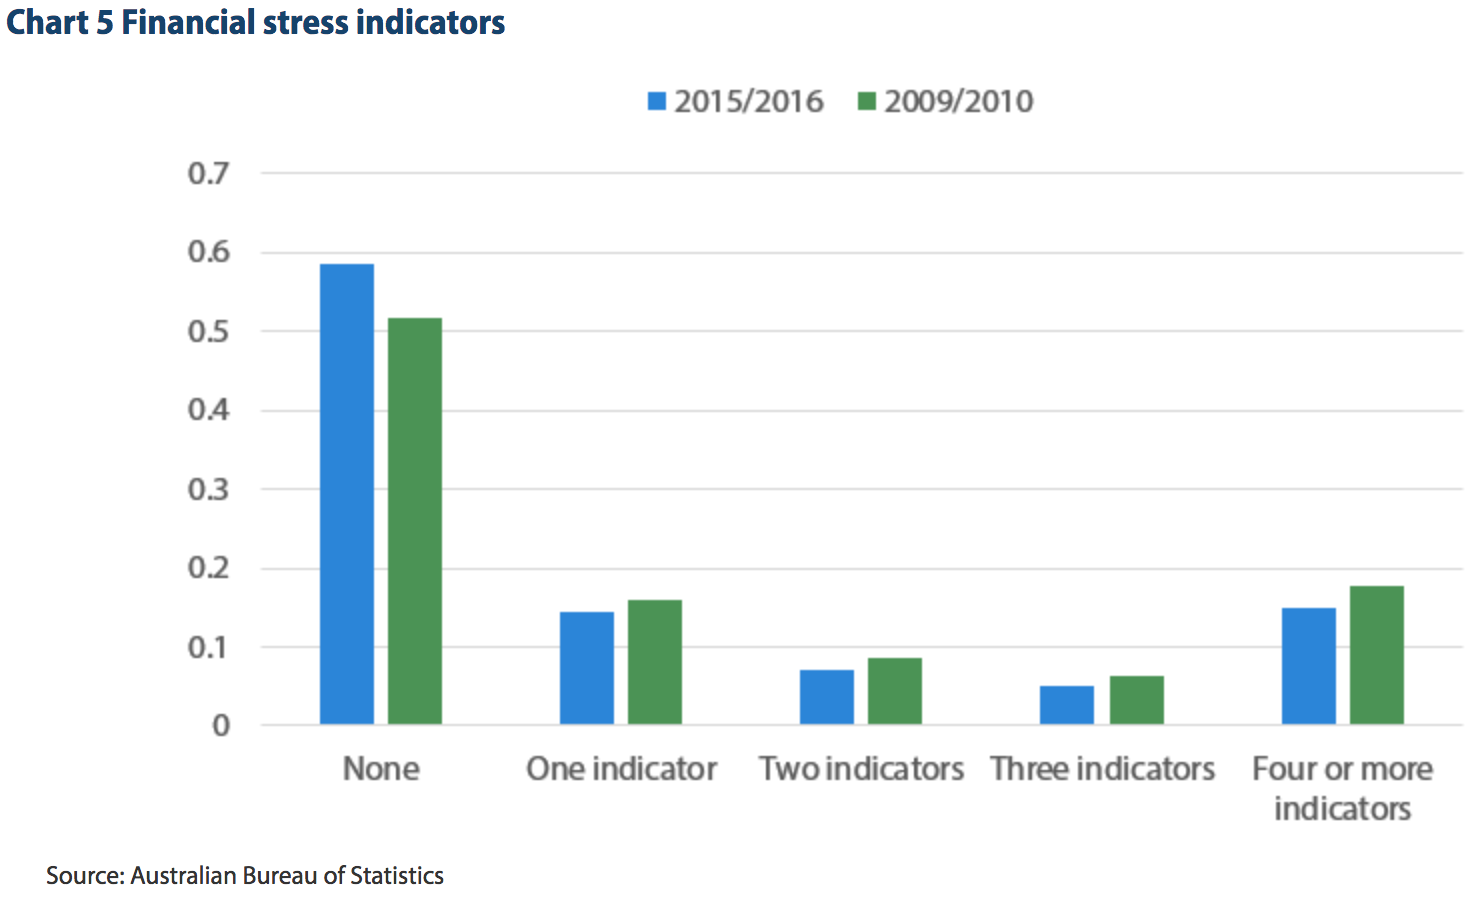
Since 2016, interest rates have fallen, unemployment has declined, growth has improved and house prices have increased, meaning there are few macroeconomic signals to suggest that household stress would have increased substantially since 2016.
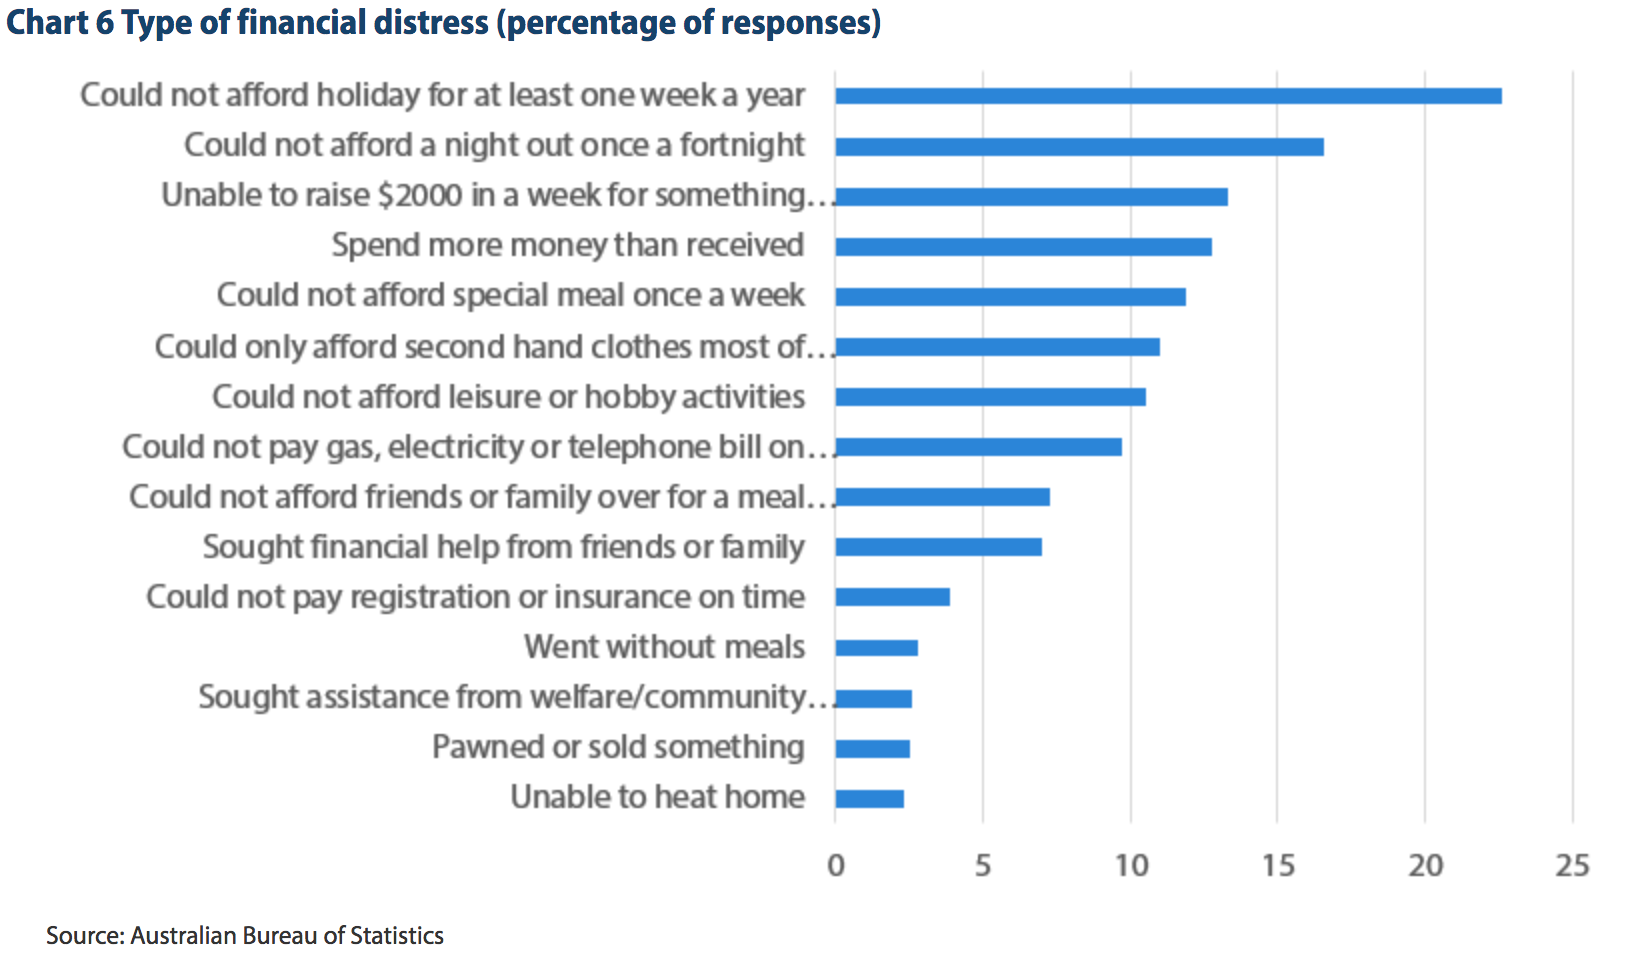
Breaking down the types of financial stress reinforces this point, as the largest percentage of stress shown is the inability to afford a holiday or a night out once a fortnight. While this is a serious issue and should not be treated lightly, it is somewhat comforting that the signs of stress are in discretionary spending categories rather than the necessities of life such as ‘Went without meals’ or was ‘Unable to heat home’.
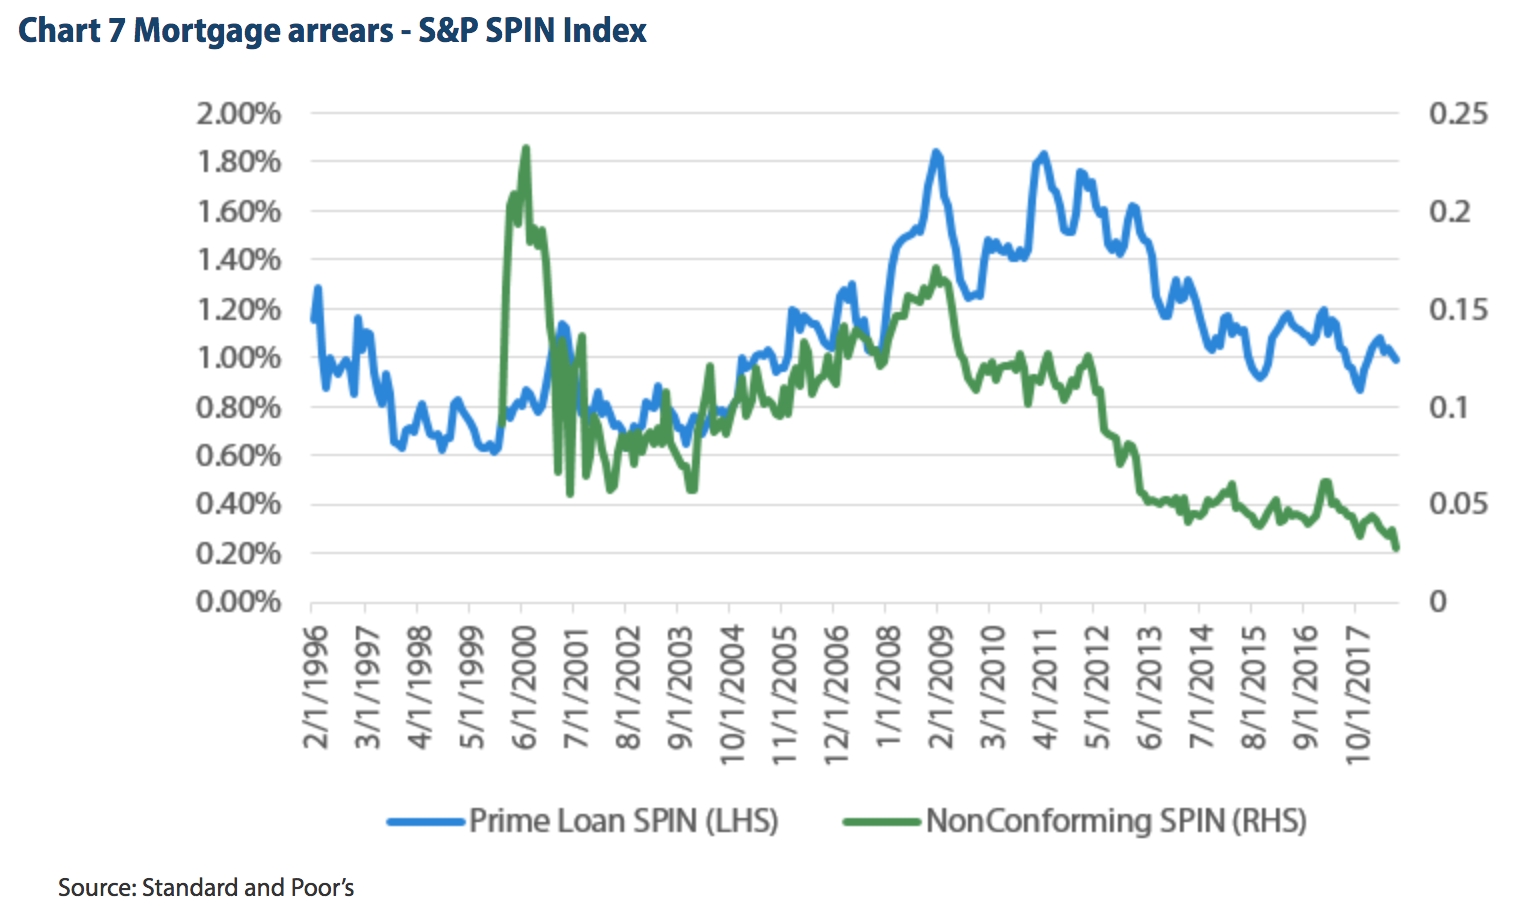
The low level of stress is also reflected in Australian arrears levels, which have been trending downwards over the past four years. Standard and Poor’s SPIN index shows the mortgage arrears for prime and non-conforming loans are well below the 2008 and 2012 levels, which were associated with the previous housing downturn. This highlights that Australian households are not struggling to meet the repayments on their loans, as described by the debt service metric.
Credit Supply
Given that households are not showing signs of stress, this raises the question: “What is causing the decline in house prices?” The most likely answer is that credit standards at banks have been tightening, restricting the flow of mortgage finance in the economy. This reduces the amount of borrowing that households can receive, leading to a lower budget for home purchases. There are two key drivers behind this change since 2017.
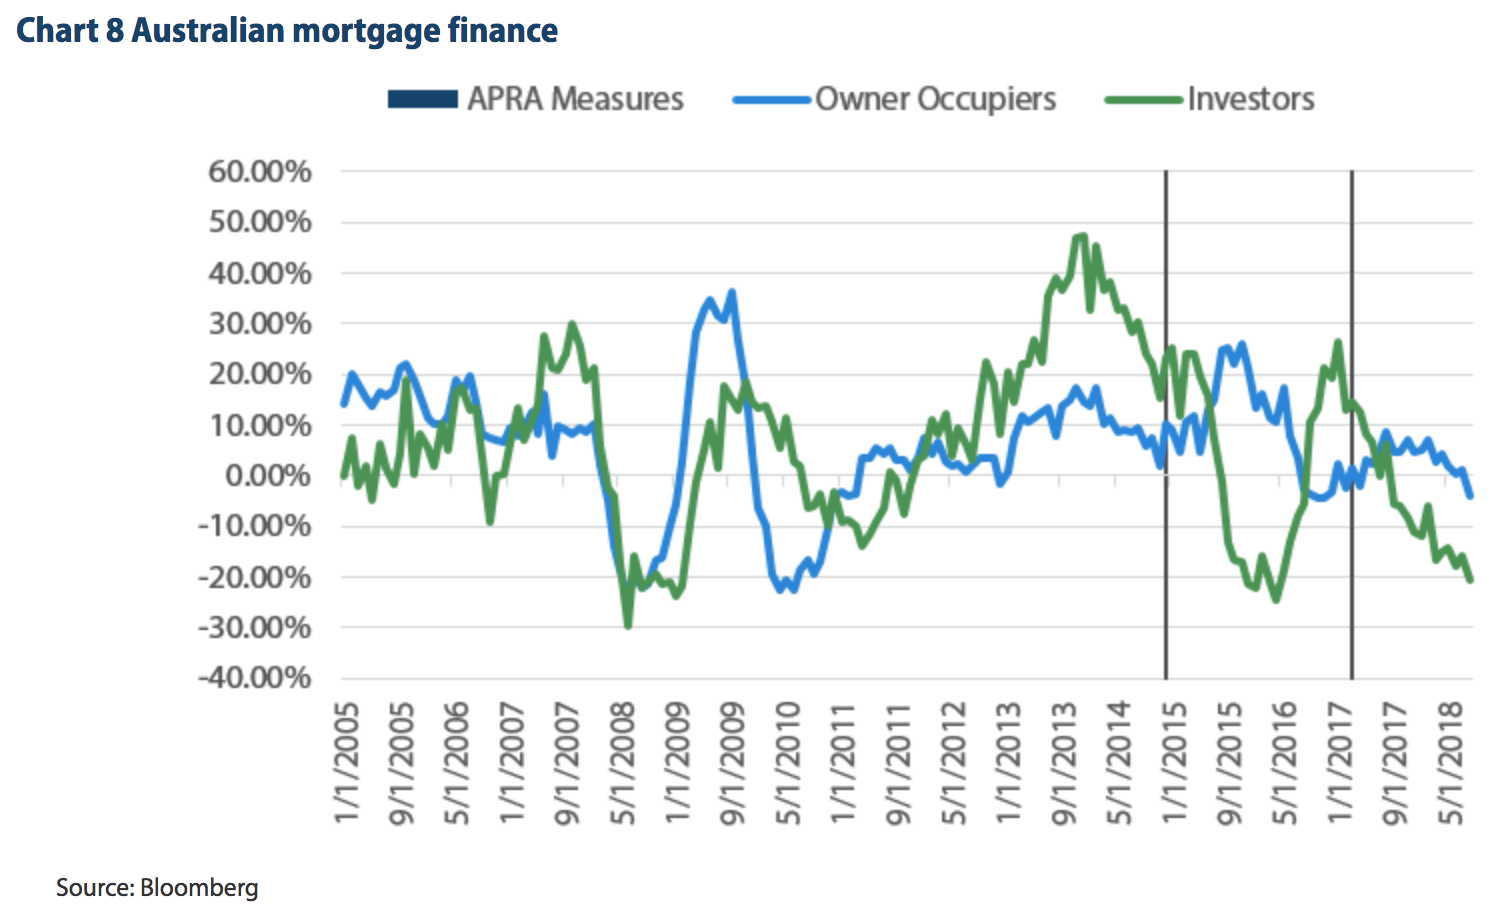
The first is that the Australian Prudential Regulation Authority (APRA) announced measures that were designed to slow the amount of investor lending in the Australian market. These measures were similar in nature to earlier changes made in 2014 that led to substantial declines in the amount of investor lending that banks made. A key difference now, compared to 2014, is that the prudential tightening has not been followed by an interest rate cut like it was in 2015. The interest rate cut in 2015 led to an increased demand for owner occupied borrowing, offsetting the decline in investment. The slowdown in investor lending has not been met with accelerating owner occupied finance.
The second factor is that the recently released preliminary findings from the Royal Commission into banking have added greater scrutiny to bank origination practices. One example was the finding into how banks substantiate borrower expenses (it is up to the banks to make reasonable inquiries to a consumer’s financial position before lending money). In the preliminary report the Royal Commission stated that “more often than not, each of ANZ, CBA, NAB and Westpac took some steps to verify the income of an applicant… But the evidence also showed that much more often than not, none of them took any step to verify the applicant’s outgoings”.
This sentence essentially puts the bank on notice that they need to improve their internal processes for determining the expenditures of a borrower, rather than just relying on a benchmark index such as the Household Expenditure Measure. Making these changes will mean that, on average, higher expenditure figures will be applied, reducing the amount of credit that a borrower can receive compared to just relying on a benchmark calculation.
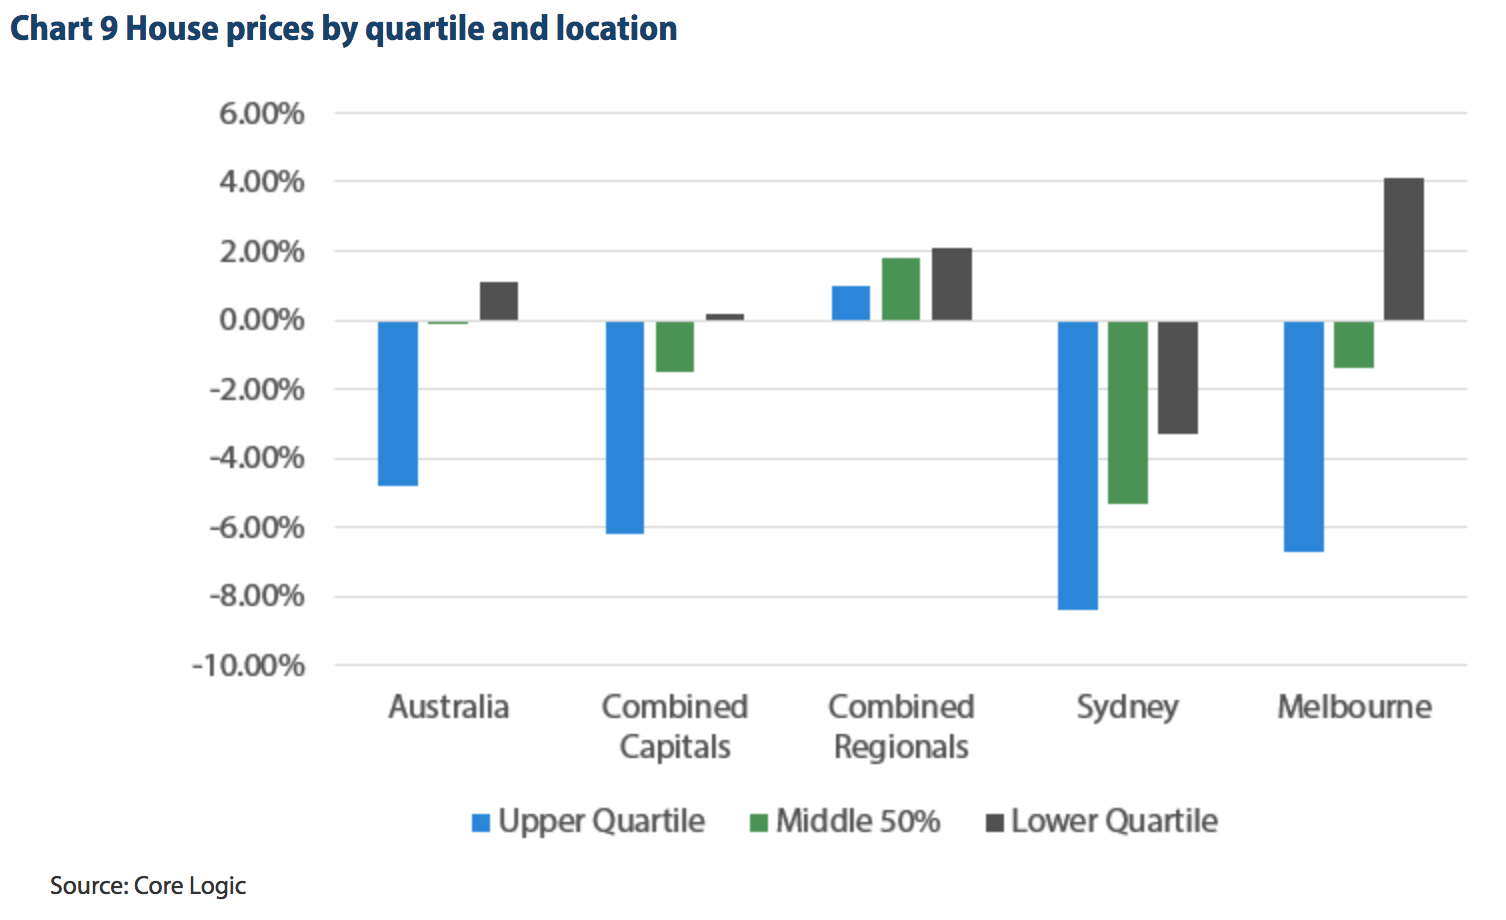
Overall, the combination of tighter oversight from APRA on investor lending and the spotlight placed on banking practices from the Royal Commission has meant that credit has become relatively tighter over the past 12 months. With lower levels of credit available, it has been the higher end of the market that has borne the brunt of the falling prices, as borrowers may not be able to finance quite as much as they could in the past. This idea can be seen in Chart 9 where the price effect is split into quintiles of the property market. The blue bars represent the upper quartile of the market with the largest declines. According to housing data provider Core Logic, the “weak housing market conditions across the most expensive quarter of properties in Sydney and Melbourne” is “a key driver of the housing downturn.”
The forward indicators
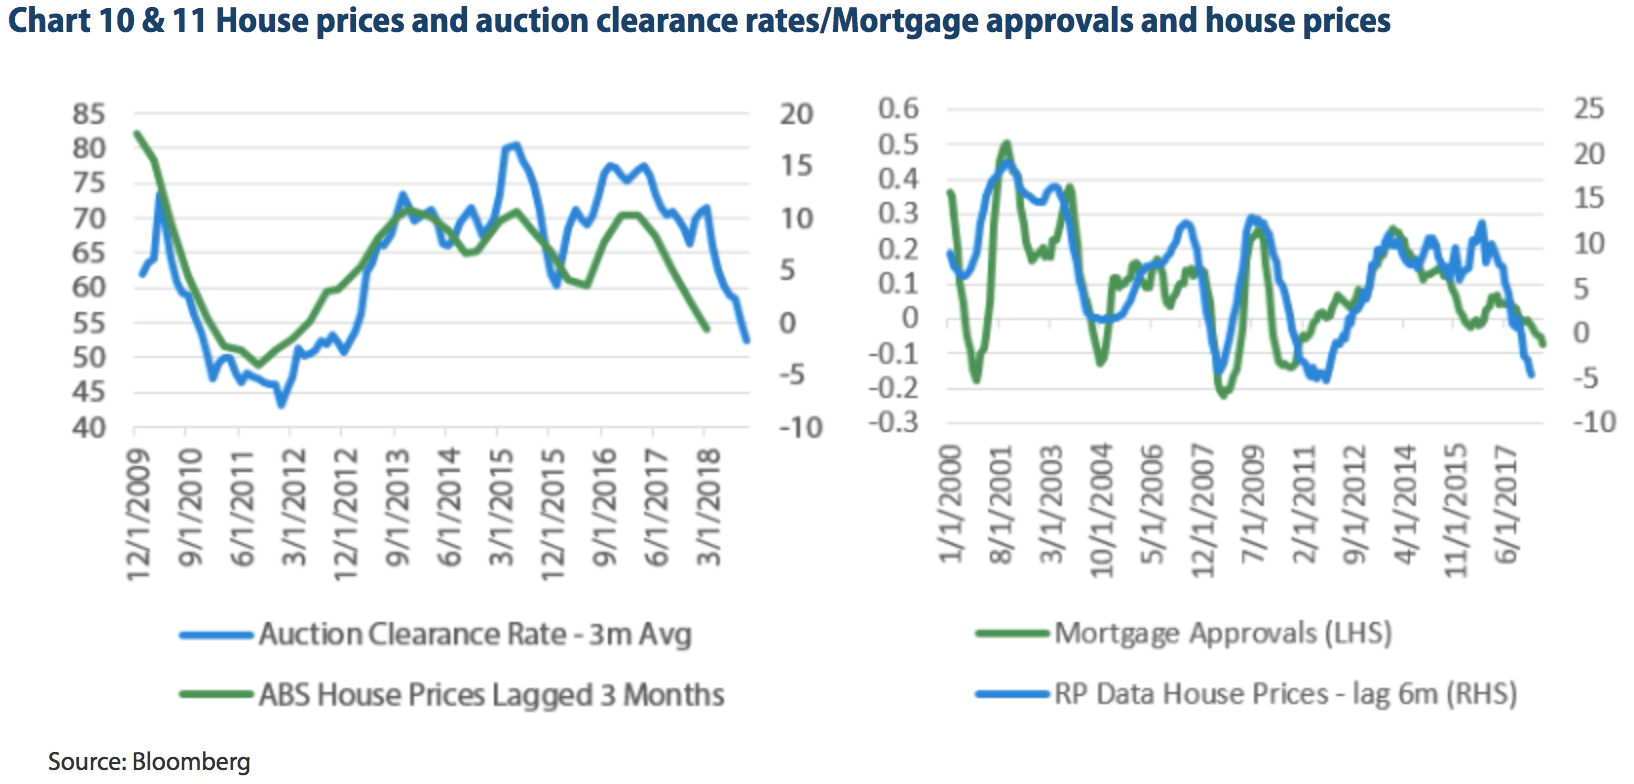
The upshot of this is that as long as credit conditions tighten then house prices can continue to decline, even though no household stress is yet evident. At the moment, forward indicators such as the level of mortgage financing and auction clearance rates have continued to fall and point to declining house prices in the near term. Over the past five years, whenever there were conditions similar to these, the RBA was cutting interest rates, breathing life into the housing market. This time round, however, the RBA seems inclined to sit on their hands, giving little incentive to forecast a quick rebound in these indicators and hence we expect softer prices next year.
What else could go wrong?
Since housing affordability currently looks fine, it is also prudent to ask: “What could go wrong for affordability?” To understand this question, it is best to look at the two key components used in the debt service metric: disposable income and the amount of interest paid. This creates two key risks that underpin this analysis: that either interest rates rise or disposable income falls.
Risk 1 - Interest rate rise
One of the biggest risks to the current situation is that interest rates rise quickly and cause the debt service metrics of households to decline rapidly. As shown below, even a 1.5% increase in interest rates is enough to take the economy wide debt service metric to levels which were associated with household stress in 2008 and 2012. Even small increases in interest rates could have outsized effects on the household sector.
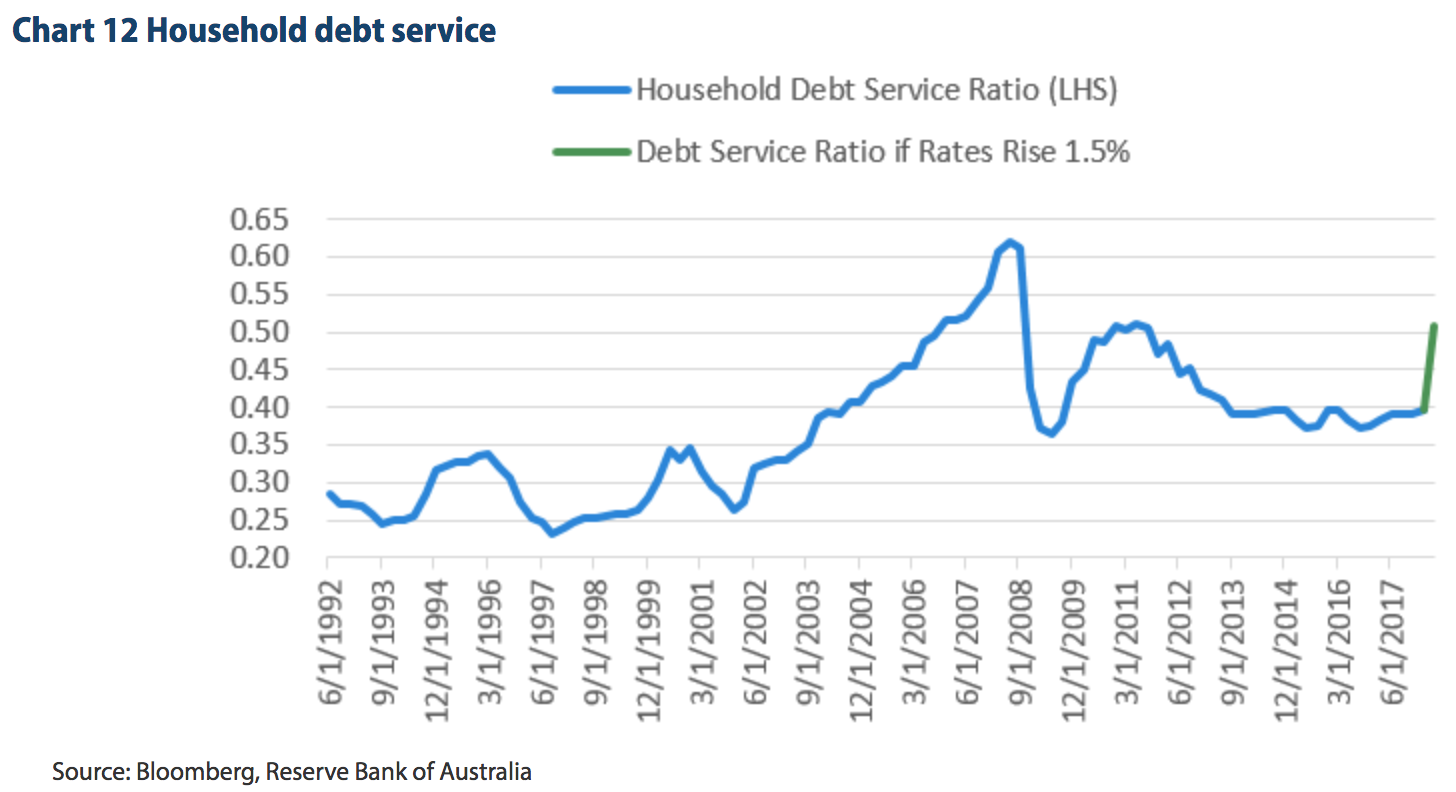
Despite the relatively small moves in interest rates needed to cause the debt service metric to deteriorate, this doesn’t look likely to occur over the short to medium term. The RBA remains in no hurry to increase interest rates and is aware of the risks that the household debt load poses. The above chart shows that even when the RBA is ready to raise rates they will likely be more cautious than in prior cycles, leading to slower cash rate increases. This creates an outlook for stable mortgage rates in the near term and means that while rising interest rates could hurt the economy, it is not likely to occur in the short to medium term.
Risk 2 - Disposable income falls
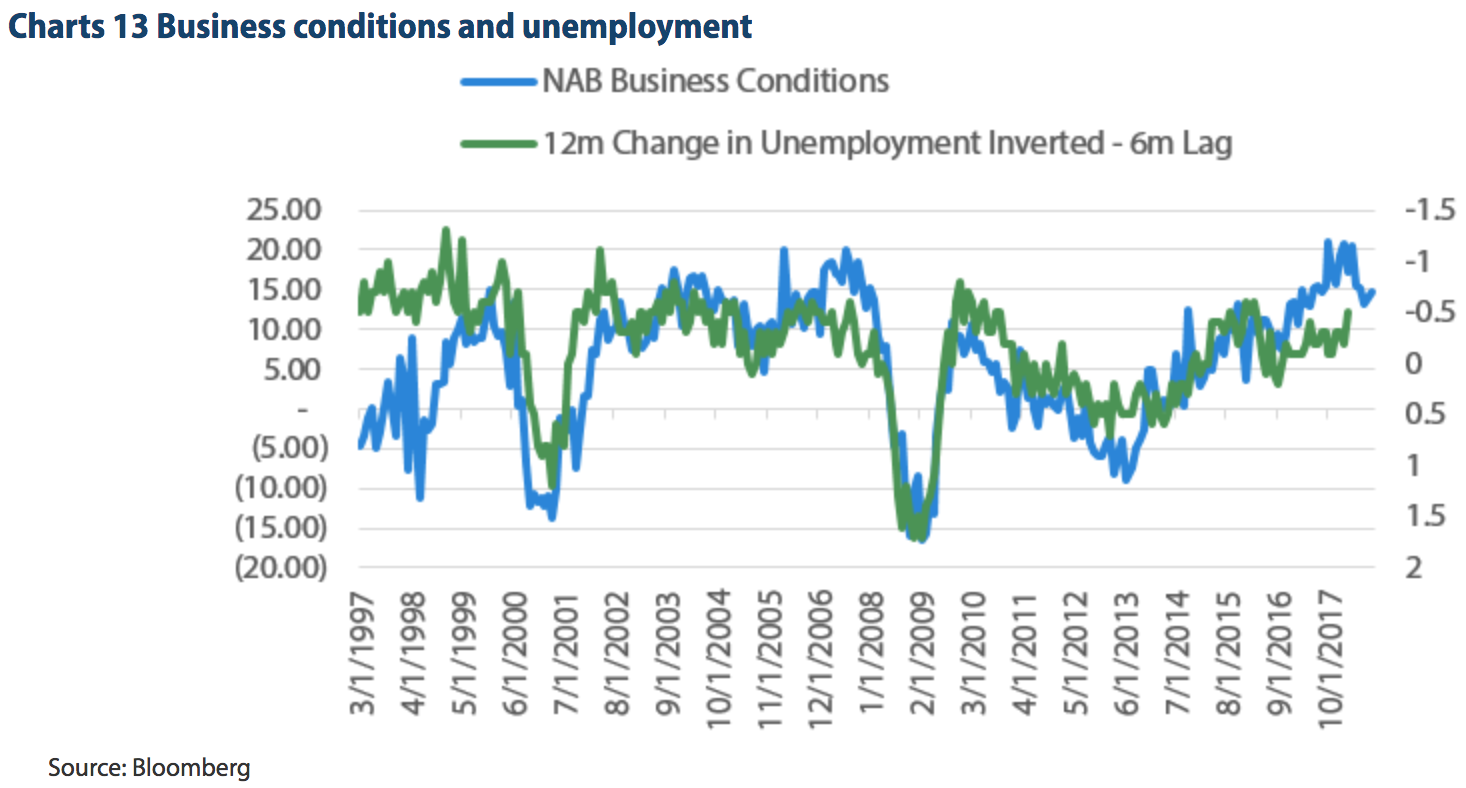
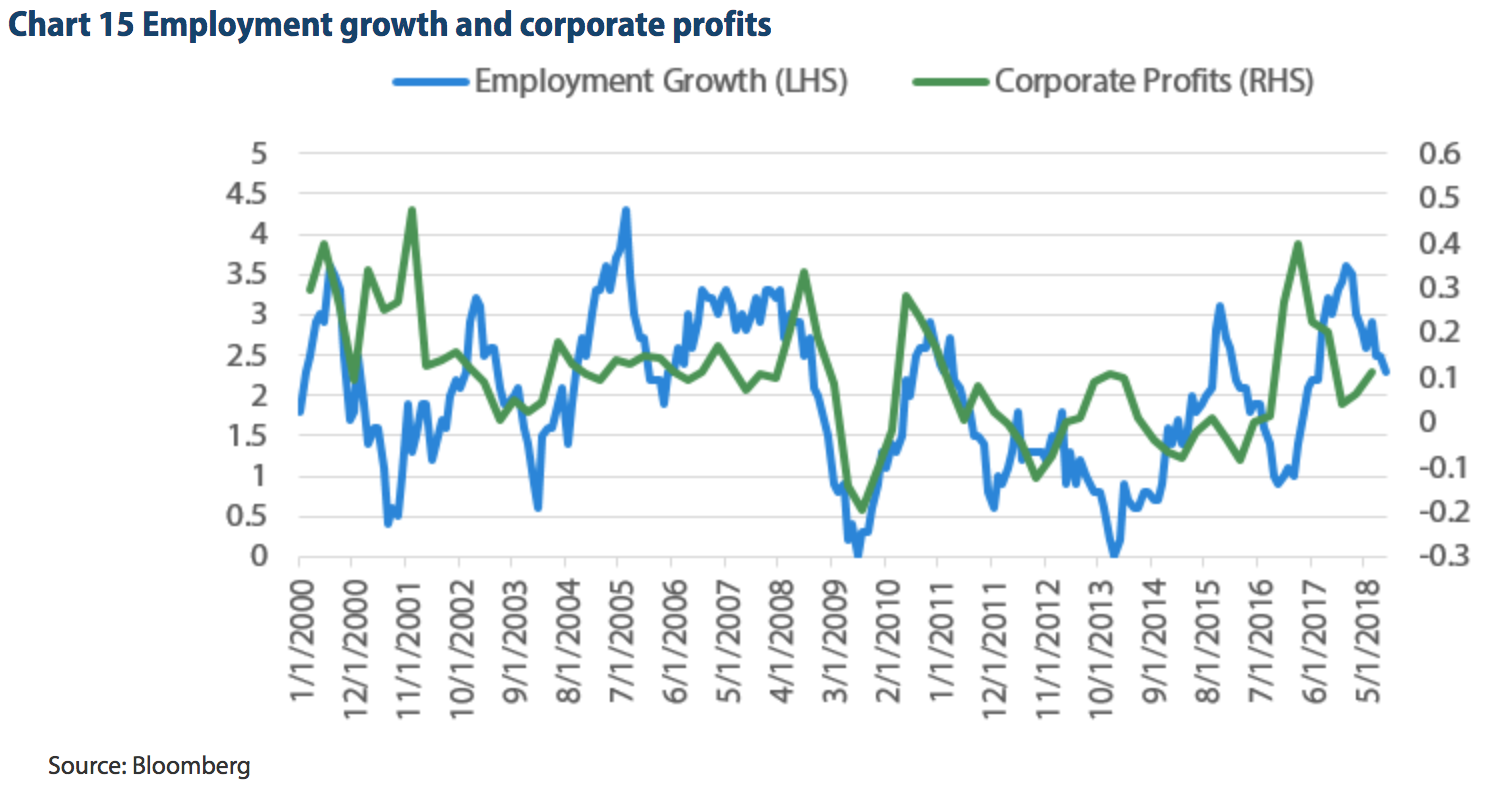
The second big risk to the household debt levels could come from falling disposable incomes, which would usually be preceded by a rise in unemployment. While an increase in unemployment would hurt, the current business environment shows that the employment situation in Australia looks strong. For example, the NAB Business Conditions survey remains just off its all-time high, which often leads the direction of unemployment by approximately six months.
Despite the positive business conditions, the current economic conditions in China bear watching as they can quickly filter into the Australian economy. One way of showing this is the effect that China can have on Australian corporate profits. When Australia records higher exports to China we subsequently see large increases in corporate profits, quite often driven by the commodity sector.
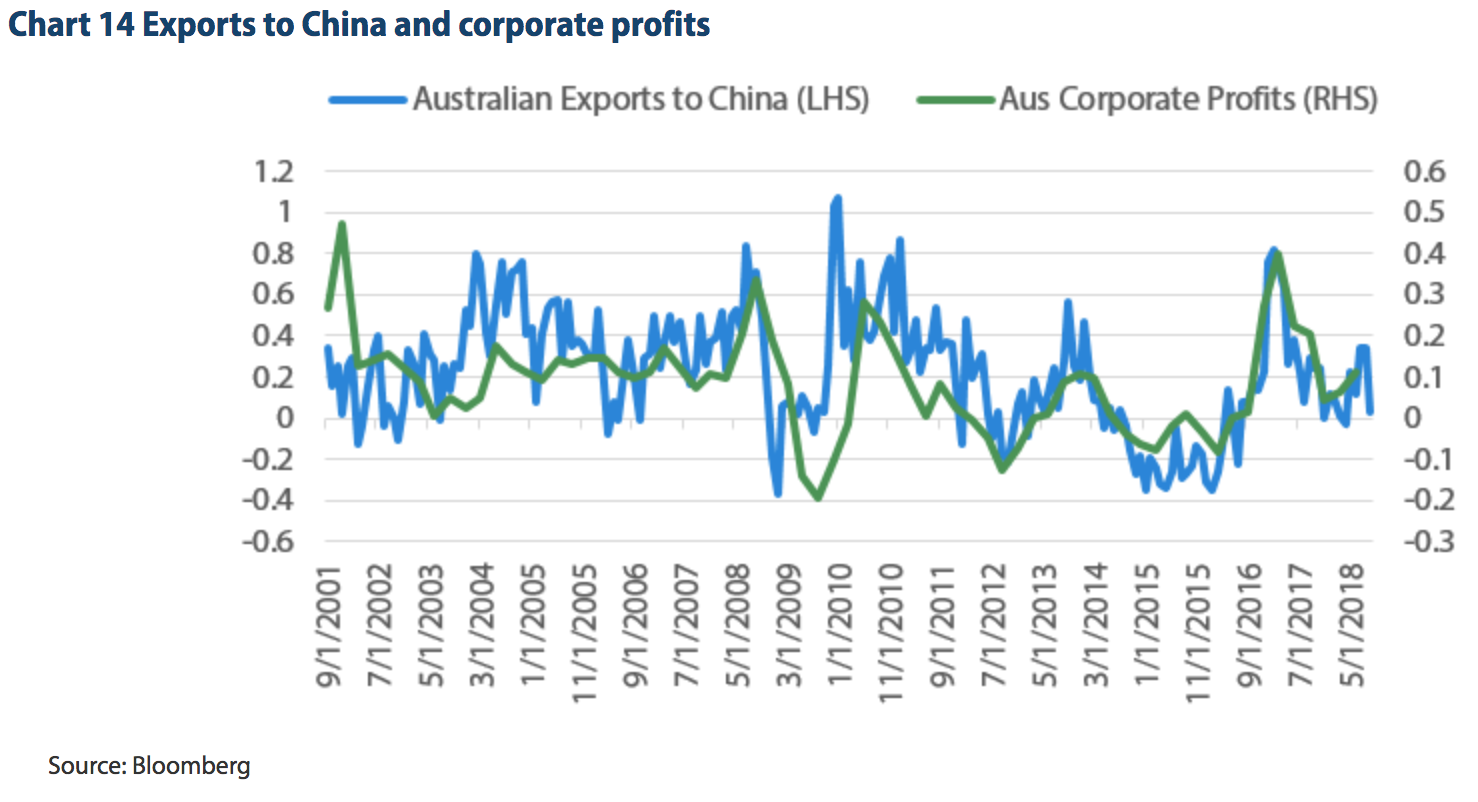
The risk here is the strong rise in corporate profits in 2017 led employers to hire more workers, driving the employment rate higher. The slowly escalating trade war between the US and China means there is an increasing risk that our exports to China will slow, which would hurt corporate profitability and potentially slow employment. This bears monitoring going forward, as declines in employment would hurt disposable income and hence run the risk that the housing slowdown intensifies with declining affordability.
Putting it together
The high household debt levels in the Australian economy make it vulnerable to risk. However, interest rates remain low, mortgage repayments are affordable and there are few signs that the declines in house prices are being driven by household stress. The declines look to be driven by tighter credit conditions, which have reduced the supply of credit for potential borrowers. This means that while house prices can continue to fall, it is less likely that it will turn into a widespread problem causing large scale defaults. The more likely outcome will be a slow burn lowering of prices, which takes the edge out of consumption and weighs against consumer confidence, leading to slower growth rather than a melt-down similar to the Global Financial Crisis.
Further Insights
For additional analysis and insights from the team at Nikko Asset Management, please visit our website.
Never miss an update
Enjoy this wire? Hit the ‘like’ button to let us know.
Stay up to date with my current content by
following me below and you’ll be notified every time I post a wire
Chris is responsible for portfolio management, including portfolio construction and trading for various Australian fixed income portfolios including the Nikko AM Australian Bond Fund at Yarra Capital Management (Nikko AM was acquired by Yarra Capital Management in April 2021). Chris has over 9 years of experience in the fixed income market. He is also co-host of the popular Australian podcast series The Rate Debate.

1 topic
Chris Rands
Co-Portfolio Manager, Fixed Income
Yarra Capital Management
Chris is responsible for portfolio management, including portfolio construction and trading for various Australian fixed income portfolios including the Nikko AM Australian Bond Fund at Yarra Capital Management (Nikko AM was acquired by Yarra...
Expertise
Comments
Comments
Sign In or Join Free to comment