Central banks vs fundamentals - making sense of the price action
In the AFR this weekend, I write that many investors who exited assets in March, or who felt they profited from the catastrophic price falls in the first few weeks of that month, have expressed surprise about the sharp recovery over April, May and June. In April almost every smart investor I talked to spoke sceptically of a“bear market rally” and seemed to be sitting on the sidelines. Click on that link to read the full column or AFR subs can click here. Excerpt enclosed:
Of course, the enormous rebound came to a halt on Thursday night when US shares plummeted six to seven per cent (depending on the measure) on the back of fears of a “second wave” of COVID-19 infections, which I will return to later.
The mid March bears who went to cash, remained under-invested, and/or held their shorts for too long have obviously underperformed during the upswing over the last three months. A common refrain has been that they cannot fathom the price action, which appears divorced from fundamentals when the world is experiencing the worst recession since the great depression.
While this is an entirely reasonable proposition, it ignores the profound influence of policymaking on asset prices. Through managing the overnight cash rate and long-term government bond yields, central banks can control underlying discount (or risk-free) rates, which are a key determinant of the value of all assets.
Central banks and treasuries can manage overall prices even more directly by initiating asset purchases or quantitative easing (QE). Since March they have done so by buying, amongst other things, government bonds, corporate bonds, high yield bonds, securitised portfolios of consumer loans, SME loans, and home loans, and, occasionally, equities.
They have also lent directly to banks and businesses to ensure that the cost of borrowing remains exactly where they want it to be. And since there is no practical limit on how much money a central bank can print or produce, there is no real constraint on their ability to control all assets prices if they are prepared to do “whatever it takes” (as they have frequently claimed of late).
The dramatic decline in credit spreads and the startling rebound in equity beta was therefore a predictable response to the most far-reaching central bank liquidity and asset purchase programs we have ever seen. This was itself the entirely necessary and justifiable reaction to the 1-in-100 year exogenous shock wrought by COVID-19.
It is also why in my own portfolios I was a net buyer of $942 million of assets as prices declined and have since net sold about $605 million as they recovered over April, May and June. And I would consider any material retracement in credit spreads on securities issued by highly rated and government-backed banks as an attractive buying opportunity.
In particular, I still like bank-issued Tier 2 subordinated bonds and Additional Tier 1 capital hybrids given they are exceptionally cheap relative to their average trading levels since the global financial crisis (and even attractive compared to levels that prevailed prior to 2008). I also personally like ANZ, NAB and Westpac shares when they are trading materially below book-value.
As UBS’s top-rated banking analyst, Jon Mott, has recently highlighted, on a price-to-book value basis ANZ, NAB and Westpac shares have been at their cheapest levels since 1993. And if you believe (as I do) that the housing market is poised to recover and that Australia’s rapid exit from containment will ensure loan losses will be no worse than what the banks have already provisioned for, there is a credible case for their returns on equity to climb back to and above the banks’ cost of equity. This implies that they should be trading at or above book value, which is why I am a buyer right now.
All of this begs the question as to what to make of Thursday night’s sell-off when US shares crashed six to seven per cent. From its 23 March low, the S&P500 rallied an incredible 44.5 per cent. For those contrarians who were willing to “fade” the March cataclysm, there is understandably going to be some decent profit-taking, which has contributed to the current 7 per cent pull-back from the S&P500 Index’s June 8 peak.
And setting aside the positive data flows as economies come back online, there is a fair bit to be negative about at present with the new China-US Cold War combined with violent disruptive global protests triggered by George Floyd’s tragic death. The claimed catalyst for Thursday night’s savage slump was a second wave of infections in the US, which has also been linked to these protests.
We've always argued that while sporadic outbreaks are likely, bona fide "second waves" in regions that have embraced proper containment strategies are unlikely. All the data to date supports this hypothesis. It is nonetheless worth revisiting our proprietary COVID-19 tracking systems, which offer a few insights.
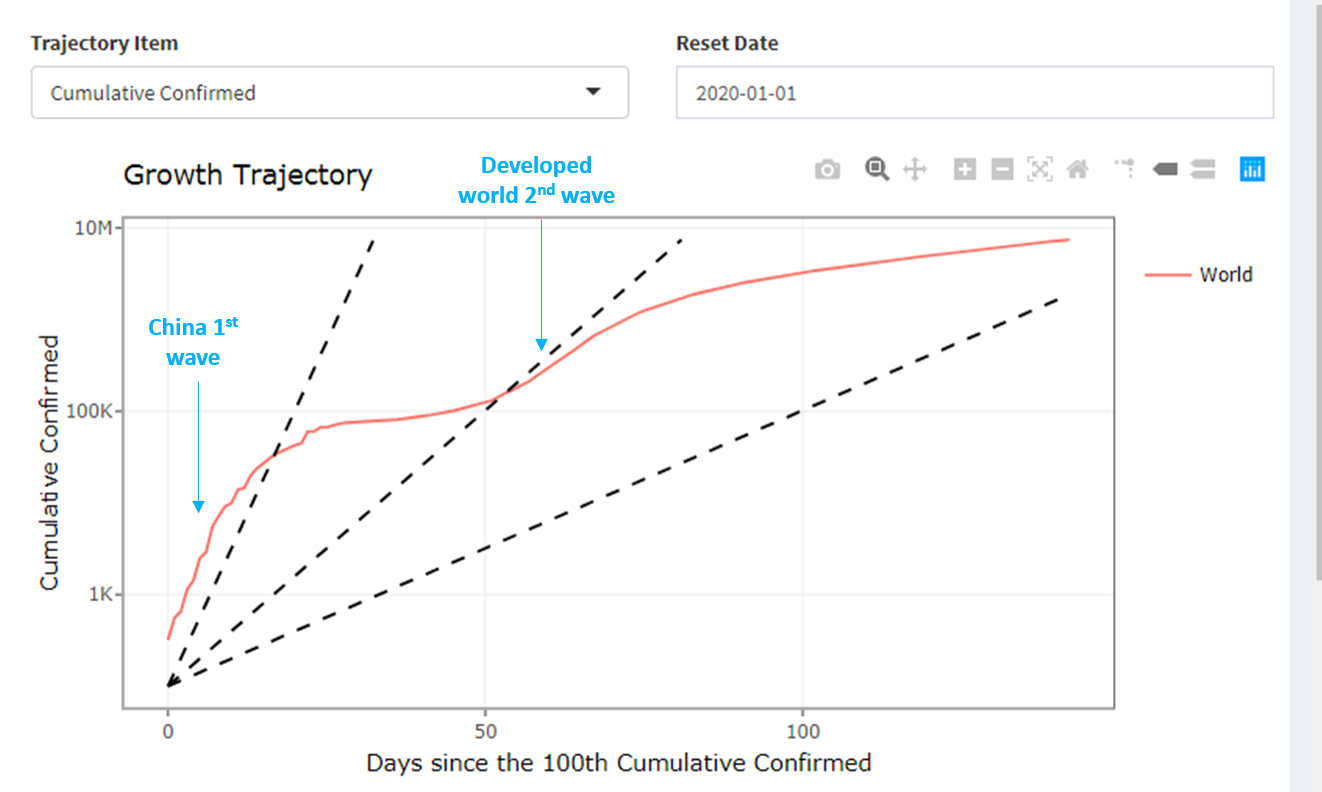
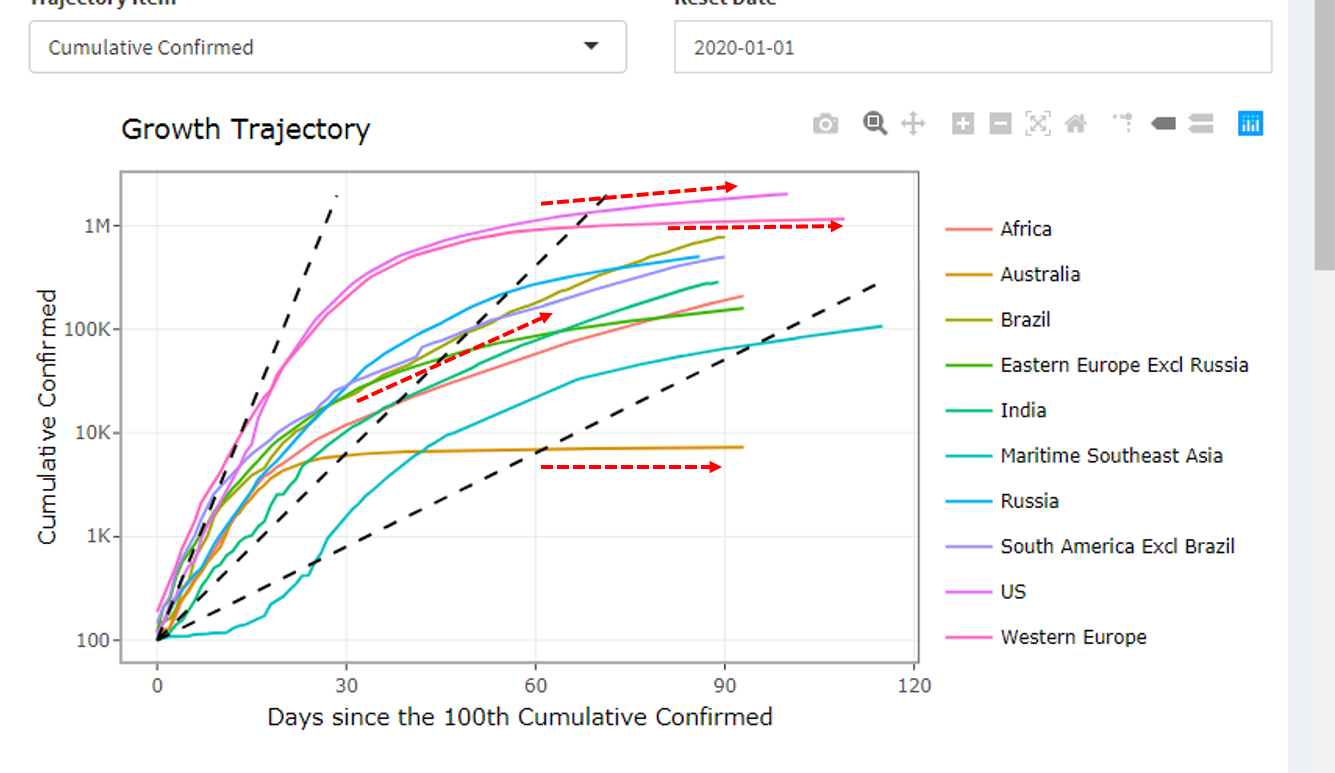
First, there is no evidence of secular second-waves within any entire country, but there is clear evidence of second and third waves at a global level simply because COVID-19 takes time to propagate from nation to nation. In our global infection curve one can see a first wave as China comes online and then flattens her curve followed by a second wave as the developed world catches COVID-19. We are now probably experiencing a third global wave as developing countries struggle to contain the virus.
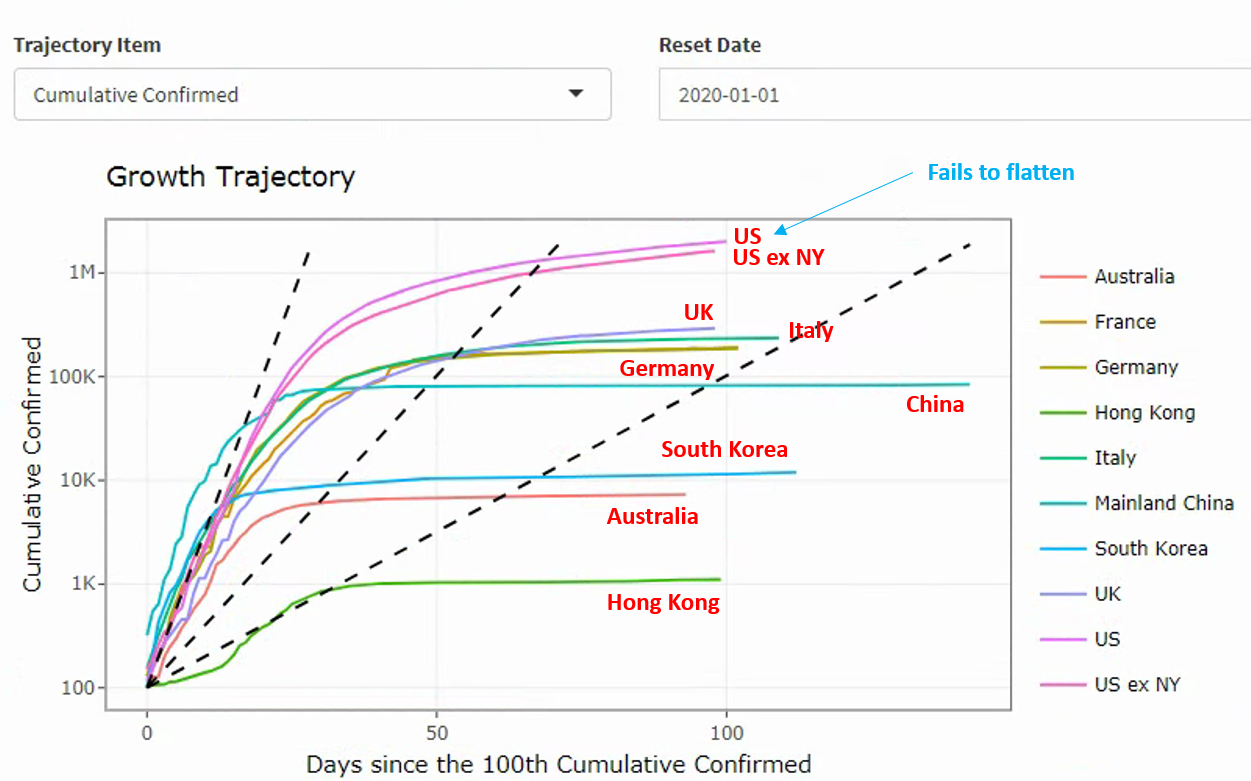
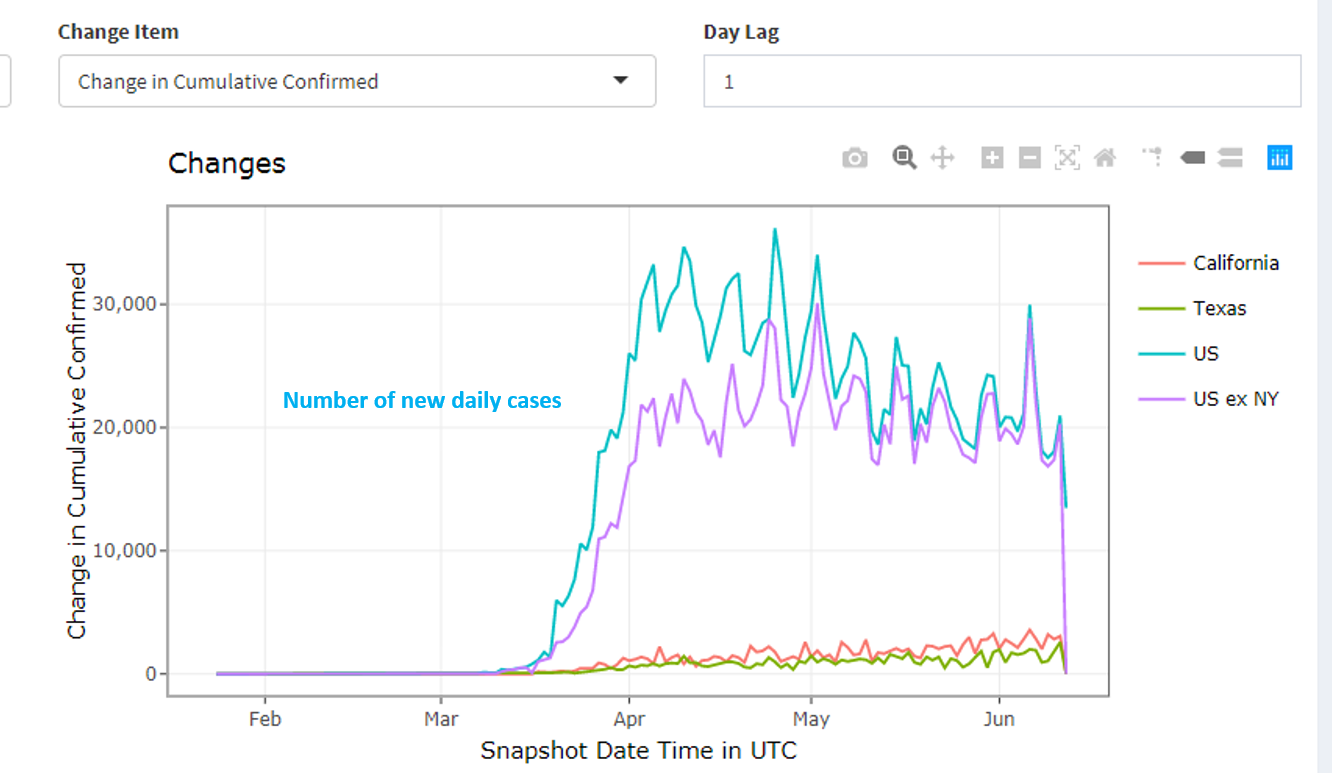
Second, although US infections peaked in early April as we originally forecast—and the US national and US ex-New York infection curves have since been flattening—they have not flattened fully like the curves of many other advanced economies such as Australia, New Zealand, South Korea, China, Germany, France, Italy, Taiwan, and the UK.
This appears to be a function of the federated structure of the US whereby early outbreaks in one state like New York have been subsequently followed by other states on a lagged basis, which means that the overall US infection numbers have been slower to decline over time.
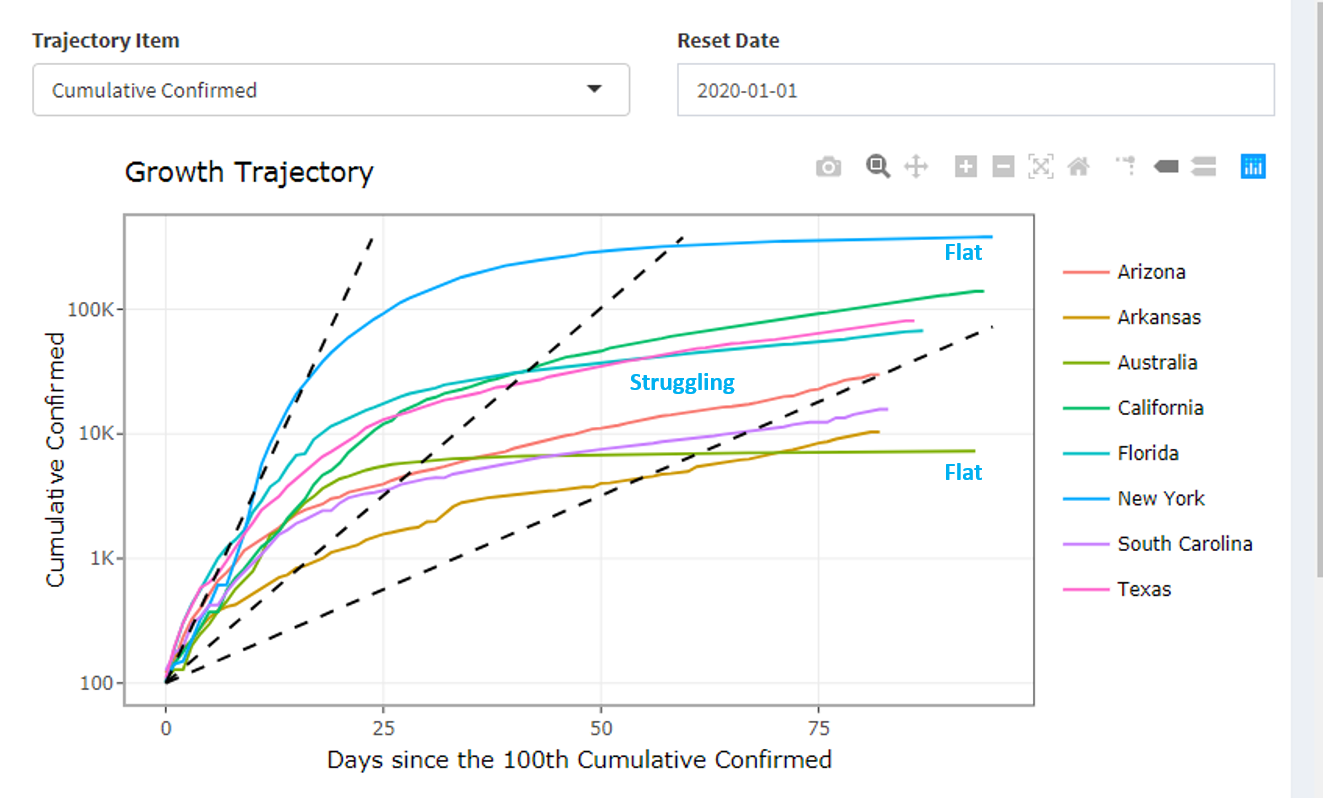
Third, it is clear that some US states have wittingly or unwittingly done a poor job of containment, which again is not that surprising: it was always likely that there would be patchy state-by-state containment results depending on the policies (and politics) of the individual state governors.
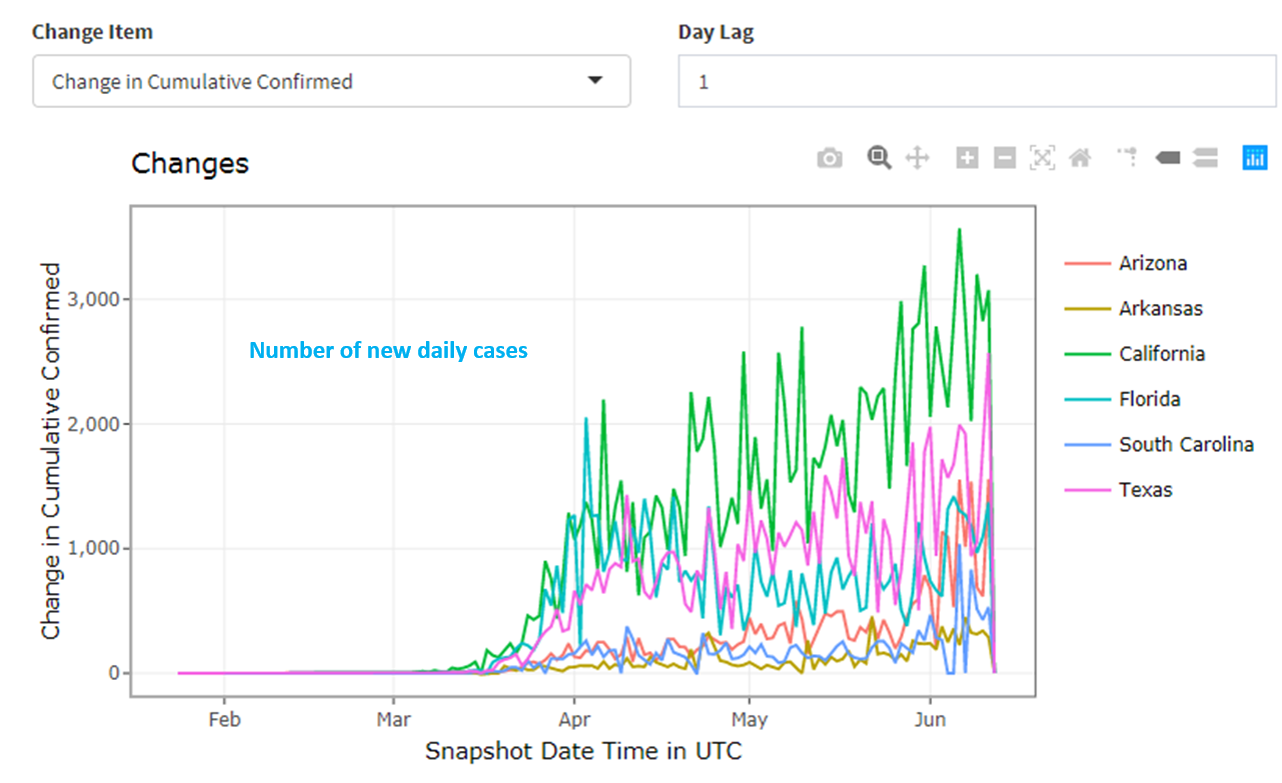
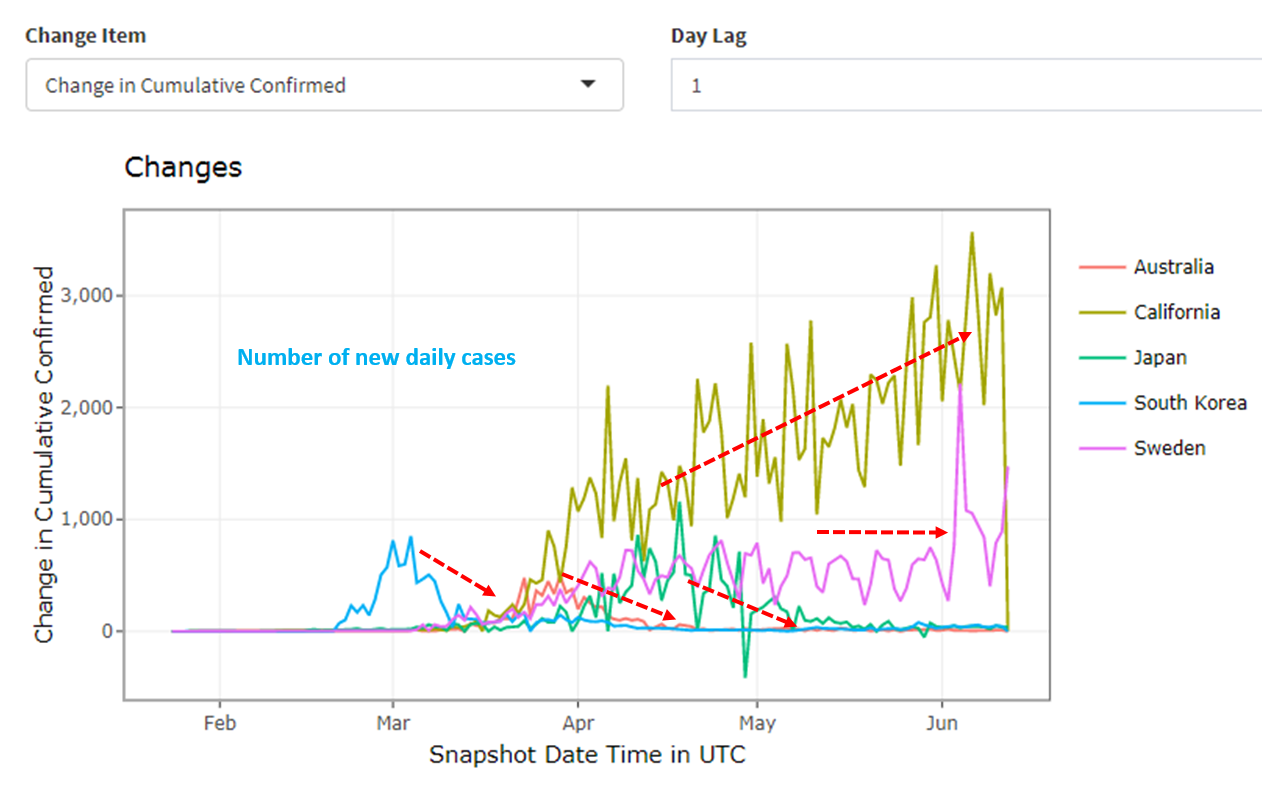
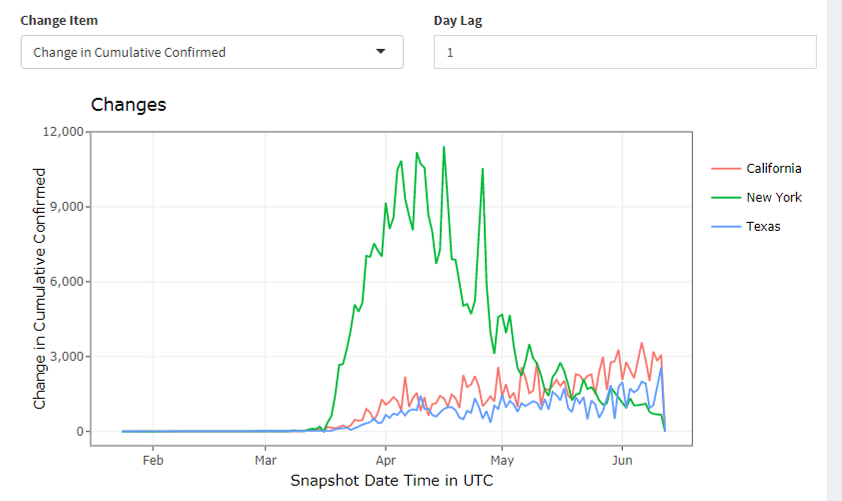
For example, whereas New York appears to have done a very good job flattening its curve, others such as California (very poor), Texas (very poor), Florida, Arizona, Arkansas, and South Carolina have not. It should be noted, however, that the early outbreak in New York was much worse than these other states, which means New York has only done better after a far more severe outbreak.
To be clear, it is not really a case of second waves in these states, but rather an outright failure to contain COVID-19 in the first place and properly flatten their curves, which has led to either consistent increases in the number of new cases and/or recent surges (eg, in Florida and Arkansas). Put differently, the first wave has been longer and stronger. And there may have been some impact from the protest movements, which have junked social distancing measures.
Indeed, there are parallels between some US states, and the US more broadly, and Sweden, which has never tried to suppress COVID-19 (or eradicate it). If we compare the number of new infections in Sweden to other countries like South Korea, Japan, and Australia, one can see that COVID-19 has effectively disappeared after an initial spike in these nations whereas in Sweden it has been tolerated with a consistent number of fresh cases over time (rather than a declining number as observed elsewhere).
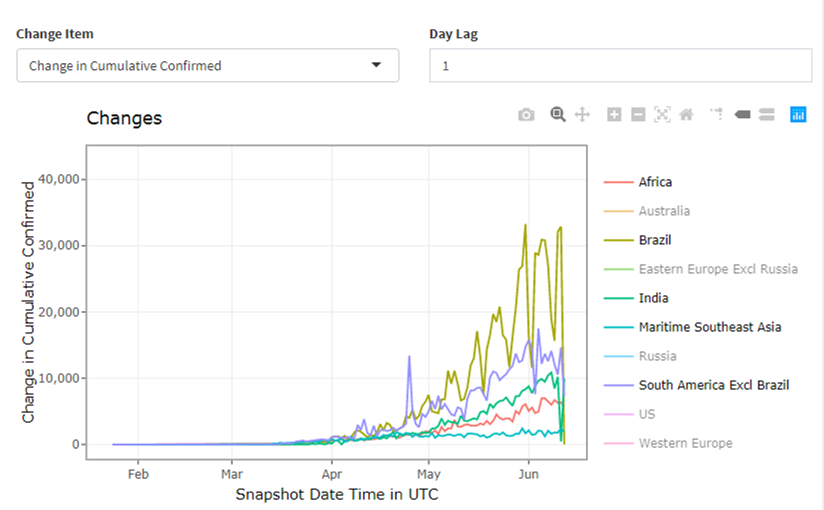
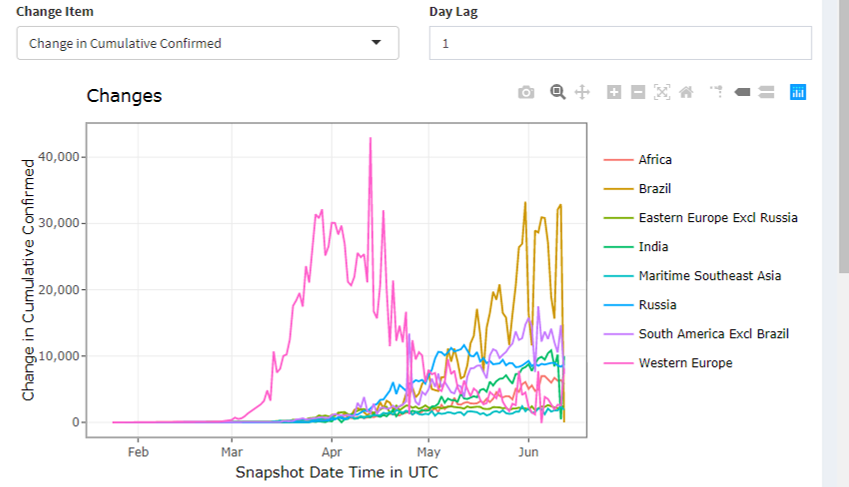
Finally, a similar infection trajectory to Sweden can been seen in the developing world where new infection numbers are increasing in Africa, Brazil, India and South America. This means that cumulative infection curves in the developing world are continuing to increase rather than flattening hard as Australia or Western Europe have done.
Get investment ideas from industry insiders
Liked this wire? Hit the follow button below to get notified every time I post a wire. Not a Livewire Member? Sign up for free today to get inside access to investment ideas and strategies from Australia’s leading investors.
Never miss an update
Enjoy this wire? Hit the ‘like’ button to let us know.
Stay up to date with my current content by
following me below and you’ll be notified every time I post a wire
Chris co-founded Coolabah in 2011, which today runs over $8 billion with a team of 40 executives focussed on generating credit alpha from mispricings across fixed-income markets. In 2019, Chris was selected as one of FE fundinfo’s Top 10 “Alpha Managers” based on his risk-adjusted performance throughout his career across. He previously worked for Goldman Sachs in London and Sydney, the Reserve Bank of Australia, and founded the award‐winning research/investment group, Rismark. He has regularly advised governments, developing unique policy proposals. Chris graduated with the University Medal (Economics & Finance) from Sydney University. He studied in the PhD program at Cambridge University in 2002/03, leaving to set up his funds business.
........
General Disclaimer:
Past performance does not assure future returns. All investments carry risks, including that the value of investments may vary, future returns may differ from past returns, and that your capital is not guaranteed. This information has been prepared by Coolabah Capital Investments Pty Ltd (ACN 153 327 872). It is general information only and is not intended to provide you with financial advice. You should not rely on any information herein in making any investment decisions. To the extent permitted by law, no liability is accepted for any loss or damage as a result of any reliance on this information. The Product Disclosure Statement (PDS) for the funds should be considered before deciding whether to acquire or hold units in it. A PDS for these products can be obtained by visiting www.coolabahcapital.com. Neither Coolabah Capital Investments Pty Ltd, EQT Responsible Entity Services Ltd (ACN 101 103 011), Equity Trustees Ltd (ACN 004 031 298) nor their respective shareholders, directors and associated businesses assume any liability to investors in connection with any investment in the funds, or guarantees the performance of any obligations to investors, the performance of the funds or any particular rate of return. The repayment of capital is not guaranteed. Investments in the funds are not deposits or liabilities of any of the above-mentioned parties, nor of any Authorised Deposit-taking Institution. The funds are subject to investment risks, which could include delays in repayment and/or loss of income and capital invested. Past performance is not an indicator of nor assures any future returns or risks. Coolabah Capital Institutional Investments Pty Ltd holds Australian Financial Services Licence No. 482238 and is an authorised representative #001277030 of EQT Responsible Entity Services Ltd that holds Australian Financial Services Licence No. 223271. Equity Trustees Ltd that holds Australian Financial Services Licence No. 240975.
Forward-Looking Disclaimer:
This information may contain some forward-looking statements. These statements are not guarantees of future performance and undue reliance should not be placed on them. Such forward-looking statements necessarily involve known and unknown risks and uncertainties, which may cause actual performance and financial results in future periods to differ materially from any projections of future performance or result expressed or implied by such forward-looking statements. Coolabah Capital Investments Pty Ltd undertakes no obligation to update forward-looking statements if circumstances or management’s estimates or opinions should change except as required by applicable securities laws. The reader is cautioned not to rely on forward-looking statements.

5 topics

Chris co-founded Coolabah in 2011, which today runs over $8 billion with a team of 40 executives focussed on generating credit alpha from mispricings across fixed-income markets. In 2019, Chris was selected as one of FE fundinfo’s Top 10 “Alpha...
Expertise
Chris co-founded Coolabah in 2011, which today runs over $8 billion with a team of 40 executives focussed on generating credit alpha from mispricings across fixed-income markets. In 2019, Chris was selected as one of FE fundinfo’s Top 10 “Alpha...
Expertise
Comments
Comments
Sign In or Join Free to comment