Chart of the day: More Aussie jobs lost…but is the pace slowing?
“My model for business is The Beatles: They were four guys that kept each others’ negative tendencies in check; they balanced each other. And the total was greater than the sum of the parts.” Steve Jobs
Yesterday the Australian Bureau of Statistics (ABS) released (for just the second time) weekly job ‘payrolls data’ for Australia. As we highlighted two weeks ago, this is by far the most accurate jobs data we have, drawing from the ATO's Single Touch Payroll system covering 99% of larger employers (those with more than 20 staff) and 71% of small employers (those with less than 20 staff). The long-standing monthly report surveys only 26,000 households, only 0.32% of the population over 15 years old. Moreover, the new data is more up to date—the monthly jobs data is giving us information from the survey in early March, whereas this has data to 18 April.
The data to 18 April, released yesterday, shows we lost a further 1.7% of jobs off the payroll, taking the total loss through the COVID-19 crisis to a massive 7.5%. According to UBS’s estimates, that equates to a loss of 975,000 jobs—let’s call it a million—since mid-March. Now, it’s hard to estimate the precise implication of that for the unemployment rate, as around 10% of the workforce hold second jobs (and may have lost one of them and thus are not truly ‘unemployed’). But the direction is clear, and the next couple of months will likely see the unemployment rate spike to 10% (from 5.2% currently).
While any rise in unemployment is disappointing, more positively, yesterday’s data did reveal the pace of job losses has slowed from the initial onslaught. This is better than I expected it to be, given that in early April we were in the thick of the shutdowns. The pace of job loss in the first three weeks to 4 April was roughly 1.9% per week. However, over the two weeks to 18 April, that slowed to 0.9% per week. The pace at which the total wages paid has fallen also eased from 1.9% per week to 1.3%. Of course, this wage drop through COVID-19 of $22 billion equates to 4.5% of GDP (according to UBS) and will be a significant dampener on Q2 growth (expected to collapse 10%). Still, if we are trying to gauge the timing or recovery, with Prime Minister Morrison pushing the states to ease restrictions this week, this is a ‘less bad’ set of data than we have been getting over recent weeks.
Our chart today comes from CBA Economics and shows the job losses by sector from 14 March to 18 April. The chart draws out just how ‘uneven’ the loss of jobs has been across the economy. Some services sectors have been devastated with job losses of around one-third of the entire sector, such as the accommodation, food, arts and recreation sectors. Others significantly impacted, like retail, agriculture, admin and support, rental and hiring, real estate and other services, have seen job losses of around 10%. In contrast, more than a third of the sector breakdown has had job losses of less than 5%, with many less than 3%, such as utilities, mining, finance, education, transport and healthcare.
Jobs change from 14 March to 18 April 2020 (% change)
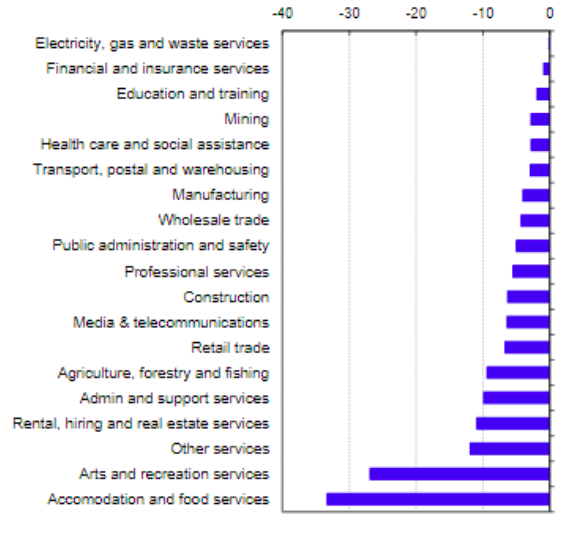
Source: CBA Economics.
Be the first to know
I’ll be sharing Crestone Wealth Management's views as new developments unfold. Click the ‘FOLLOW’ button below to be the first to hear from us.
Never miss an update
Enjoy this wire? Hit the ‘like’ button to let us know.
Stay up to date with my current content by
following me below and you’ll be notified every time I post a wire
Scott has more than 20 years’ experience in global financial markets and investment banking, providing extensive economics research and investment strategy across equity and fixed income markets.
........
General advice notice: Unless otherwise indicated, any financial product advice in this email is general advice and does not take into account your objectives, financial situation or needs. You should consider the appropriateness of the advice in light of these matters, and read the Product Disclosure Statement for each financial product to which the advice relates, before taking any action. © Crestone Wealth Management Limited ABN 50 005 311 937 AFS Licence No. 231127. This email (including attachments) is for the named person’s use only and may contain information which is confidential, proprietary or subject to legal or other professional privilege. If you have received this email in error, confidentiality and privilege are not waived and you must not use, disclose, distribute, print or copy any of the information in it. Please immediately delete this email (including attachments) and all copies from your system and notify the sender. We may intercept and monitor all email communications through our networks, where legally permitted

1 topic
1 contributor mentioned

Scott has more than 20 years’ experience in global financial markets and investment banking, providing extensive economics research and investment strategy across equity and fixed income markets.
Expertise
Scott has more than 20 years’ experience in global financial markets and investment banking, providing extensive economics research and investment strategy across equity and fixed income markets.
Expertise
Comments
Comments
Sign In or Join Free to comment